
Fractals in Forex - What You Need to Know
 You are unlikely to find even one beginner in the Forex market who would not know what a fractal is. And outside the market, quite a few people have heard of such a concept as well. Fractals have been known for almost a century, are well studied, and have many applications in life. At the core of this phenomenon lies a very simple idea: an infinitely beautiful and diverse multitude of shapes can be obtained from relatively simple constructions by means of just two operations - copying and scaling.
Fractals have been used in financial markets for quite a long time already; even classic trading strategies mention them. For example, Bill Williams' well-known trading strategy Profitunity uses fractals as one of the system elements. Today this indicator is the hero of our review: we will learn the history of its appearance, see what kinds of fractals exist, and in the forum thread you will be able to familiarize yourself with more than a hundred varieties of this indicator)
What Is a Fractal?

The concept of a "fractal" has no strict definition. Therefore, this word is not a mathematical term. Usually this is the name given to a geometric figure that satisfies one or more of the following properties:
- has a complex structure at any magnification;
- is (approximately) self-similar;
- has a fractional Hausdorff (fractal) dimension that is greater than the topological one;
- can be constructed by recursive procedures.
History of Origin

At the turn of the XIX and XX centuries, the study of fractals was rather episodic than systematic in nature. Earlier, mathematicians mostly studied objects that could be investigated using general methods and theories.
In 1872, the German mathematician Karl Weierstrass constructed an example of a continuous function that is nowhere differentiable. However, his construction was entirely abstract and difficult to perceive. Therefore, in 1904, the Swede Helge von Koch came up with a continuous curve that has no tangent anywhere, and it is quite easy to draw. It turned out that it possesses fractal properties. One of the variants of this curve is called the "Koch snowflake."
The ideas of self-similar figures were taken up by the Frenchman Paul Pierre Levy, the future mentor of Benoit Mandelbrot. In 1938, his article "Plane and Spatial Curves and Surfaces Consisting of Parts Similar to the Whole" was published, describing another fractal — Levy's C curve. All of the above-mentioned fractals can conditionally be assigned to one class of constructive (geometric) fractals.

Another class — dynamic, or algebraic fractals, to which the Mandelbrot set also belongs. The first studies in this direction date back to the beginning of the XX century and are associated with the names of the French mathematicians Gaston Julia and Pierre Fatou. In 1918, Julia's almost two-hundred-page work devoted to iterations of complex rational functions was published, in which Julia sets were described - a whole family of fractals closely related to the Mandelbrot set. This work received a prize from the French Academy, but it contained not a single illustration, so it was impossible to appreciate the beauty of the discovered objects. Despite the fact that this work made Julia famous among mathematicians of that time, it was forgotten rather quickly.
Attention returned to the works of Julia and Fatou only half a century later, with the appearance of computers: it was they that made the richness and beauty of the world of fractals visible. After all, Fatou could never look at the images that we now know as images of the Mandelbrot set, because the required amount of calculations is impossible to carry out manually. The first to use a computer for this was Benoit Mandelbrot.
In 1982, Mandelbrot's book "The Fractal Geometry of Nature" was published, in which the author collected and systematized almost all the information on fractals available at that moment and presented it in an easy and accessible manner. In his presentation, Mandelbrot placed the main emphasis not on heavyweight formulas and mathematical constructions, but on the readers' geometric intuition.
Thanks to illustrations obtained with the help of a computer and to the historical anecdotes with which the author skillfully diluted the scientific component of the monograph, the book became a bestseller, and fractals became known to the general public. Their success among non-mathematicians is largely due to the fact that with the help of very simple constructions and formulas, which even a high school student can understand, images astonishing in complexity and beauty are obtained.
When personal computers became powerful enough, there even appeared an entire direction in art - fractal painting, and practically any computer owner could engage in it. Now on the internet you can easily find many sites devoted to this subject.
After this brief excursion into history, let us now become acquainted with the classification of fractal types as of today.
Geometric Fractals

It was with them, as you have already understood, that the history of fractals began. This type of fractal is obtained through simple geometric constructions. First, a base is drawn. Then some parts of the base are replaced with a fragment. At each next stage, parts of the already constructed figure that are analogous to the replaced parts of the base are again replaced with a fragment taken at an appropriate scale. Each time the scale decreases. When the changes become visually imperceptible, it is considered that the constructed figure approximates the fractal well and gives an idea of its shape. To obtain the fractal itself, an infinite number of stages is needed. By changing the base and the fragment, many different geometric fractals can be obtained.
Geometric fractals are good because, on the one hand, they are the subject of quite serious scientific study, and on the other hand, they can be seen. Even a person far from mathematics will find something in them for themselves. Such a combination is rare in modern mathematics, where all objects are defined with the help of incomprehensible words and symbols.
Many geometric fractals can literally be drawn on a sheet of graph paper. It is important to understand that all the resulting images are only finite approximations of fractals that are infinite in essence. But it is always possible to draw such an approximation that the eye will not distinguish the very small details and our imagination will be able to create a correct picture of the fractal.
For example, having a sufficiently large sheet of millimeter paper and a supply of free time, one can manually draw such an accurate approximation to the Sierpinski carpet that from a distance of several meters the naked eye will perceive it as a real fractal. A computer will save time and paper and at the same time further increase the drawing accuracy.
Koch Snowflake
This is one of the very first fractals studied by scientists. The snowflake is obtained from three copies of the Koch curve, which first appeared in an article by the Swedish mathematician Helge von Koch in 1904. This curve was invented as an example of a continuous line to which it is impossible to draw a tangent at any point. Lines with such a property were known earlier as well, but the Koch curve is remarkable for the simplicity of its construction.
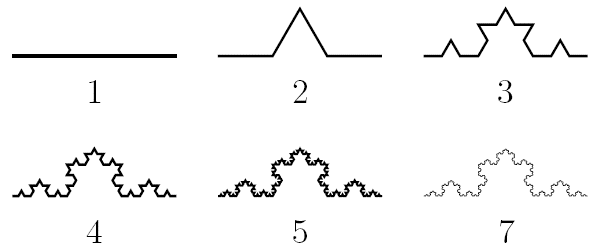 The Koch curve is continuous, but nowhere differentiable. Roughly speaking, that is exactly why it was invented — as an example of this kind of mathematical "freak."
The Koch curve has infinite length. Let the length of the original segment be 1. At each construction step, we replace each of the segments making up the line with a broken line that is 4/3 times longer. This means that the length of the entire broken line at each step is also multiplied by 4/3: the length of line number n is equal to (4/3)n–1. Therefore, the limiting line has no choice but to be infinitely long.
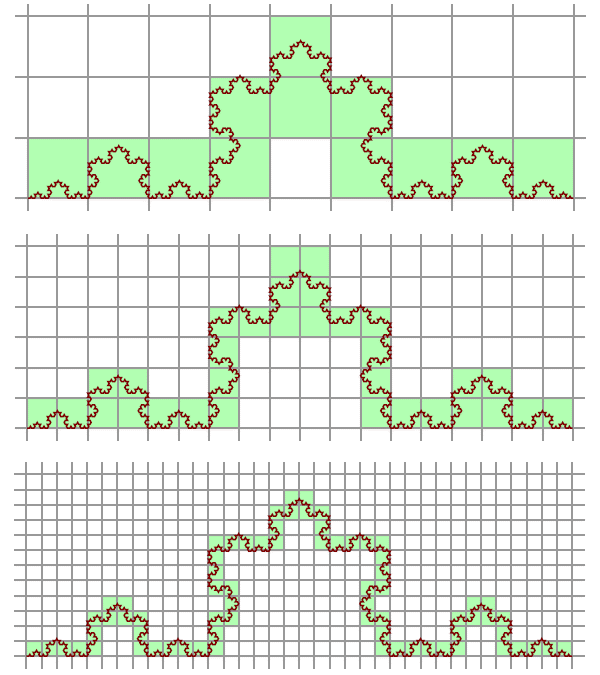 The Koch snowflake encloses a finite area. And this despite the fact that its perimeter is infinite. This property may seem paradoxical, but it is obvious - the snowflake fits entirely inside a circle, so its area is certainly bounded. The area can be calculated, and no special knowledge is even required for this - the formulas for the area of a triangle and the sum of a geometric progression are taught in school.
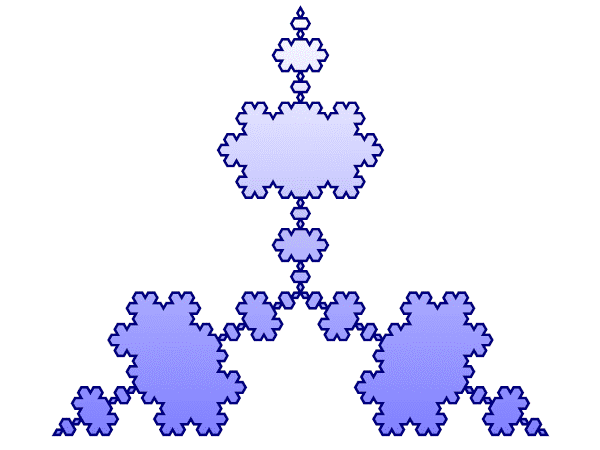
Koch Snowflake in Reverse
The Koch snowflake in reverse is obtained if the Koch curves are constructed inward, inside the original equilateral triangle.
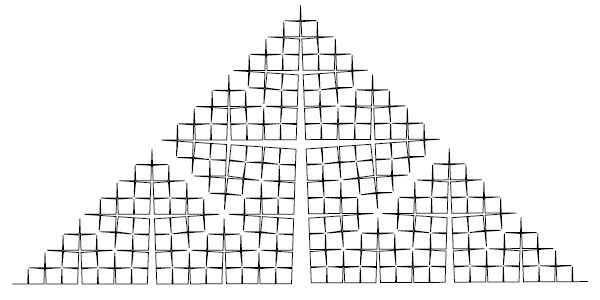
 Cesaro Lines
Instead of equilateral triangles, isosceles ones are used with a base angle from 60° to 90°. In the figure below, the angle is 88°.
 Square Variant
Squares are added here.
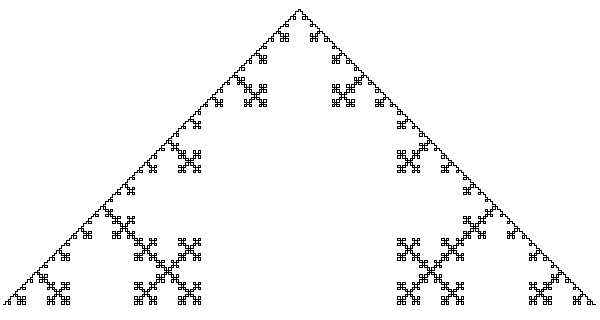 Koch Pyramid
 T-square
The construction begins with a unit square. The first step is to color a square with side 1/2 white in the center. Then you need to mentally divide the square into 4 equal parts and color a square with side 1/4 white in the center of each of them. Next, each of these 4 squares is again divided into 4 parts, giving a total of 16 small squares, and the same must be done with each of them. And so on.
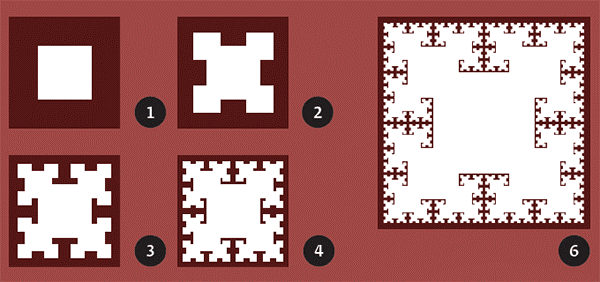 The fractal dimension of the white-shaded part is equal to log24 = 2. It is dense everywhere in the original square. This means that no matter which point of the square we take, white points will be found in any, arbitrarily small neighborhood around it. That is, in the end almost everything became white — the area of the remainder is equal to 0, while the fractal occupies an area of 1. But the length of the boundary of the white part is infinite.
H-fractal
Everything begins with a figure in the shape of the letter H, whose vertical and horizontal segments are equal. Then a copy of it, reduced by half, is added to each of the 4 ends of the figure. To each end (there are already 16 of them), a copy of the letter H reduced by a factor of 4 is added. And so on. In the limit, a fractal is obtained that visually almost fills some square. The H-fractal is dense everywhere in it. That is, in any neighborhood of any point of the square there will be points of the fractal. This is very similar to what happens with the T-square. This is no accident, because if you look closely, you can see that each letter H is contained in its own small square, which was added at the same step.
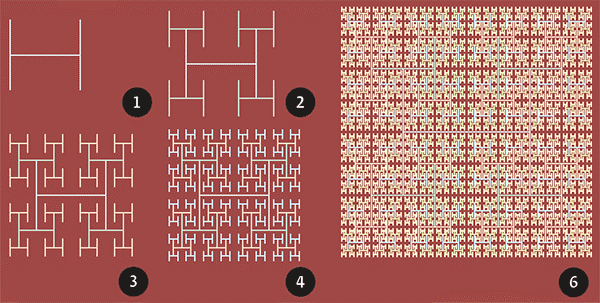 It can be said (and proved) that the H-fractal fills its square (English: space-filling curve). Therefore its fractal dimension is equal to 2. The total length of all the segments is infinite.
The principle behind constructing the H-fractal is used in the production of electronic microchips: if it is necessary for a large number of elements in a complex circuit to receive the same signal simultaneously, they can be arranged at the ends of the segments of an appropriate H-fractal iteration and connected accordingly.
Mandelbrot Tree
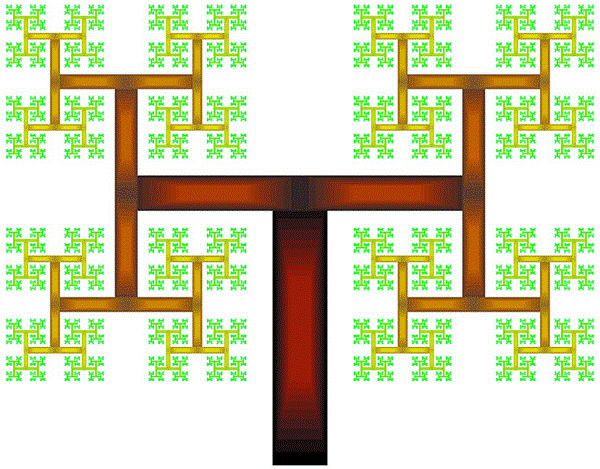
The Mandelbrot tree is obtained if you draw thick letters H made of rectangles rather than segments:
 Pythagoras Tree
It is called this because each triple of pairwise touching squares bounds a right triangle, producing a picture often used to illustrate the Pythagorean theorem - "Pythagorean pants are equal in all directions."
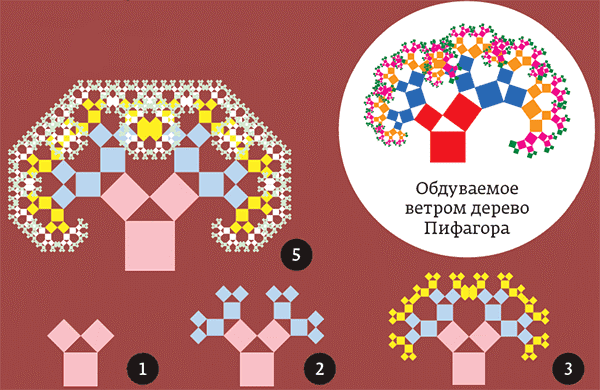 It is clearly visible that the entire tree is bounded. If the largest square is a unit square, then the tree will fit into a 6 × 4 rectangle. This means its area does not exceed 24. But, on the other hand, each time twice as many triples of little squares are added as in the previous step, while their linear dimensions are √2 times smaller. Therefore at each step the same area is added, equal to the area of the initial configuration, namely 2. It would seem, then, that the area of the tree should be infinite! But in fact there is no contradiction here, because rather quickly the little squares begin to overlap and the area does not grow that fast. It is still finite, but apparently its exact value is still unknown, and this is an open problem.
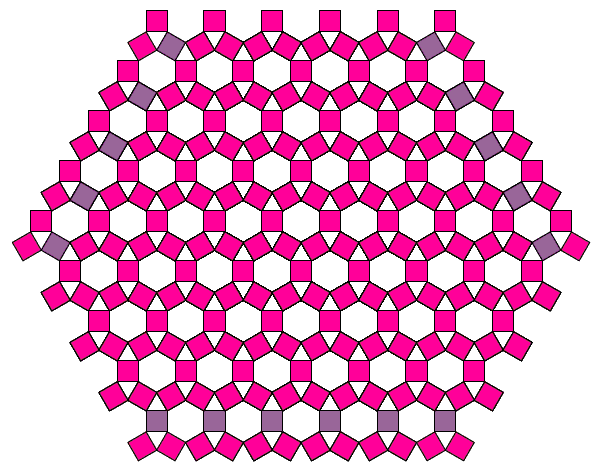
If the angles at the base of the triangle are changed, somewhat different tree shapes are obtained. And at an angle of 60° all three squares will turn out to be equal, and the tree will turn into a periodic pattern on the plane:
 You can even replace squares with rectangles. Then the tree will resemble real trees more closely. And with a certain amount of artistic processing, quite realistic images are obtained.
Peano Curve
For the first time, such an object appeared in an article by the Italian mathematician Giuseppe Peano in 1890. Peano was trying to find at least some kind of visual explanation for the fact that a segment and a square are equipotent (if considered as sets of points), that is, they contain the same number of points. This theorem had previously been proved by Georg Cantor within the framework of the set theory he invented. However, such results contradicting intuition caused great skepticism toward the new theory. Peano's example, the construction of a continuous mapping from a segment onto a square, became a good confirmation that Cantor was right.
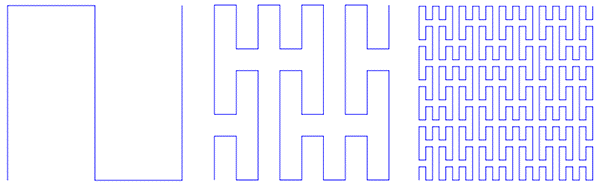 Curiously, there was not a single illustration in Peano's article. Sometimes the expression "Peano curve" refers not to a specific example, but to any curve that fills part of a plane or space.
Hilbert curve
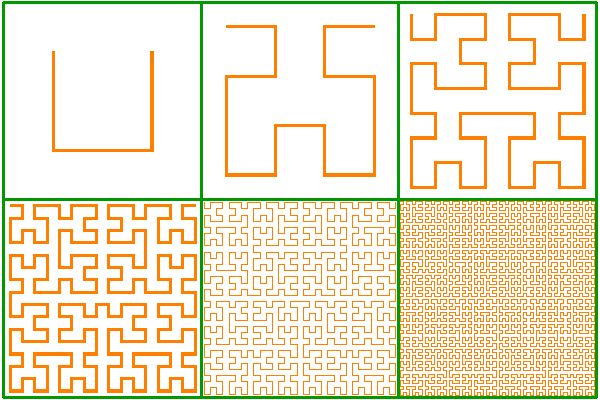 This curve (the Hilbert curve) was described by David Hilbert in 1891. We can see only finite approximations to the mathematical object that is meant here: it itself will appear in the limit only after an infinite number of operations.
Greek cross fractal
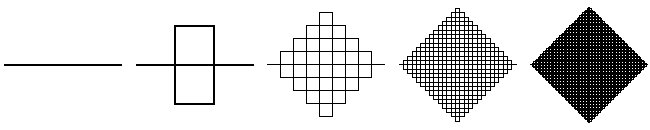 Another interesting example is the "Greek cross" fractal.
Gosper curve
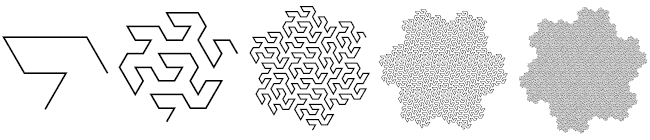 The Gosper curve, or Gosper snowflake, is another variation of curved lines.
Levy curve
Although this object was studied by the Italian Ernesto Cesaro back in 1906, its self-similarity and fractal properties were investigated in the 1930s by the Frenchman Paul Pierre Levy. The fractal dimension of the boundary of this fractal is approximately 1,9340. But this is quite a complicated mathematical result, and the exact value is unknown.
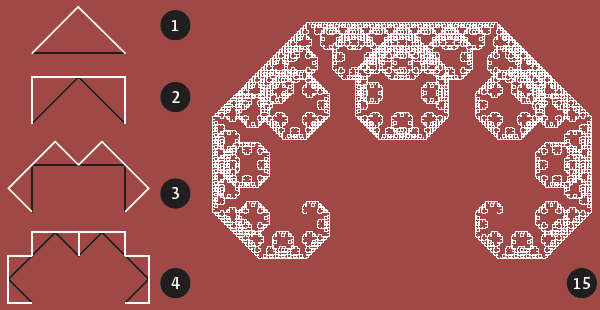 Because of its resemblance to the letter "C" written in an ornate font, it is also called the Levy C-curve. If you look closely, you can notice that the Levy curve resembles the shape of the crown of the Pythagoras tree.
Hilbert cube
And there are also three-dimensional analogues of such lines. For example, the three-dimensional Hilbert curve, or Hilbert cube.
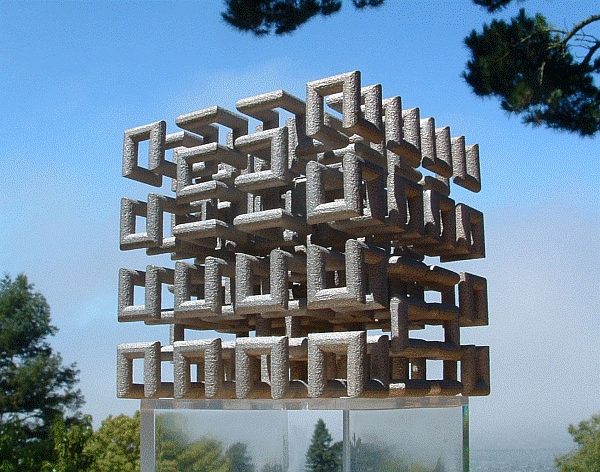 An elegant metal version of the three-dimensional Hilbert curve (third iteration), created by Carlo Sequin, a professor of computer science at the University of California, Berkeley.
Sierpinski triangle
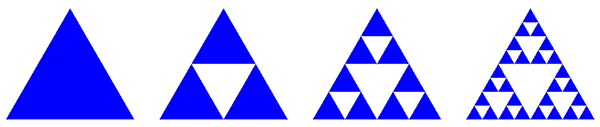 This fractal was described in 1915 by the Polish mathematician Waclaw Sierpinski. To obtain it, you need to take an equilateral triangle with its interior, draw the midlines in it, and throw away the central one of the four resulting small triangles. Then the same steps must be repeated with each of the remaining three triangles, and so on. The picture shows the first three steps, and in the flash demonstration you can practice and obtain steps all the way up to the tenth.
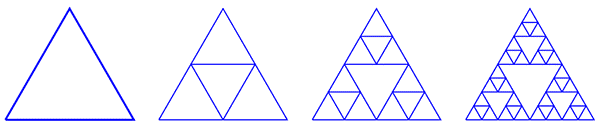 Throwing away the central triangles is not the only way to eventually obtain the Sierpinski triangle. You can move "in the opposite direction": take an initially "empty" triangle, then complete inside it the triangle formed by the midlines, then do the same in each of the three corner triangles, and so on. At first the figures will differ greatly, but as the iteration number grows they will resemble each other more and more, and in the limit they will coincide.
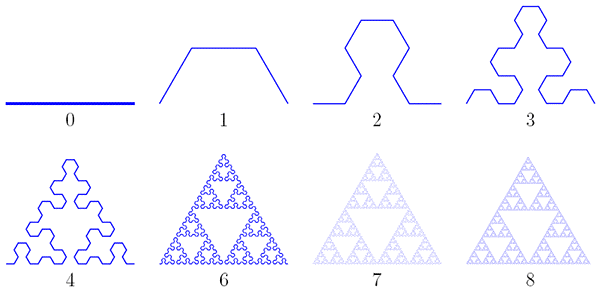 The next way to obtain the Sierpinski triangle is even more similar to the usual scheme for constructing geometric fractals by replacing parts of the current iteration with a scaled fragment. Here, at each step the segments forming the broken line are replaced with a broken line of three links (it itself appears in the first iteration). This broken line must be laid off alternately to the right and to the left. It is clear that already the eighth iteration is very close to the fractal, and the further it goes, the closer the line will come to it.
Sierpinski carpet (square, napkin)
The respected mathematician did not stop at triangles, and in 1916 he described a square version. He managed to prove that any curve that can be drawn on a plane without self-intersections is homeomorphic to some subset of this perforated square. Like the triangle, the square can be obtained from different constructions. On the right is the classic method: dividing the square into 9 parts and discarding the central part. Then the same is repeated for the remaining 8 squares, and so on.
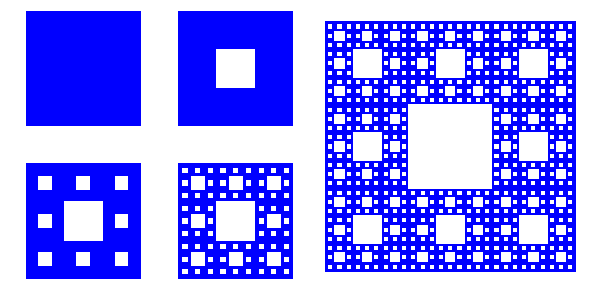 Like the triangle, the square has zero area. The fractal dimension of the Sierpinski carpet is log38, calculated similarly to the dimension of the triangle.
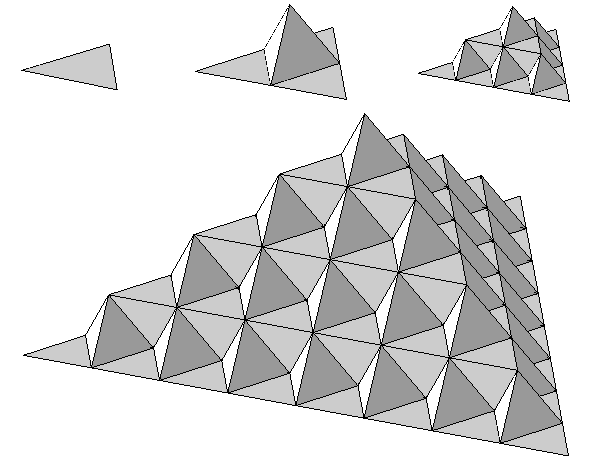
Sierpinski pyramid
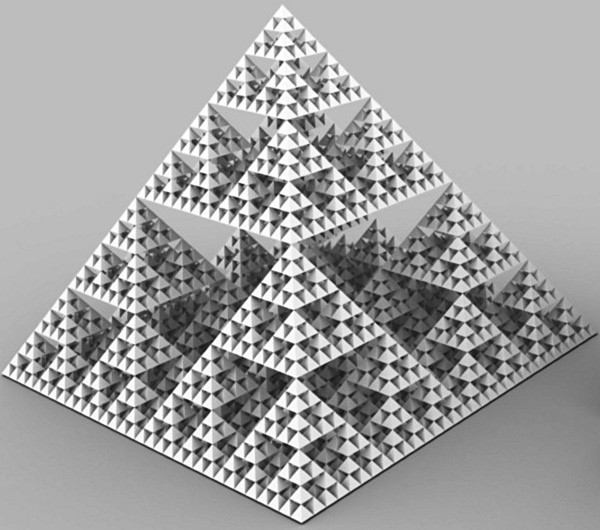 One of the three-dimensional analogues of the Sierpinski triangle. It is built similarly, taking into account the three-dimensional nature of what is happening: 5 copies of the initial pyramid, compressed by a factor of two, make up the first iteration, its 5 copies make up the second iteration, and so on. The fractal dimension is log25. The figure has zero volume (at each step half of the volume is discarded), but at the same time the surface area is preserved from iteration to iteration, and for the fractal it is the same as for the initial pyramid.
Menger sponge
A generalization of the Sierpinski carpet into three-dimensional space. To construct the sponge, an infinite repetition of the procedure is needed: each of the cubes of which the iteration consists is divided into 27 cubes three times smaller, from which the central one and its 6 neighbors are discarded. That is, each cube gives rise to 20 new ones, three times smaller. Therefore the fractal dimension is log320. This fractal is a universal curve: any curve in three-dimensional space is homeomorphic to some subset of the sponge. The sponge has zero volume (since at each step it is multiplied by 20/27), but at the same time an infinitely large surface area.
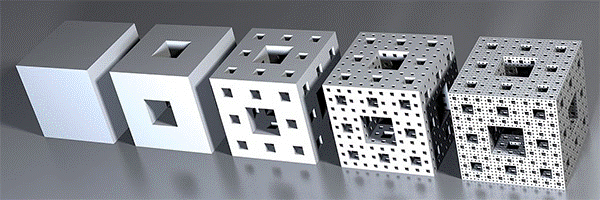 There are still a great many geometric fractals, and the surface area of this page, unfortunately, is not infinite. Therefore, let us move on to the next type of fractals - algebraic ones.
Dynamic (algebraic) fractals

Fractals of this type arise in the study of nonlinear dynamical systems (hence the name). The behavior of such a system can be described by a complex nonlinear function (polynomial) f(z).
Julia sets
Let us take some initial point z0 on the complex plane. Now consider an infinite sequence of numbers on the complex plane, each next one of which is obtained from the previous one: z0, z1 = f(z0), z2 = f(z1), ... zn+1 = f(zn). Depending on the initial point z0, such a sequence can behave differently: tend to infinity as n → ∞; converge to some finite point; cyclically take on a number of fixed values; more complex variants are also possible.
Thus, every point z of the complex plane has its own pattern of behavior under iterations of the function f(z), and the whole plane is divided into parts. At the same time, the points lying on the boundaries of these parts have the following property: with an arbitrarily small displacement, the nature of their behavior changes abruptly (such points are called bifurcation points). So, it turns out that the sets of points having one particular type of behavior, as well as the sets of bifurcation points, often have fractal properties. These are the Julia sets for the function f(z).
The Mandelbrot set
It is constructed somewhat differently. Consider the function fc(z) = z2 + c, where c is a complex number. Let us build the sequence of this function with z0 = 0; depending on the parameter c, it can diverge to infinity or remain bounded. At the same time, all values of c for which this sequence is bounded are precisely what form the Mandelbrot set. It was studied in detail by Mandelbrot himself and other mathematicians, who discovered quite a few interesting properties of this set.
It can be seen that the definitions of the Julia and Mandelbrot sets are similar to each other. In fact, these two sets are closely related. Namely, the Mandelbrot set is all values of the complex parameter c for which the Julia set fc(z) is connected (a set is called connected if it cannot be divided into two disjoint parts, subject to some additional conditions).
Halley fractal
Such fractals are obtained if Halley's formula for finding approximate values of the roots of a function is used as the rule for constructing a dynamic fractal. The formula is rather cumbersome, so anyone interested can look it up on Wikipedia. The idea of the method is almost the same as that used for drawing dynamic fractals: we take some initial value (as usual, here we are talking about complex values of variables and functions) and apply the formula to it many times, obtaining a sequence of numbers. Almost always it converges to one of the zeros of the function (that is, the value of the variable at which the function takes the value 0). Halley's method, despite the cumbersomeness of the formula, works more efficiently than Newton's method: the sequence converges to the zero of the function faster.
Newton fractal
Another type of dynamic fractals consists of Newton fractals (the so-called basins of Newton). The formulas for constructing them are based on the method for solving nonlinear equations that was invented by the great mathematician back in the 17th century. Applying the general formula of Newton's method zn+1 = zn - f(zn)/f'(zn), n = 0, 1, 2, ... to solve the equation f(z) = 0 for the polynomial zk - a, we obtain a sequence of points: zn+1 = ((k - 1)znk - a)/kznk-1, n = 0, 1, 2, ... . Choosing various complex numbers z0 as initial approximations, we will obtain sequences that converge to the roots of this polynomial. Since it has exactly k roots, the whole plane is divided into k parts - areas of attraction of the roots. The boundaries of these parts have a fractal structure (let us note in parentheses that if in the last formula we substitute k = 2, and take z0 = a as the initial approximation, we will get the formula that is actually used for computing the square root of a in computers). Our fractal is obtained from the polynomial f(z) = z3 - 1.
Applications of fractals in industry and everyday life

Scientists are very enthusiastic people. Do not feed them bread, just let them fantasize about abstract topics. But you and I are practical people, and after reading everything that is written above, many have probably already had a reasonable question: "so what?" So, what exactly has this knowledge brought into the world?
First, fractals are used in computer systems, and very extensively. The most useful application of fractals in computer science is fractal data compression. This type of compression is based on the fact that the real world is well described by fractal geometry. At the same time, images are compressed much better than is done by conventional methods (such as jpeg or gif). Another advantage of fractal compression is that when the image is enlarged, there is no pixelation effect (the enlargement of dots to sizes that distort the image). With fractal compression, after enlargement, the image often looks even better than before it.
Second, this is fluid mechanics and, as a consequence, the oil industry. The fact is that the study of turbulence in flows adapts very well to fractals. Turbulent flows are chaotic and therefore difficult to model accurately. And here the transition to their fractal representation helps, which greatly facilitates the work of engineers and physicists, allowing them to better understand the dynamics of complex flows. With the help of fractals, flame tongues can also be modeled. Porous materials are well represented in fractal form due to the fact that they have very complex geometry. This is used in petroleum science.
Third, when you come home from the factory in the evening, lie down on your favorite battle couch, you turn on the television, which is also related to fractals. The fact is that for transmitting data over distances, antennas with fractal shapes are used, which greatly reduces their size and weight.
The use of fractal geometry in the design of antenna devices was first applied by the American engineer Nathan Cohen, who at that time lived in downtown Boston, where the installation of external antennas on buildings was prohibited. Cohen cut a shape in the form of a Koch curve out of aluminum foil and then pasted it onto a sheet of paper, then connected it to a receiver. It turned out that such an antenna worked no worse than an ordinary one. And although the physical principles of such an antenna have still not been studied to this day, this did not prevent Cohen from founding his own company and setting up their serial production. At the moment, the American company Fractal Antenna System has developed a new type of antenna. Now it is possible to abandon the use of protruding external antennas in mobile phones - the so-called fractal antenna is located directly on the main board inside the device.
In addition, fractals are used to describe the curvature of surfaces. An uneven surface is characterized by a combination of two different fractals. They are also used in the development of biosensory interactions, the study of heartbeats, the modeling of chaotic processes, in particular in the description of animal population models, and so on.
Fractal structure of the market

All this ode to fractals would be in vain if not for the fractal nature of financial markets. Yes, at last we have come to discuss that very question for the sake of which I wrote this article.
So, at present many methods of analyzing financial markets are used, on the basis of which traders create their trading strategies. Among the various tools of analysis and forecasting, fractal analysis stands somewhat apart. This is a separate, versatile, and interesting theory for discussion and study. The first impression suggests the simplicity of the topic, however, dig deeper and many hidden nuances will become visible.
Understanding fractals is the key to seeing hidden information about the market. And it is precisely this that is one of the key factors of a speculator's market success and the guarantee of large, stable profit.
On October 14, 2010, Benoit Mandelbrot passed away - a man who in many ways changed our understanding of the objects around us and enriched our language with the word "fractal."
 As you already know, it is precisely thanks to Mandelbrot that we know fractals surround us everywhere. Some of them change continuously, like moving clouds or flames, while others, like coastlines, trees, or our vascular systems, preserve the structure acquired in the course of evolution. At the same time, the real range of scales where fractals are observed extends from distances between molecules in polymers to the distance between clusters of galaxies in the Universe. The richest collection of such objects is gathered in Mandelbrot's famous book "The Fractal Geometry of Nature."
The most important class of natural fractals is chaotic time series, or observations of the characteristics of various natural, social, and technological processes ordered in time. Among them are both traditional ones (geophysical, economic, medical) and those that became known relatively recently (daily fluctuations in the level of crime or traffic accidents in a region, changes in the number of views of certain sites on the internet, etc.). These series are usually generated by complex nonlinear systems of very different natures. However, in all of them the pattern of behavior repeats at different scales. Their most popular representatives are financial time series (primarily stock prices and exchange rates).
The self-similar structure of such series has been known for a very long time. In one of his articles, Mandelbrot wrote that his interest in stock market quotes began with a statement by one of the exchange traders: "...The price movements of most financial instruments look similar at different scales of time and price. From the appearance of the chart, an observer cannot tell whether the data relate to weekly, daily, or hourly changes."
Mandelbrot, who occupies a completely special place in financial science, had the reputation of an "overthrower of foundations," provoking a clearly mixed attitude toward himself among economists. From the moment modern financial theory emerged, based on the concept of general equilibrium, he was one of its main critics and until the end of his life tried to find an acceptable alternative to it. However, it was Mandelbrot who developed a system of concepts which, with appropriate modification, as it turned out, makes it possible not only to build an effective forecast, but also to offer what is apparently the only empirical justification at the moment for classical financial theory.

The main characteristic of fractal structures is the fractal dimension D, introduced by Felix Hausdorff in 1919. For time series, the Hurst index H is more often used, which is related to the fractal dimension by the relation D = 2 - H and is an indicator of the persistence (the ability to maintain a certain tendency) of a time series.
Usually, three fundamentally different regimes that can exist in the market are distinguished: at H = 0,5, price behavior is described by the random walk model; at H > 0,5, prices are in a state of trend (directed movement upward or downward); at H < 0,5, prices are in a state of flat, or frequent fluctuations in a fairly narrow price range. However, to reliably calculate H (just like D), too much data is required, which excludes the possibility of using these characteristics as indicators that determine the local dynamics of a time series.
As is known, the basic model of financial time series is the random walk model, first obtained by Louis Bachelier to describe observations of stock prices on the Paris Stock Exchange. As a result of rethinking this model, which is sometimes observed in price behavior, the concept of an efficient market arose, in which the price fully reflects all available information.
For such a market to exist, it is sufficient to assume that it contains a large number of fully informed rational agents who instantly react to incoming information and adjust prices, bringing them to a state of equilibrium. All the main results of classical financial theory (portfolio theory, the CAPM model, the Black-Scholes model, and others) were obtained within precisely such an approach. At present, the efficient market concept continues to play a dominant role both in financial theory and in the financial business.
Nevertheless, by the beginning of the 60s of the last century, empirical studies showed that strong price changes in the market occur much more often than the main model of the efficient market (the random walk model) predicted. One of the first to subject the efficient market concept to comprehensive criticism was Mandelbrot.
Indeed, if one correctly calculates the value of the H indicator for some stock, then it will most likely differ from H = 0,5, which corresponds to the random walk model. Mandelbrot found all possible generalizations of this model that may have relevance to real price behavior. As it turned out, these are, on the one hand, processes he called Levy flight, and on the other hand, processes he called generalized Brownian motion.
To describe price behavior, the fractal market concept is usually used, which is conventionally regarded as an alternative to the efficient market. The concept assumes that there is a broad spectrum of agents in the market with different investment horizons and, consequently, different preferences. These horizons range from several minutes for intraday traders to several years for large banks and investment funds.
A stable state in such a market is a regime in which "the average return does not depend on scale, except for multiplication by the corresponding scale coefficient." In fact, we are talking about a whole class of regimes, each of which is determined by its own value of the H indicator. At the same time, the value H = 0,5 turns out to be one of many possible ones and, consequently, equal in status to any other value. These and other related considerations became grounds for serious doubts regarding the existence of true equilibrium in the stock market.
Look at the price charts below:
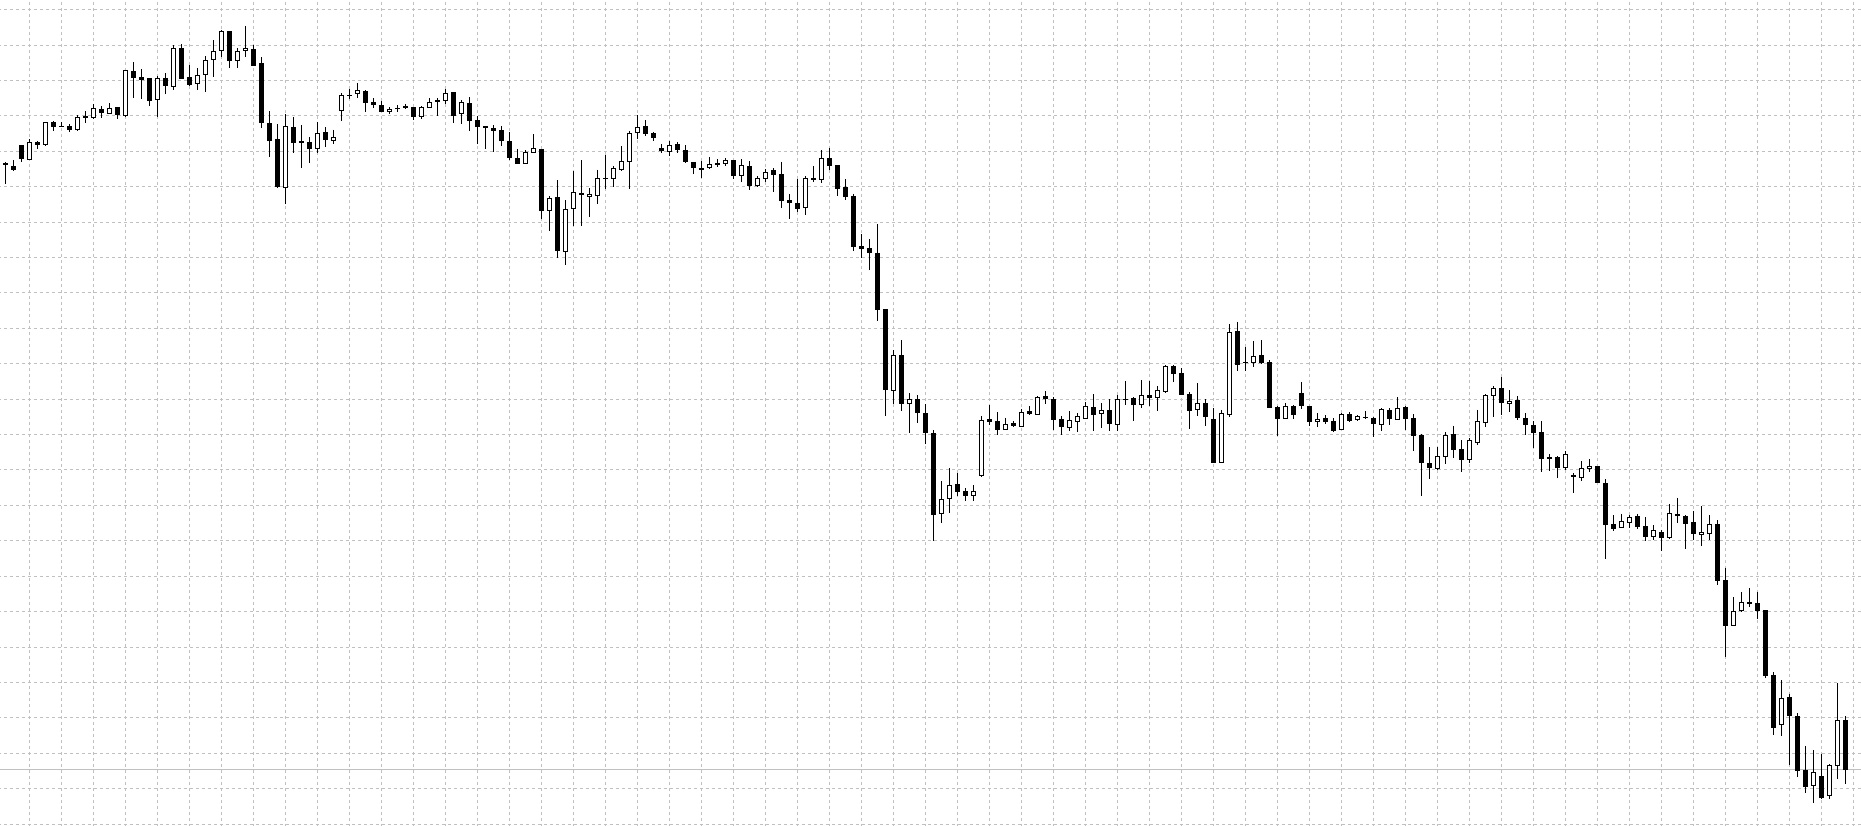
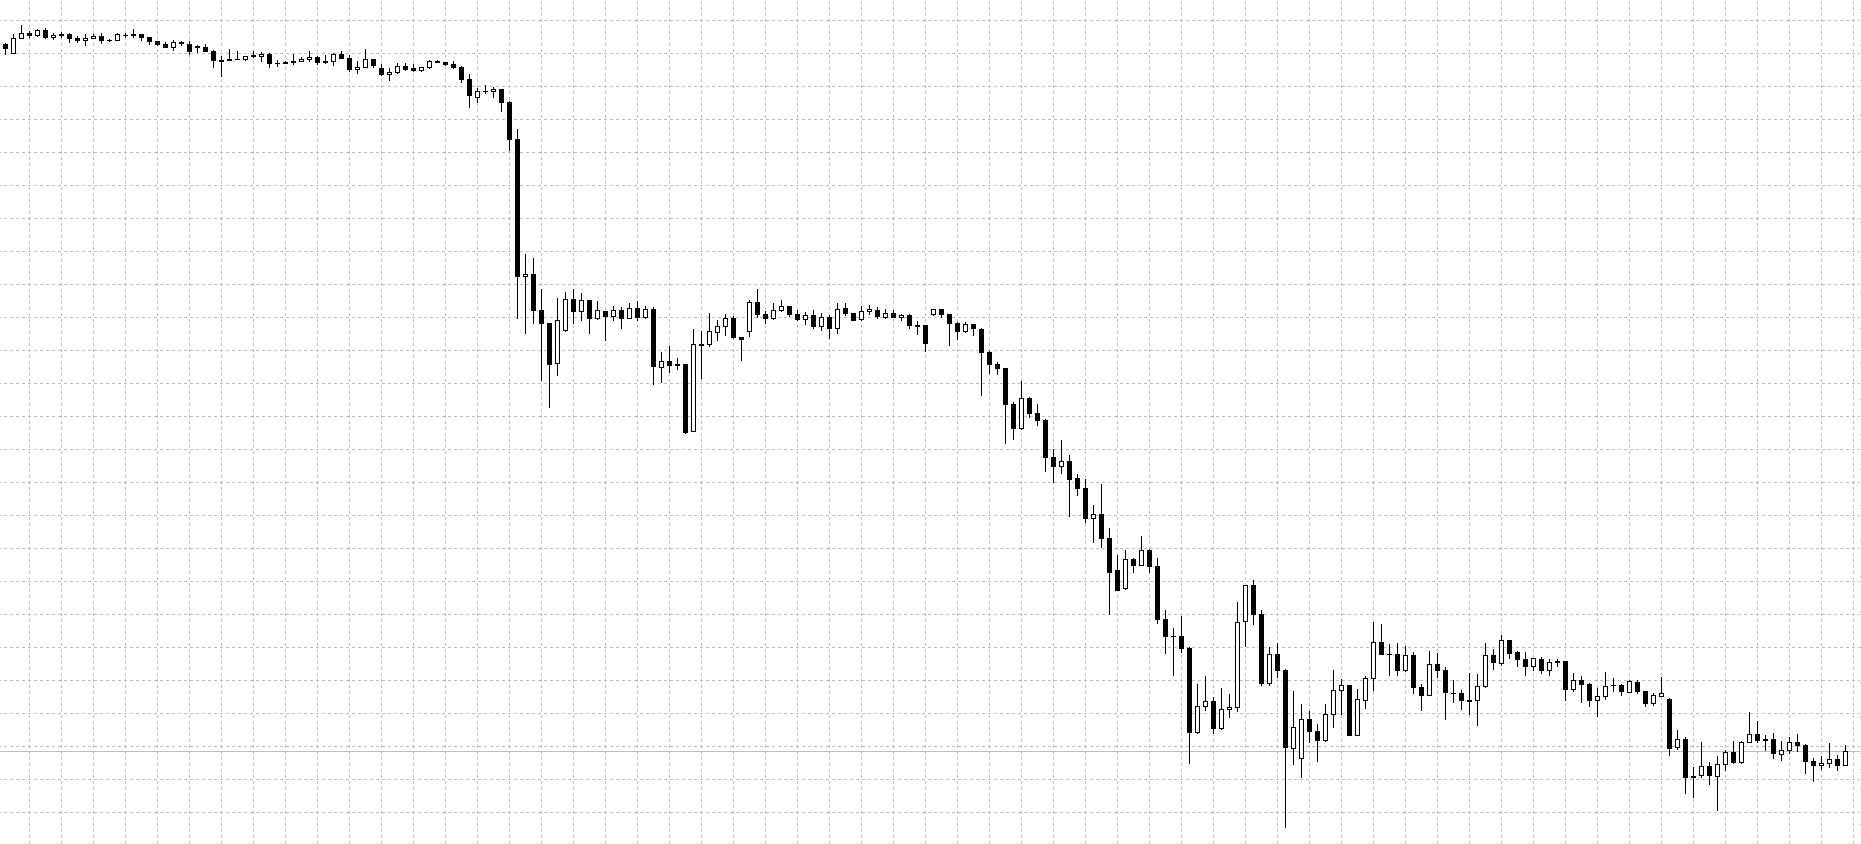
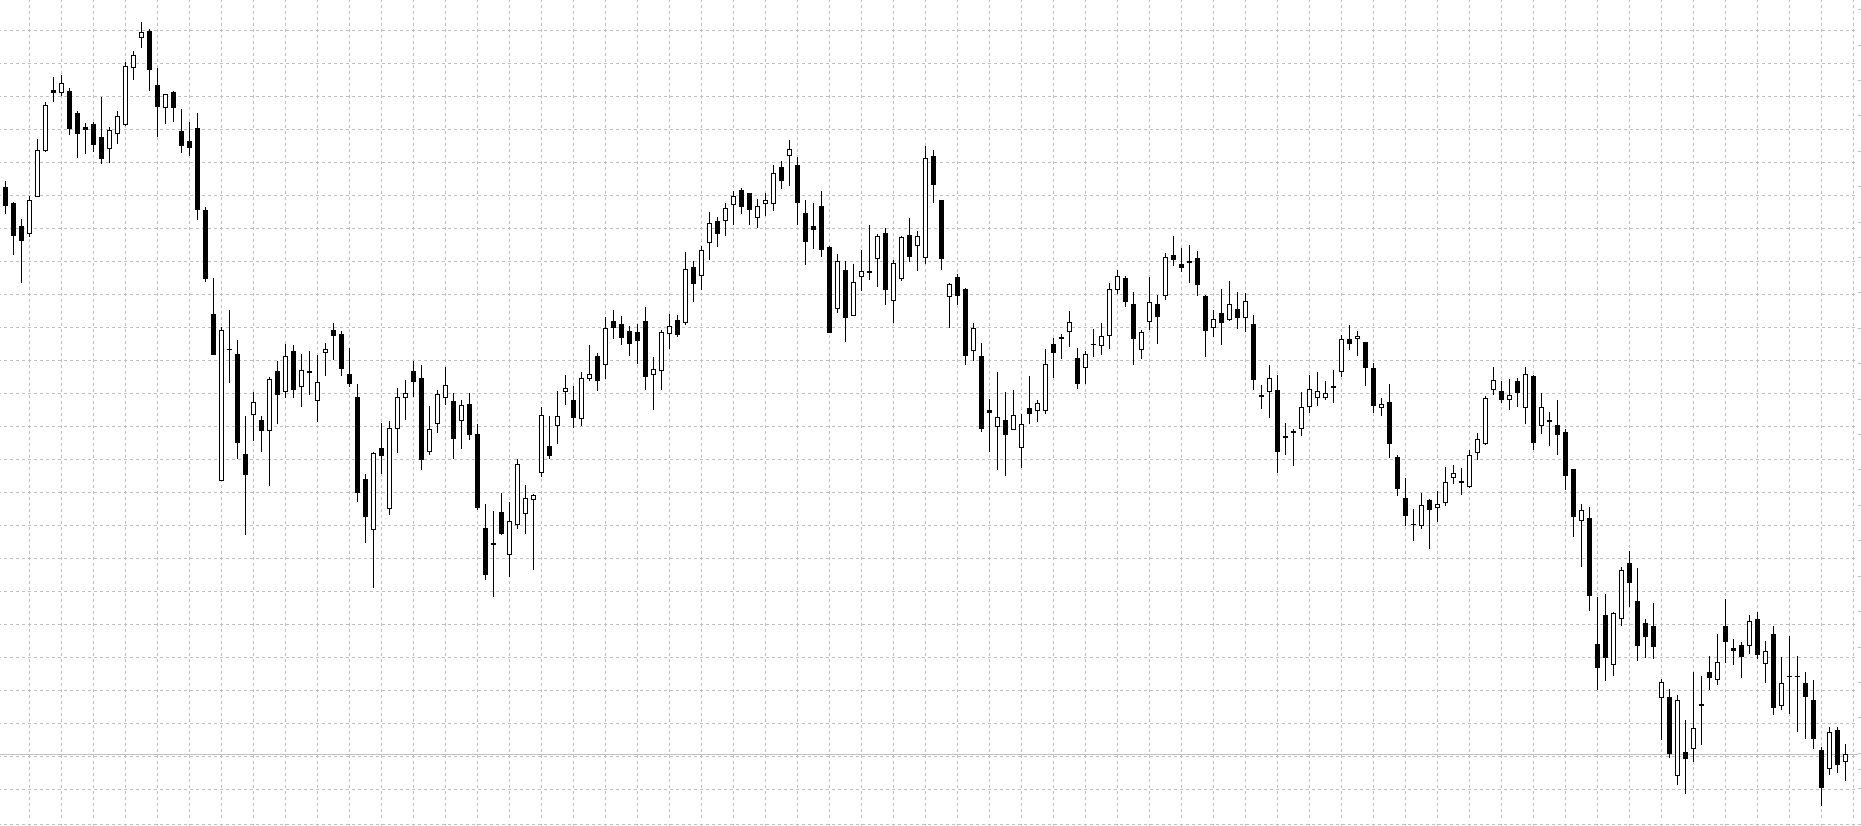
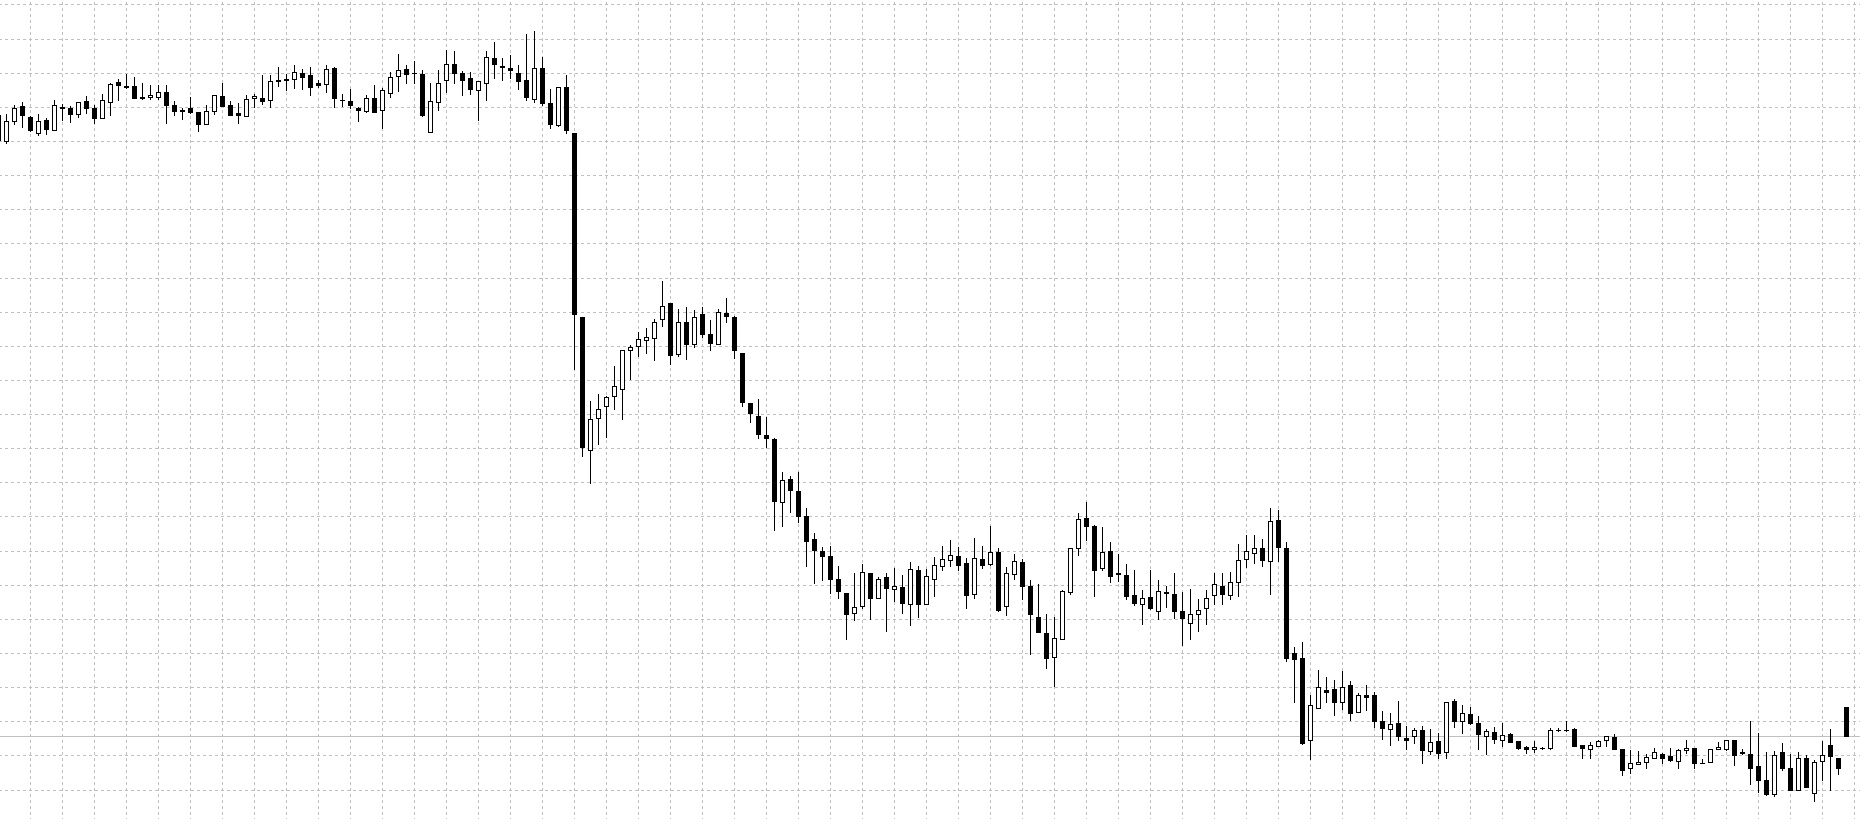
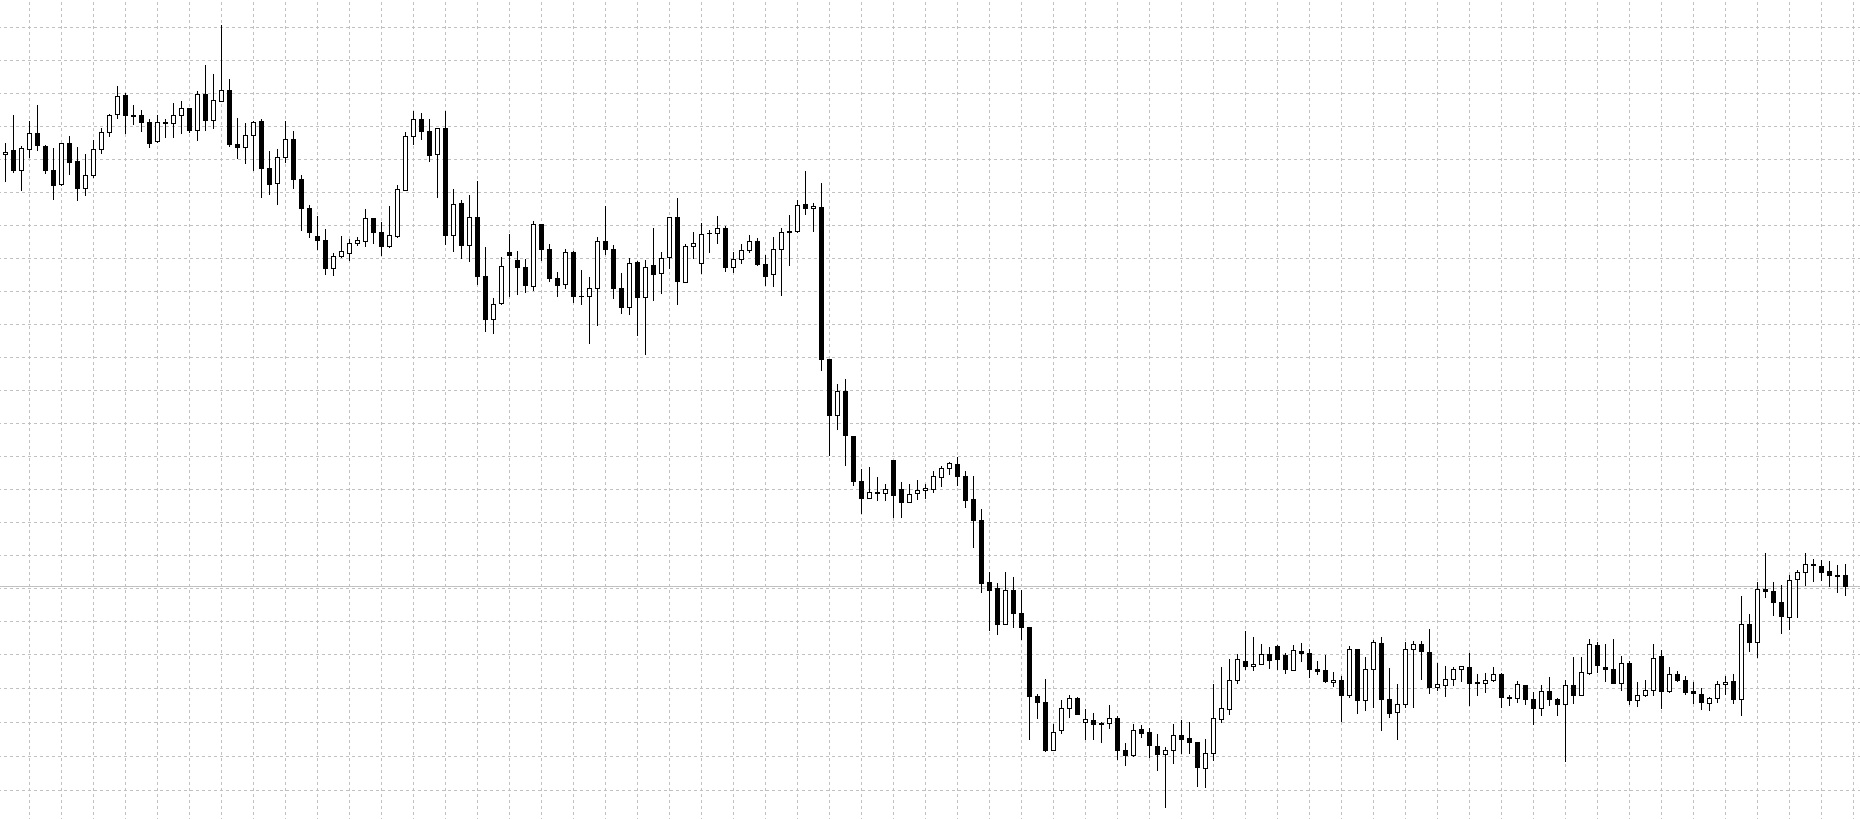
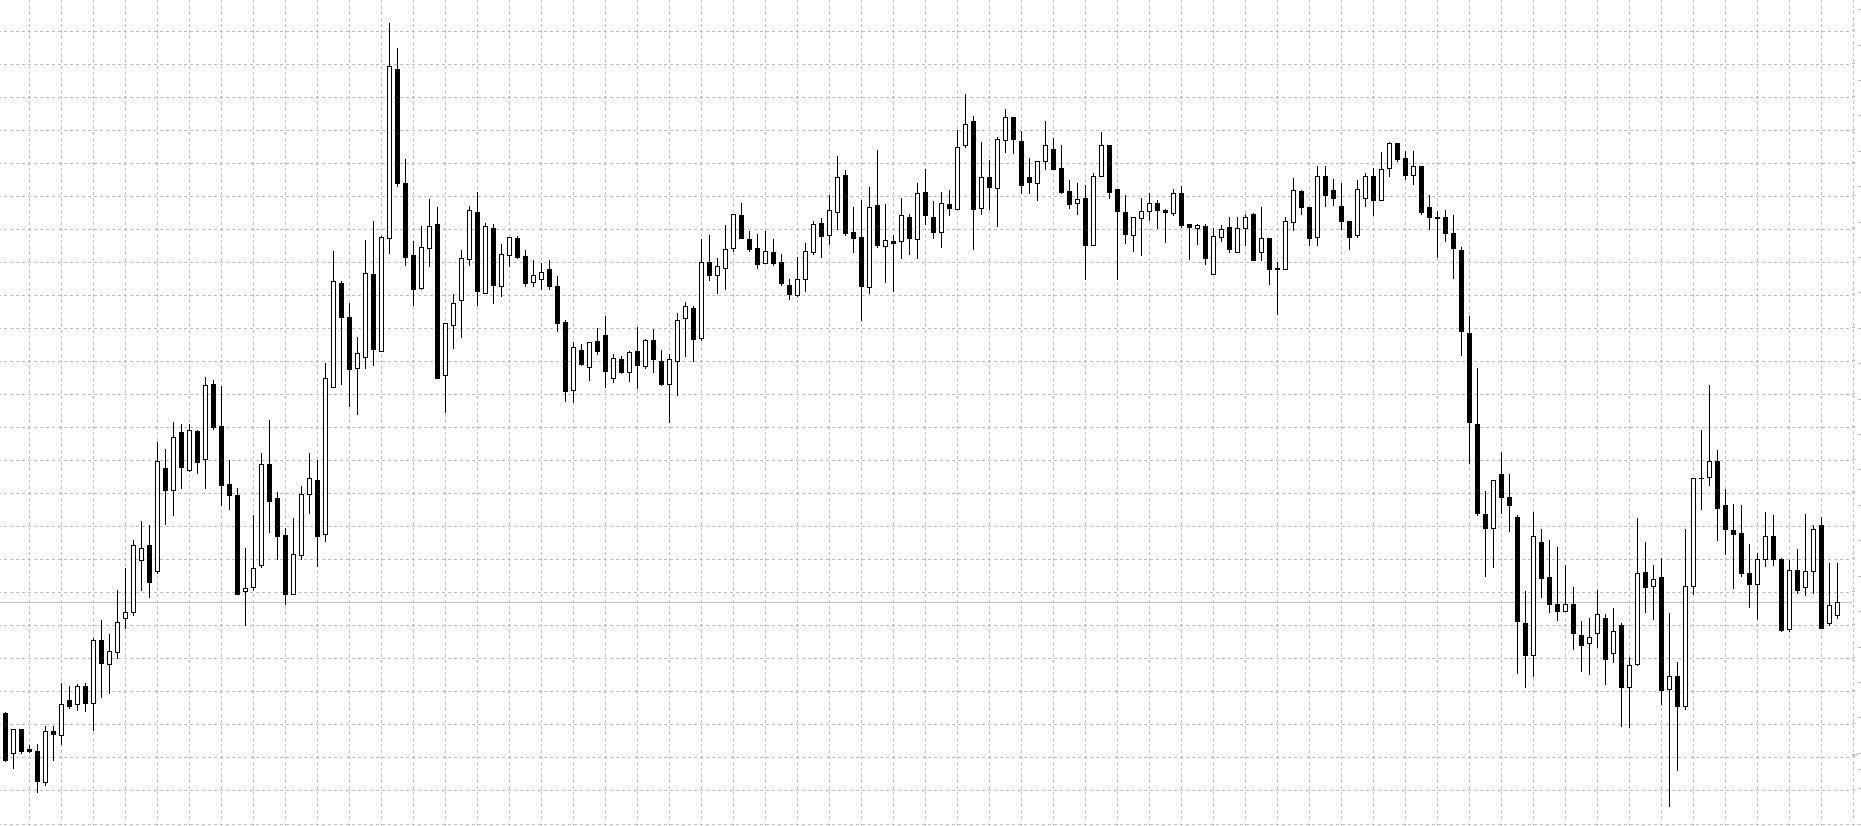 It can be seen that price makes constant fluctuations, forming a structure of a repeating nature. It is visible in all markets, regardless of the time scale.
The image shows the charts: BRN M30, BTCUSD H1, DAX30 D1, EURSGD M5, USDCHF H1, XAUUSD M15. Without labels and explanations, hardly anyone would be able to distinguish them from one another.
These charts are not exactly alike, but they have some common patterns. Over a given period of time, price moves in one direction, then changes its direction to the opposite one and partially restores the previous movement, then reverses again. It does not matter which timeframe is used for the charts - they all look approximately the same (constant fluctuations), just like fractals.
Fluctuations form market waves. What is a wave? It is an impulse and a correction to it (movement-reversal-movement in the opposite direction, partially restoring the previous one). Such movements form waves.
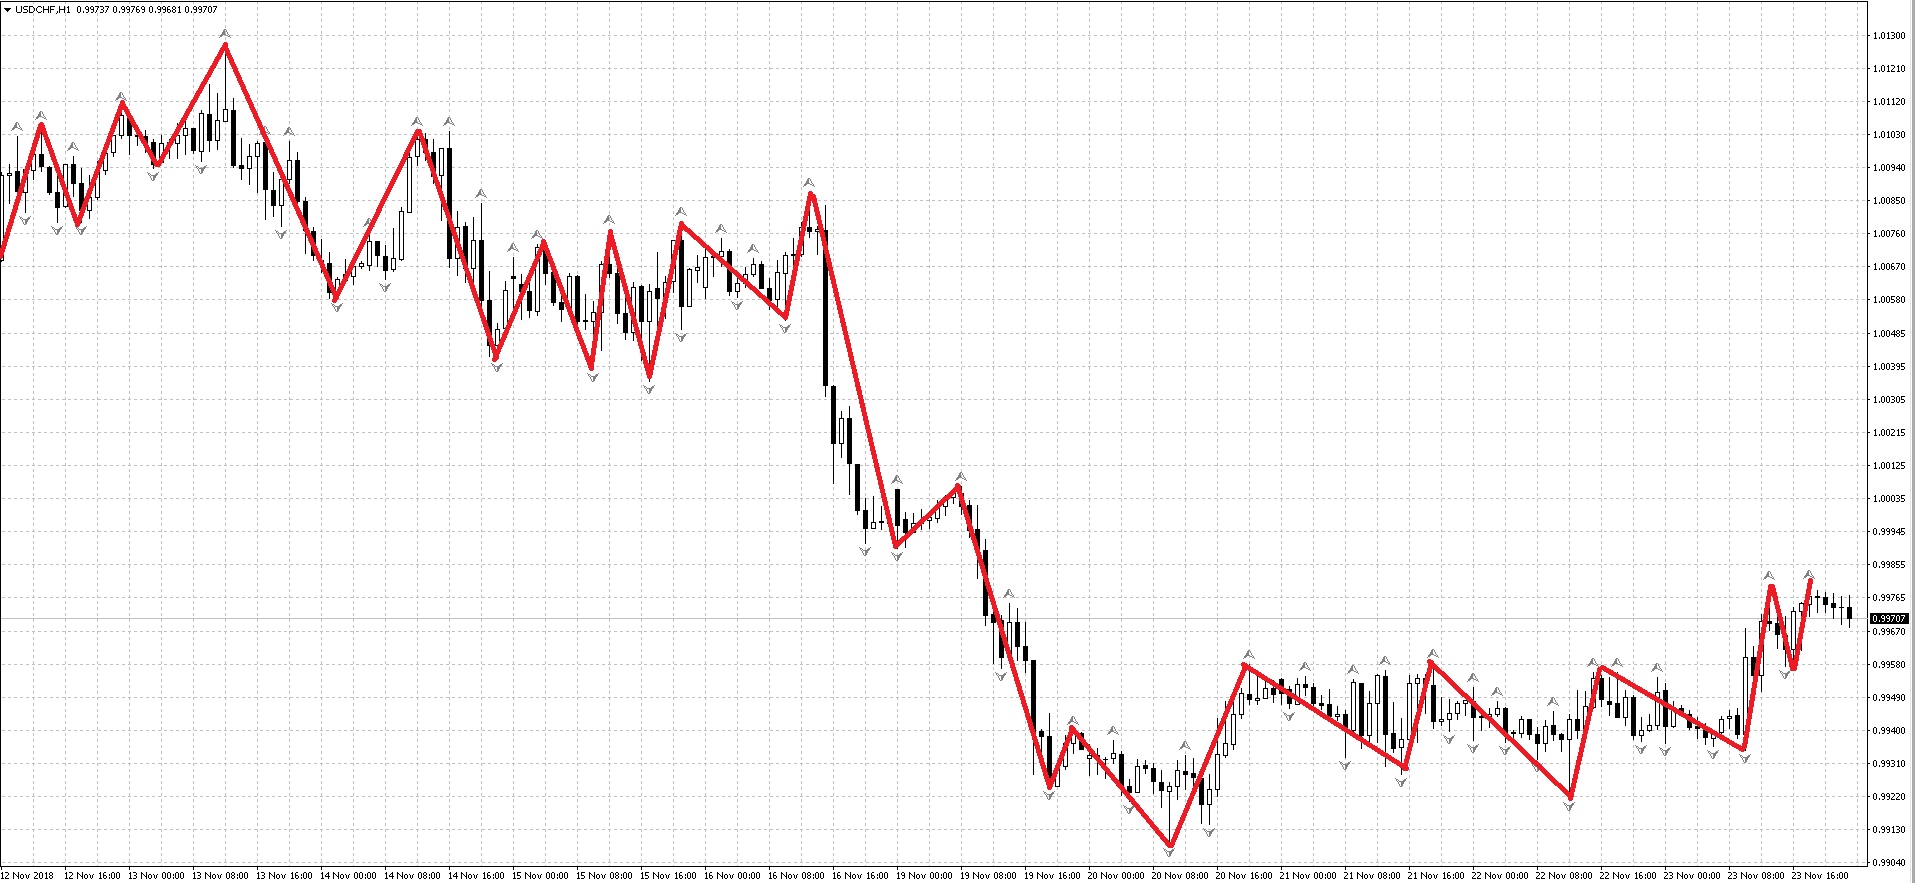 The image shows these movements that form waves. Several such waves form a larger wave of a similar shape (impulse-correction). Several small waves form one medium-sized wave.
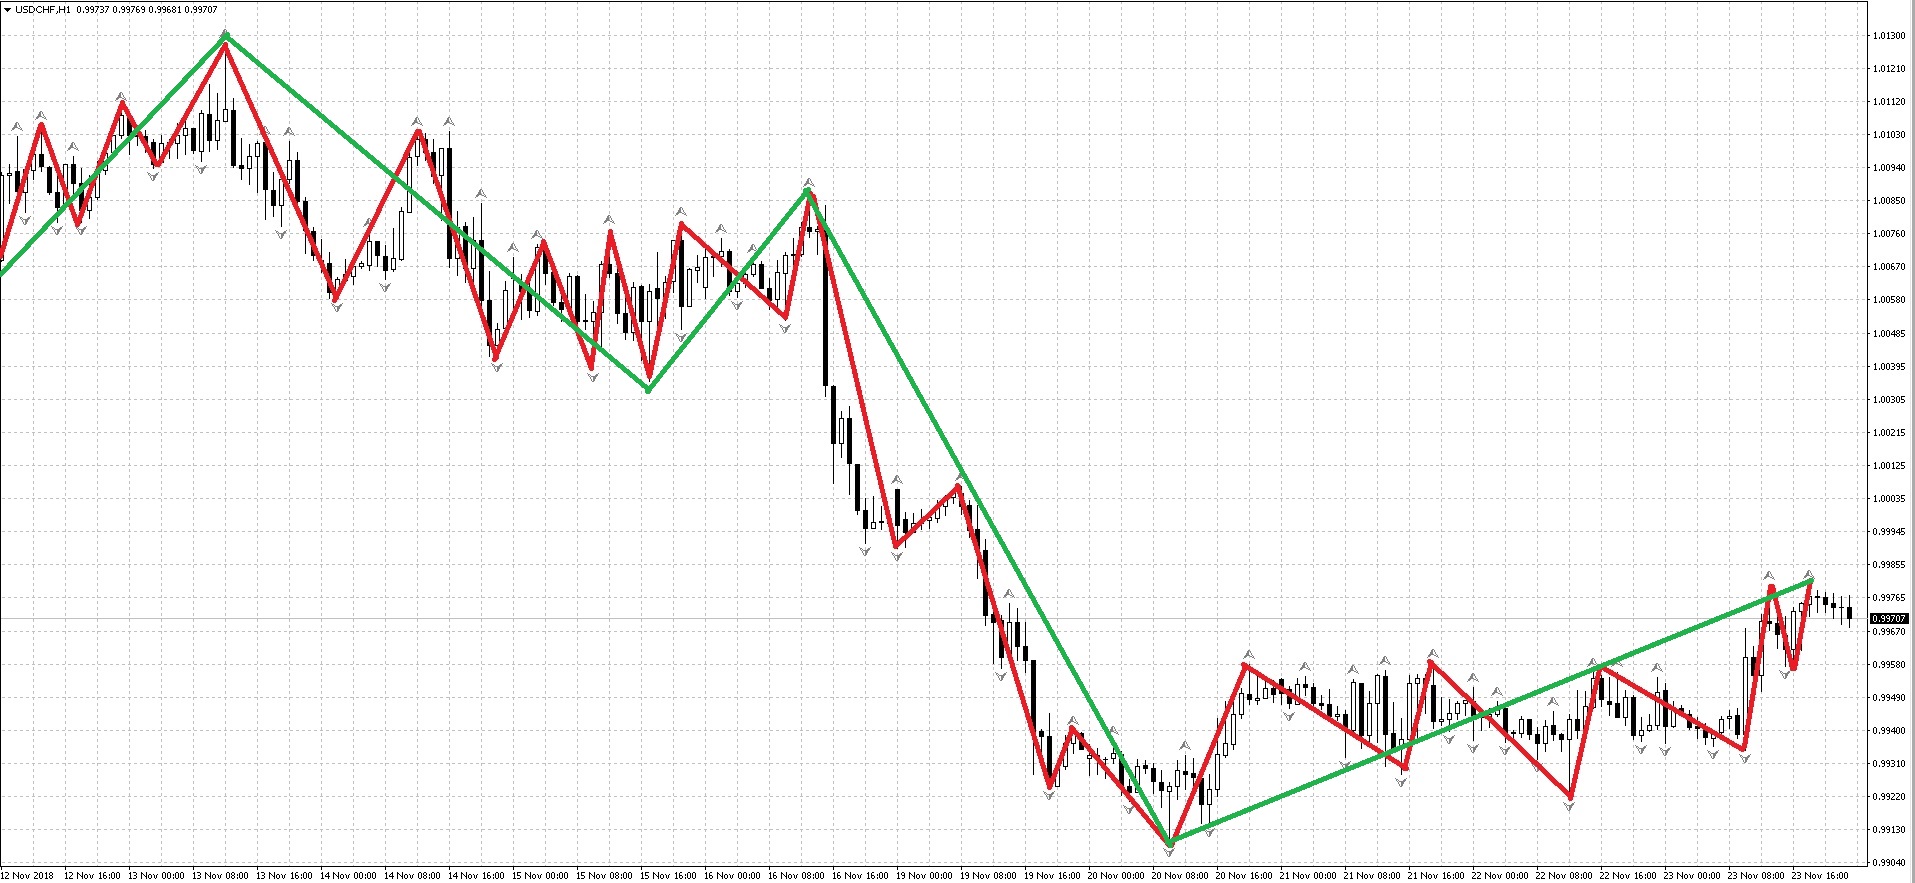 Medium-sized waves form one large wave. This is the essence of fractal theory in the financial markets.
Series of such waves form directed movements in the market - trends. Such trends, in turn, form directed movements of a higher time order. As with waves, smaller movements form one medium movement, and so on. This is how short-term, medium-term, and long-term trends are distinguished. This is the classical understanding of the fractal nature of the market.
Bill Williams Fractals

As I have already said, market fractals are one of the indicators in Bill Williams' trading system. It is believed that he was the first to introduce this name into trading, but, as you understand, this is not so. When trading fractals, in combination with his Alligator indicator, the author identified local highs or lows of the market. He also wrote that identifying the fractal structure of the market makes it possible to find a way to understand price behavior.
 In general, Williams' fractal theory once sparked heated debate, primarily because the author, as many believe, inserted a lot of scientific terminology into his theory (fractal, attractor, and so on) and did so not entirely correctly.
In general, Williams' fractals appear on the market quite often and on almost all timeframes and are, in essence, simple local extremes over a segment of 5 bars, and they hardly correspond to the mathematical theory of fractals. Thomas Demark's second-order TD points are exactly the same kind of formation on the chart. However, despite all these coincidences, this theory is still quite popular.
Williams' technical analysis considers 4 existing fractal formations:
- true buy fractal;
- false buy fractal;
- true sell fractal;
- false sell fractal.
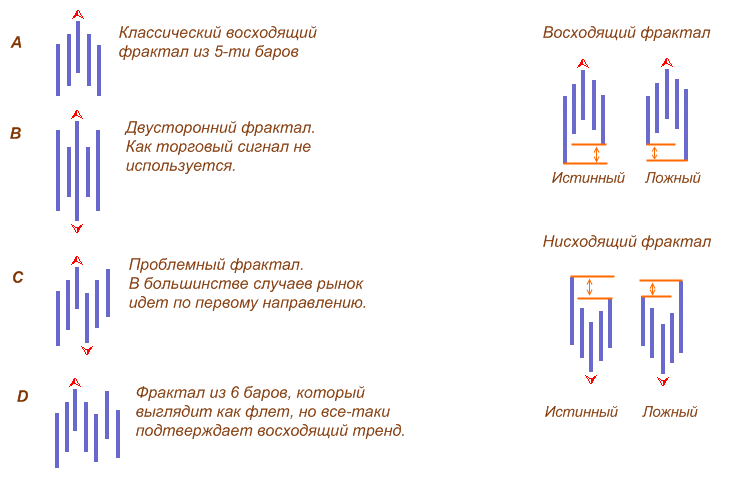 We will talk more about true and false fractals and how to distinguish them below.
The Fractals Indicator in the MetaTrader Trading Terminal

Bill Williams' indicators do not require installation and are included in the standard set of indicators available to the trader out of the box. In order to attach the fractal indicator to a chart in the MetaTrader 4 terminal, you need to select the menu item in the main menu (or in the "Navigator" window): "Insert" — "Indicators" — "Bill Williams" — "Fractals":
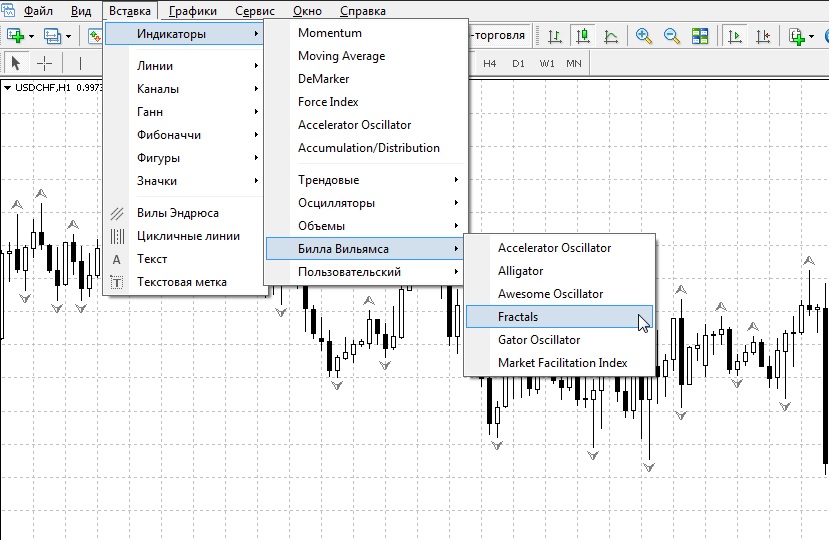 The standard indicator for MT4 has no settings other than color ones. Using it with a fixed period of "5" nullifies all the capabilities and advantages of this tool. But for the MetaTrader platform there are many custom indicators that will help solve this problem.
Our forum member Pavel888 has compiled a large collection of various Fractals indicators in a forum thread, many thanks to him for that.
The Problem of False and True Fractals

When trading using fractals, there is one important nuance: the appearance of a large number of signals on the chart, some of which are false. To filter them, Bill Williams developed another indicator called the "Alligator," which can also be found in the standard set of indicators in MT4.
The problem of false fractals is the main source of errors, similar to assessing the validity of a breakout of support/resistance. Regardless of the specific methodology, the general principle for determining reliability is as follows: any deviations from the classical appearance should raise doubts. As in all technical analysis, reducing the timeframe leads to an increase in false signals and chart clutter. Examples of unstable fractals are shown in the figure below.
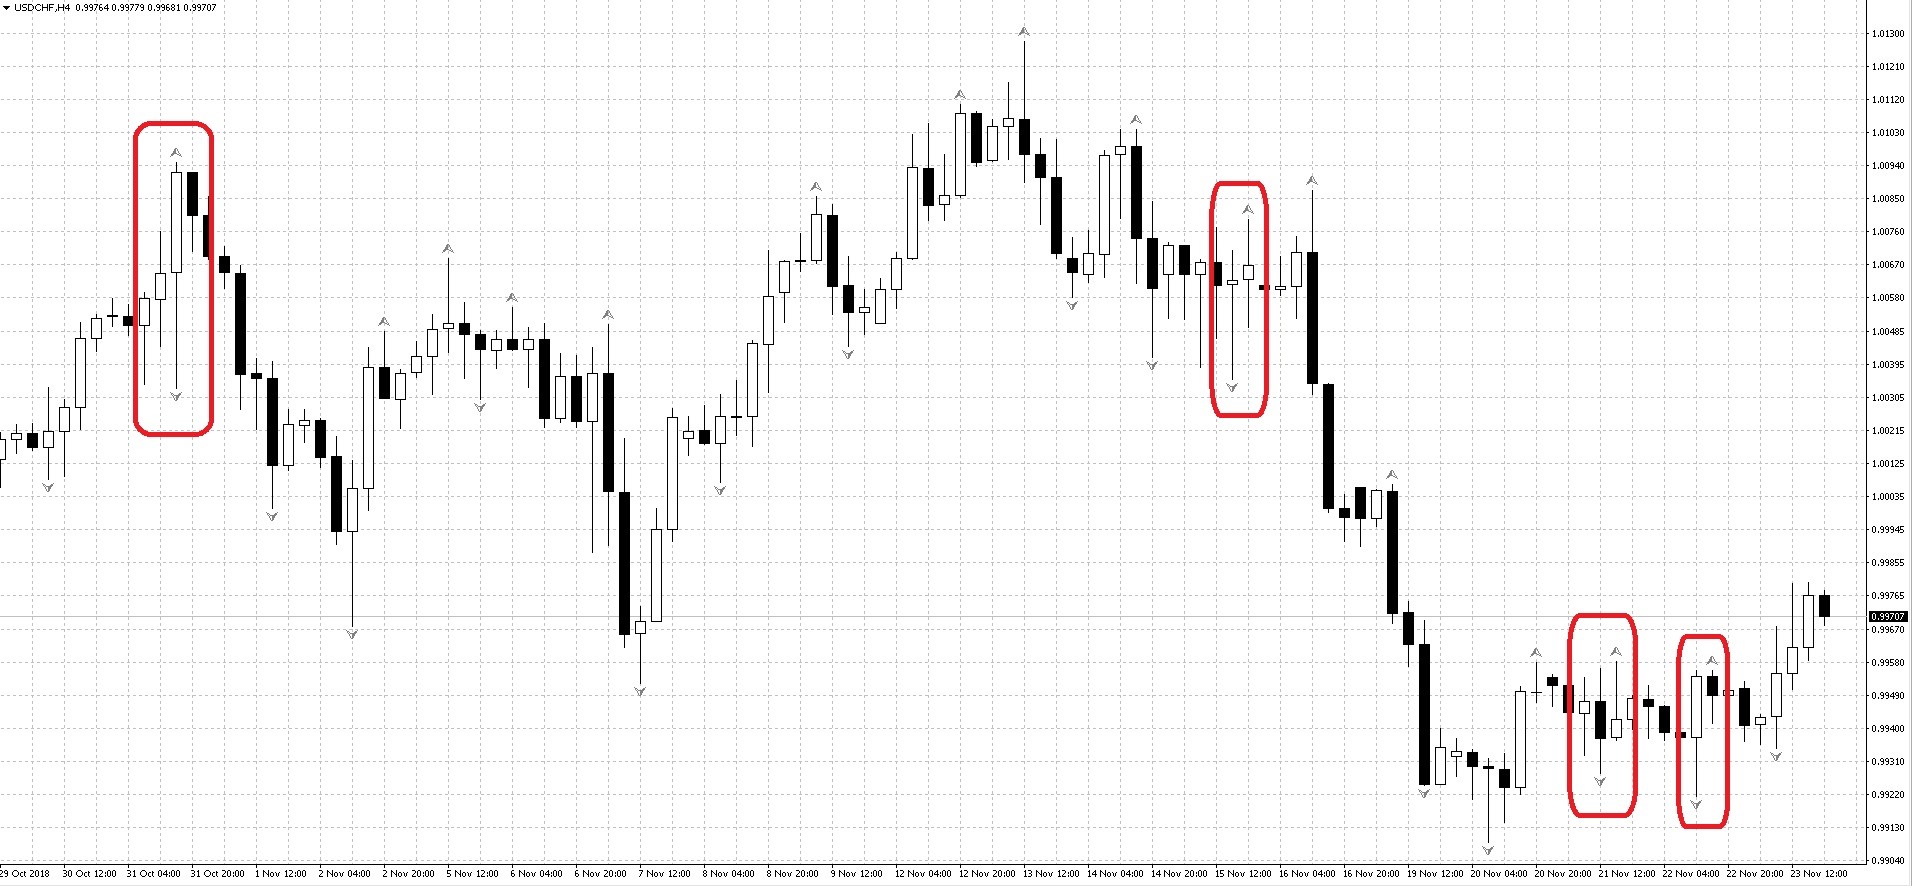 When trading large patterns, it is better to open positions at moments of correction of the latest price impulse, which are located on the left side of the formation. Within the pattern, standard Fibonacci retracements at 38% (0,382), 50% (0,500), and 62% (0,618) work reliably. If you "stretch" the levels through neighboring signals of the indicator, then you can enter via limit orders near key levels.
In the same way, you can protect a trade from an unpredictable reverse breakout by gradually moving the stoploss to monitor the opposite high or low of the latest and penultimate candle. When the structure is just forming, the stop should be at least 5-10 points above or below the last signal given by the Fractals indicator. Then, during minor pullbacks, we stay in the market, and if there is a complete trend reversal, the trade will close with a minimal loss.
There is another way to determine that we are dealing with false fractals: when they are broken by a bar with a long wick and a small body (a pin bar). The longer its "nose," the stronger the reversal signal, meaning that the market failed to cross the level of the last pattern on the first attempt. If the breakout occurred and the next candle closed above the High of the nose (for a sell) or below the Low (for a buy), then with high probability the signal can be skipped and the next one awaited. A similar situation may occur even after 3-5 bars, but we pay attention only to the bar that broke the Fractals indicator.
Practical Use of Fractals

Bill Williams advised using fractals in strategies based on the breakout of important price levels. According to the author of this indicator, price movement above or below the level of the previous fractal by at least one point already indicates that the price has broken this level.
A break of the level of the previous fractal is called a buyers' breakout if the price rises above the previous upward-directed fractal. In the opposite case, when the price falls below the previous downward-directed fractal, it is called a sellers' breakout. Bill Williams advised treating a buyers' or sellers' breakout as a signal to open a position.
Usually, traders place pending Stop orders a few points above or below the fractal to open a position if this level is broken. In such cases, the stop loss is usually placed at the level of the penultimate opposite fractal.
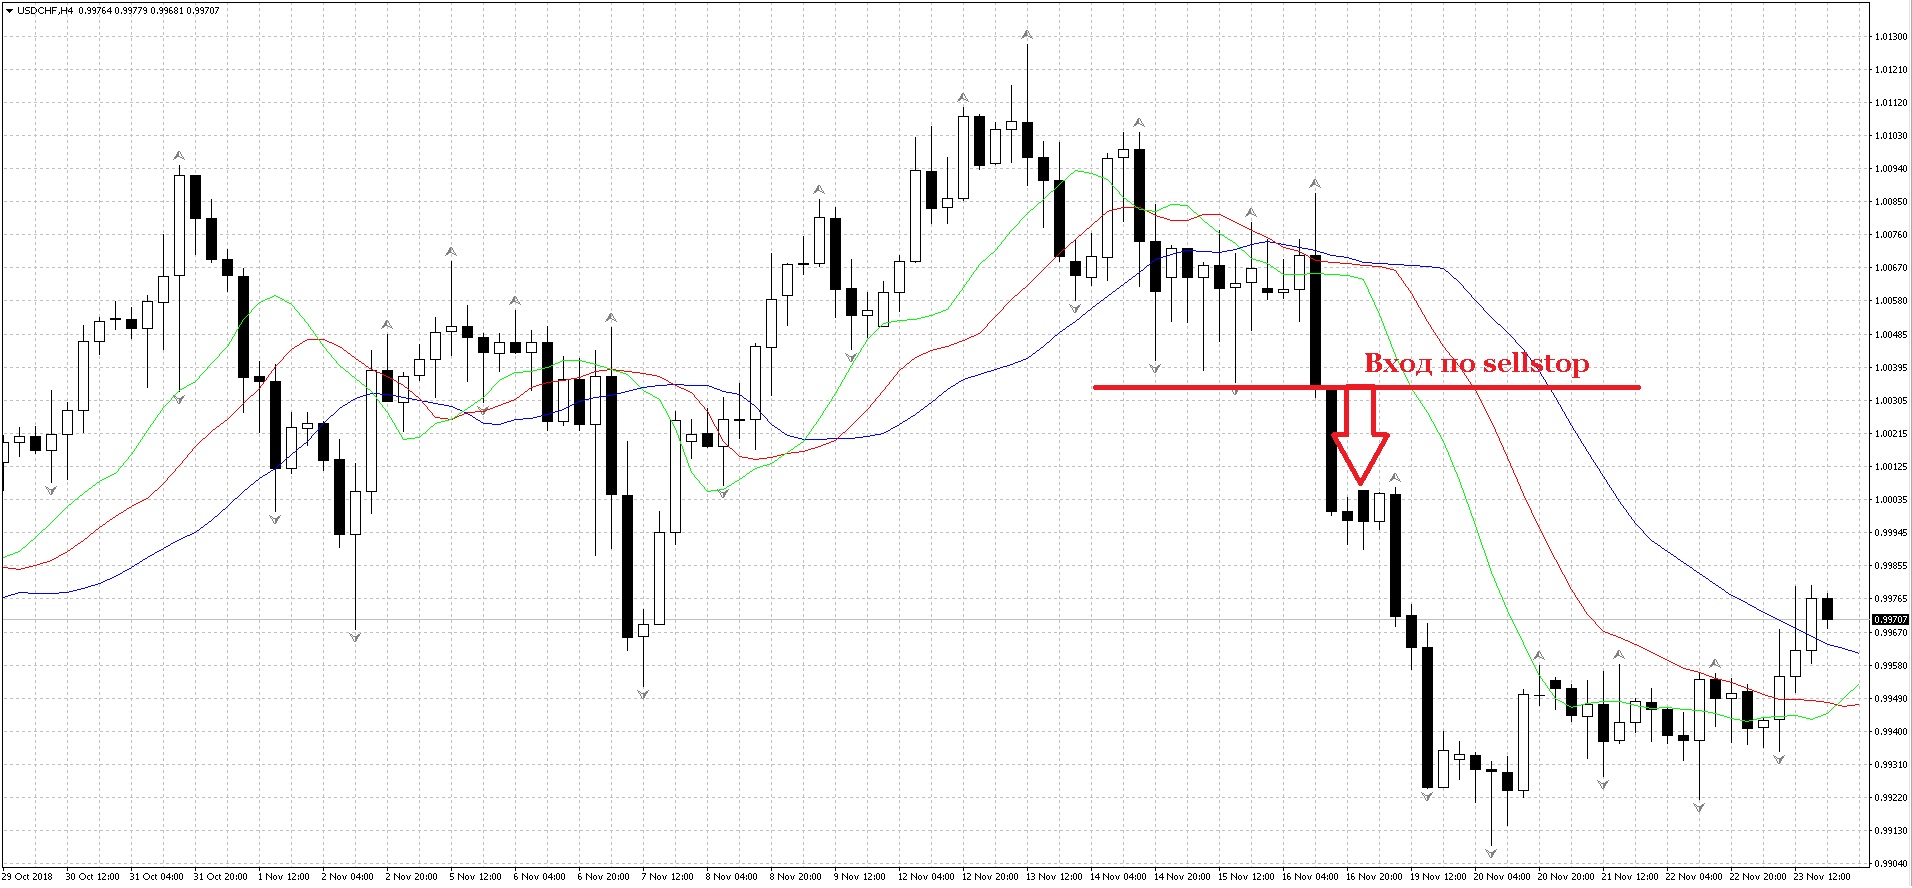
In the classical interpretation, Bill Williams advises filtering the trading signals given by fractals using the "Alligator" indicator. Thus, to open a buy position, it is necessary for a fractal located above the red line (the so-called "Alligator Teeth") to be broken. The author of the strategy advised entering the market immediately after the upward fractal breakout or by using a pending BuyStop order. Entry into a sell trade occurs when a fractal located below the red line is broken.
 You can read more about this strategy in the article about Bill Williams' Profitunity system. And we will examine the main practical ways of using fractals separately from this trading system.
Trading a Fractal Breakout

This method is the classic one proposed by Bill Williams. As is clear from the name, trading has a breakout nature and is designed to continue the current trend. Entry into the trade is carried out by a pending stop order on the breakout of the fractal closest to the price. You can see an example in the figure above.
As the author himself writes, this trading method will produce many false entries, so Bill suggests filtering signals with the Alligator indicator. In principle, the Alligator indicator can be replaced with ordinary moving averages and also used as a filter. But I will repeat that considering fractals and the Alligator apart from Williams's other tools makes no sense, so we will not dwell on this and will move on.
Fractals as Support/Resistance Levels

If you have encountered support/resistance levels at least once, then you know how difficult they are to build, especially if you are a beginner. And all this difficulty arises because of the subjectivity of this tool. When we build levels, we cannot say with confidence whether we built them correctly or not. Bill Williams, with his fractals, gives us a wonderful tool for finding and building significant support and resistance levels.
Let us put the indicator on some chart and analyze it from the point of view of levels.
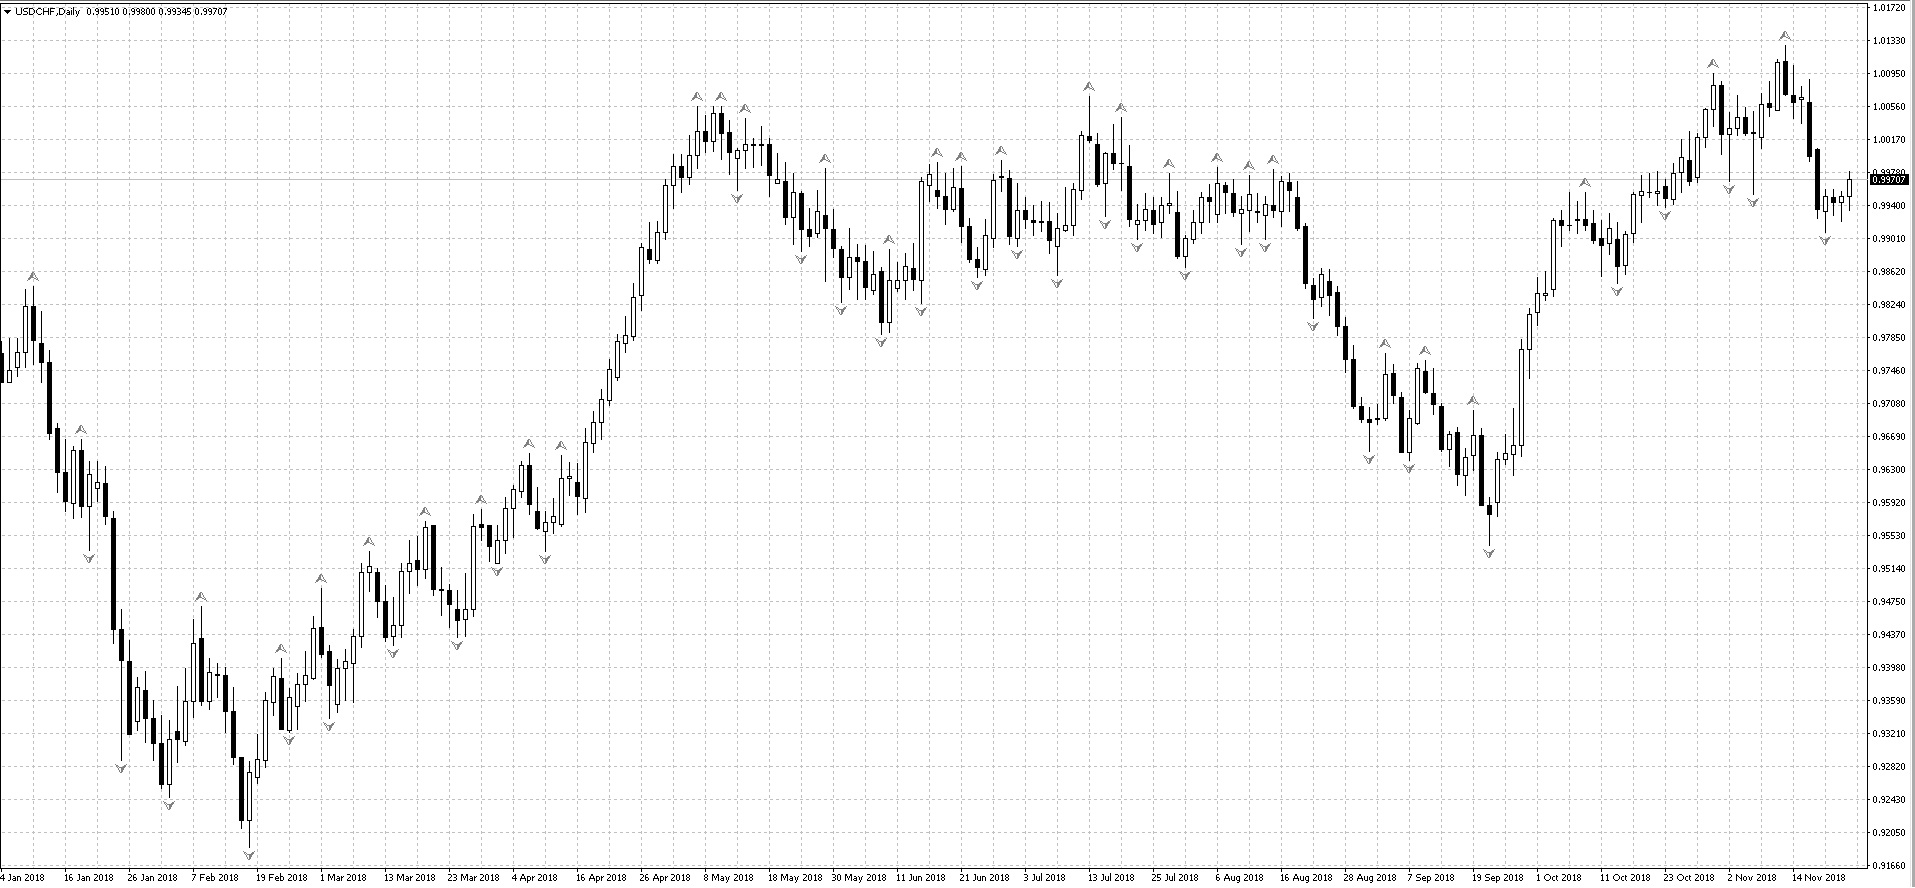 This is a USDCHF D1 chart with a classic fractal. Yes, the chart is simply full of these arrows. If a horizontal line is drawn through each extremum highlighted by the indicator, then the chart itself will no longer be visible behind those lines.
Let us increase the number of periods and look at the result:
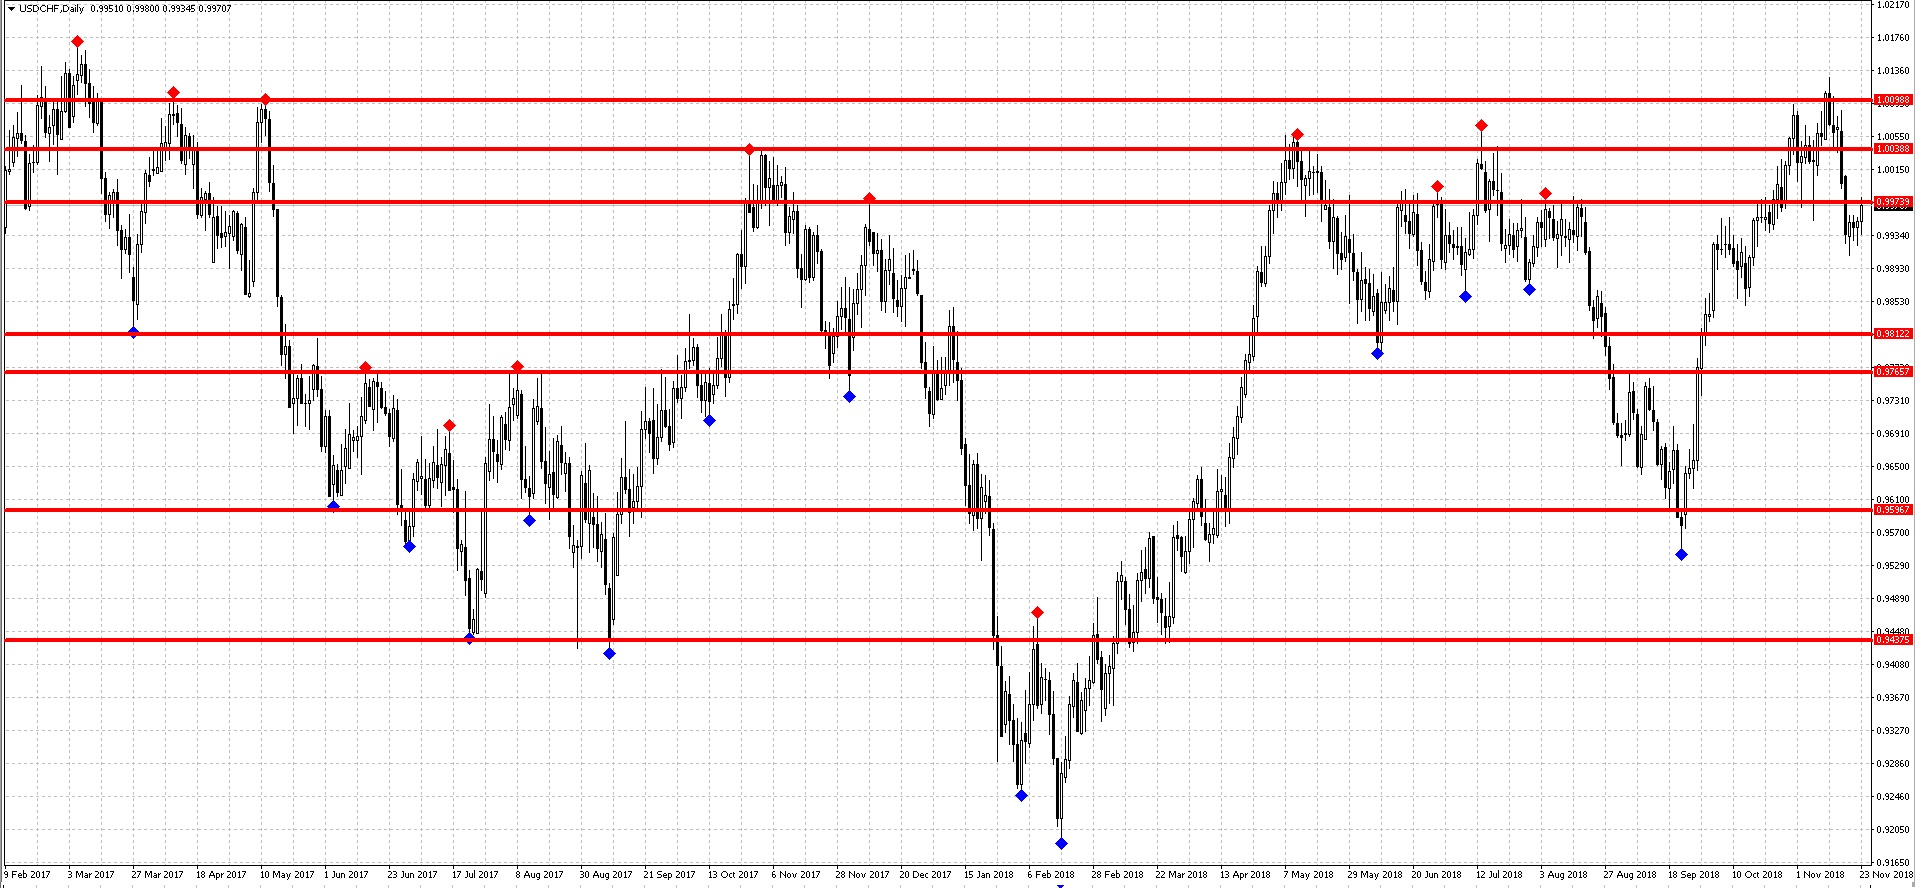 As you can see, the chart became better and only truly significant extremums remained, through which quite tradable levels can be drawn. Pay attention to how the price respects and works off these levels. I am sure that in the future, when the price approaches them, we will again see a reaction to them.
Fractals and Trend Lines

Another fairly good method of using the fractals indicator is determining reference points for building trend lines:
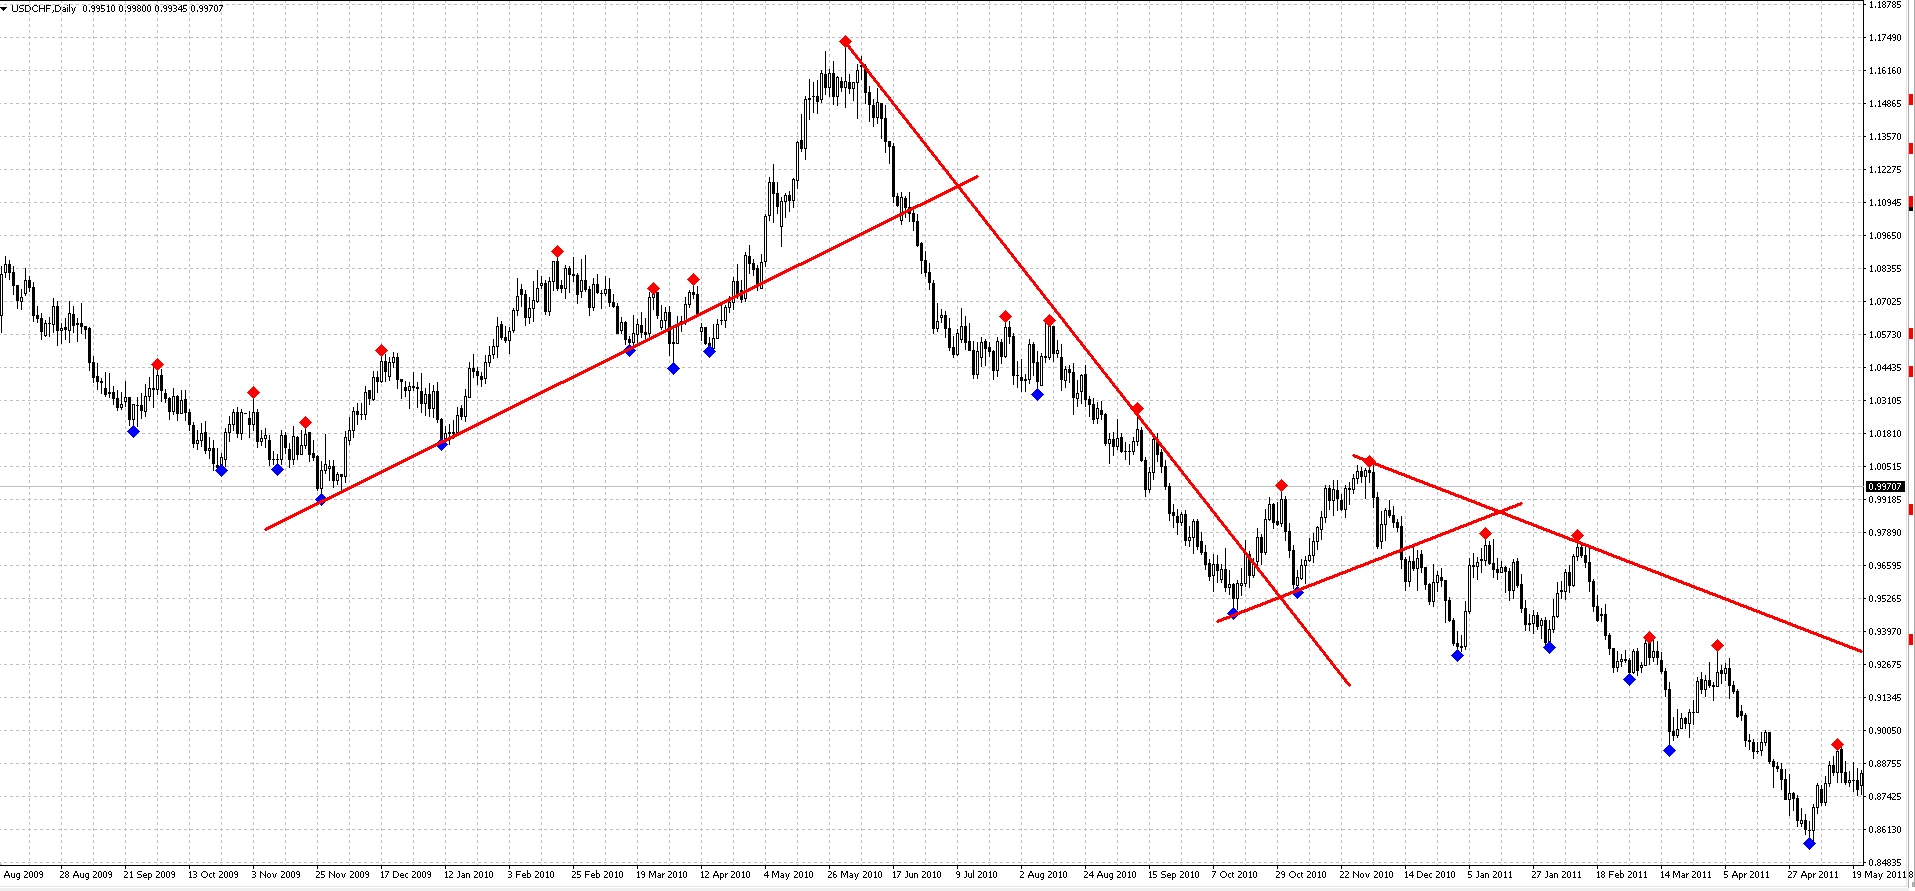 I put the indicator on the chart, increasing the number of bars in the settings. Then I drew several trend lines through some fractals. Indeed, the lines turned out to be quite interesting, and the price interacts with them. Naturally, the trader must have basic knowledge in the field of technical analysis and trend-line construction. But I am sure that for a novice currency speculator this indicator will become a good aid in practice.
Determining the Trend with the Indicator

With the help of fractals, we can also determine the prevailing trend in the market. It is very easy to do. If we recall the definition of a trend, which states that an uptrend is a sequence of rising local highs and lows, while a downtrend is a sequence of declining extremums. Let us put our indicator on the chart and we will see that in an uptrend buy fractals will be updated (broken) more often than sell fractals.
Determining Sideways Movement

If the price could not overcome the previous fractal, this may serve as a signal for the start of sideways movement. To confirm the signal, it is necessary to wait for the formation of the opposite fractal.
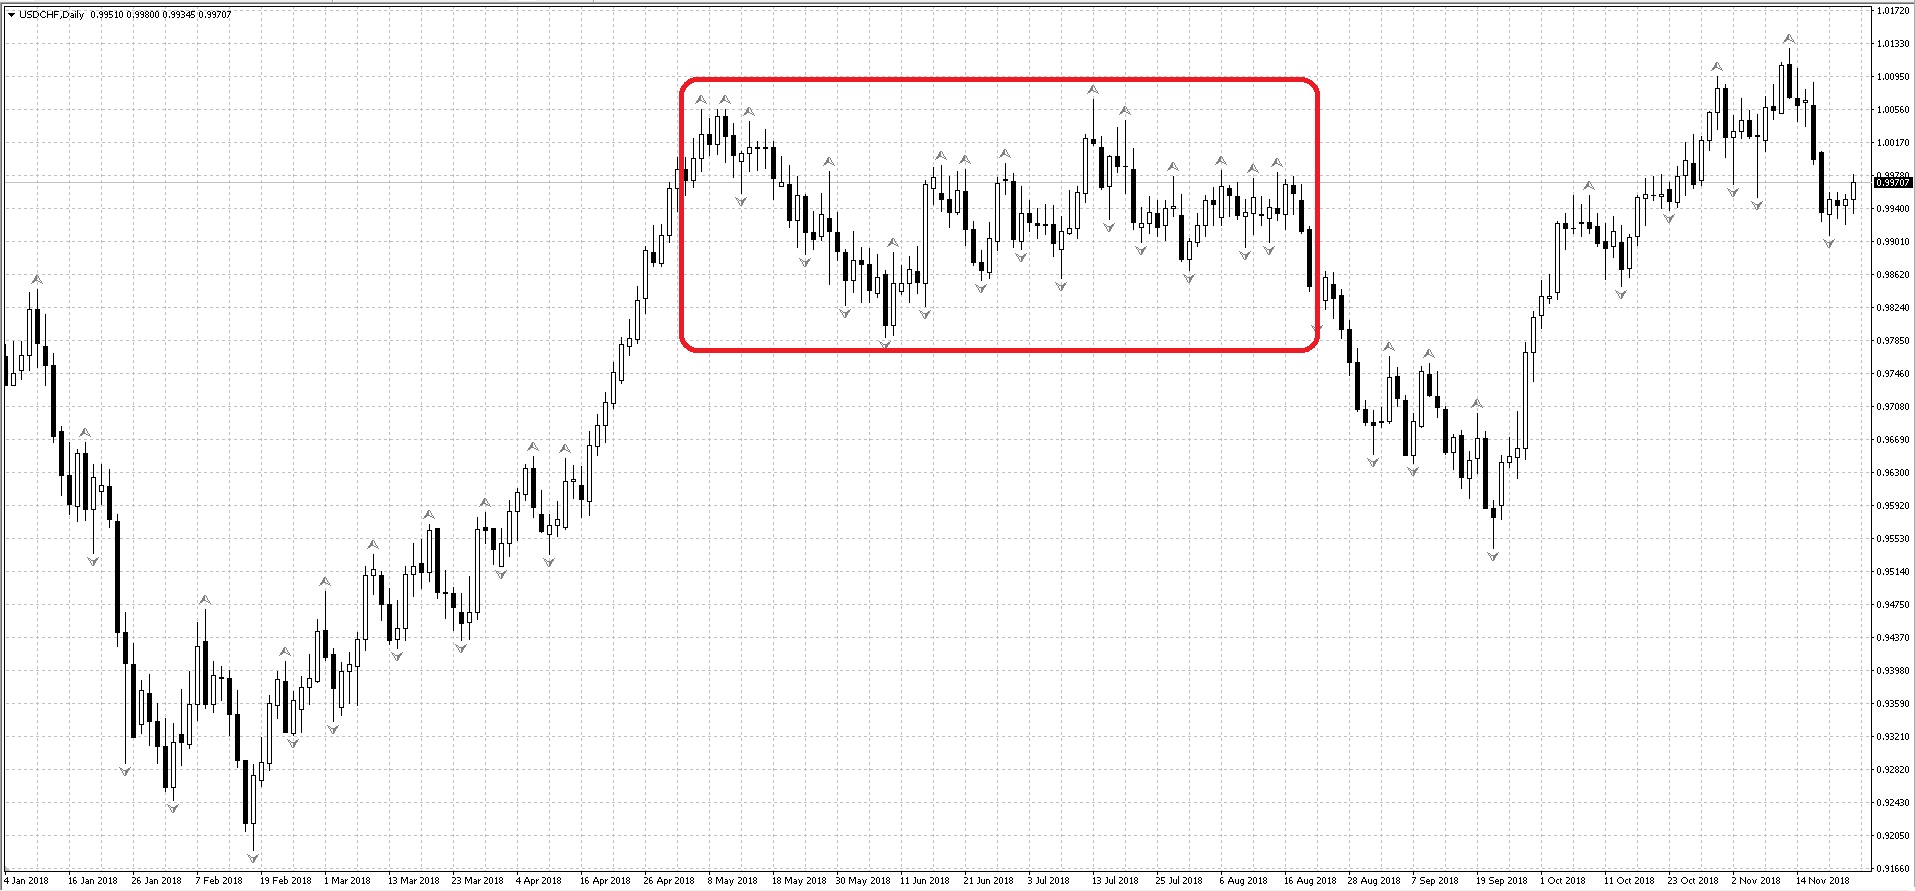 If it also could not break the previous fractal, then one should expect a flat in the range between the upper and lower fractals, which will end after the price breaks one of these levels.
Conclusion

The Fractal indicator and its modifications build many potential entry points on the chart for every taste, most of them seeming quite reliable. In fact, this analysis method is not so simple and unambiguous. Beginners are not recommended to use it as the only factor for making a decision.
Fractals cannot be used to forecast prices. Even Williams considered them, at the very least, only the third confirming factor. Please note that the standard Fractal indicator included in the basic set of trading platforms has no parameters, so choose modifications where the number of calculated bars changes. This way you will be able to tune it more precisely to a specific asset.
Its use will have a positive result only in combination with other indicators on time intervals from one hour and above. Strategies that include the Fractals indicator must necessarily analyze several timeframes. Nevertheless, this indicator should not be dismissed.
Respectfully, Dmitry aka Silentspec
TradeLikeaPro.ru
