
Forex and bonds - Fundamental analysis made simple
 Hello, ladies and gentlemen forex traders!
Traders who trade on forex should also have a general understanding of other financial instruments. Moreover, some of this knowledge can be turned into simple and effective trading strategies. In this overview, we will discuss the relationship between bonds and the Forex market. We will examine what they are, how bond yields affect countries' economies, and how changes in their rates can be used to profit in the currency market. We will show everything that is hidden.
What are bonds and why do they affect currencies?

The government issues bonds when it needs to attract additional funds into the budget. In other words, the state borrows money for a certain period, during which interest is paid to the holder of the securities. Funds may be needed to cover the budget deficit, other debt, and, in general, to finance government projects.
Considering that bonds are always issued in very large volumes, this instrument directly affects the development of a country's economy, influencing the size of the money supply, inflation, and the exchange rate. Therefore, the relationship with the currency market is quite an expected phenomenon.
For example, the red line on the chart shows the dollar basket index. By looking at the index, we can determine what is happening to the currency overall. The blue line represents the yield of 10-year US Treasury bonds, in fact, the most popular bonds in the world.
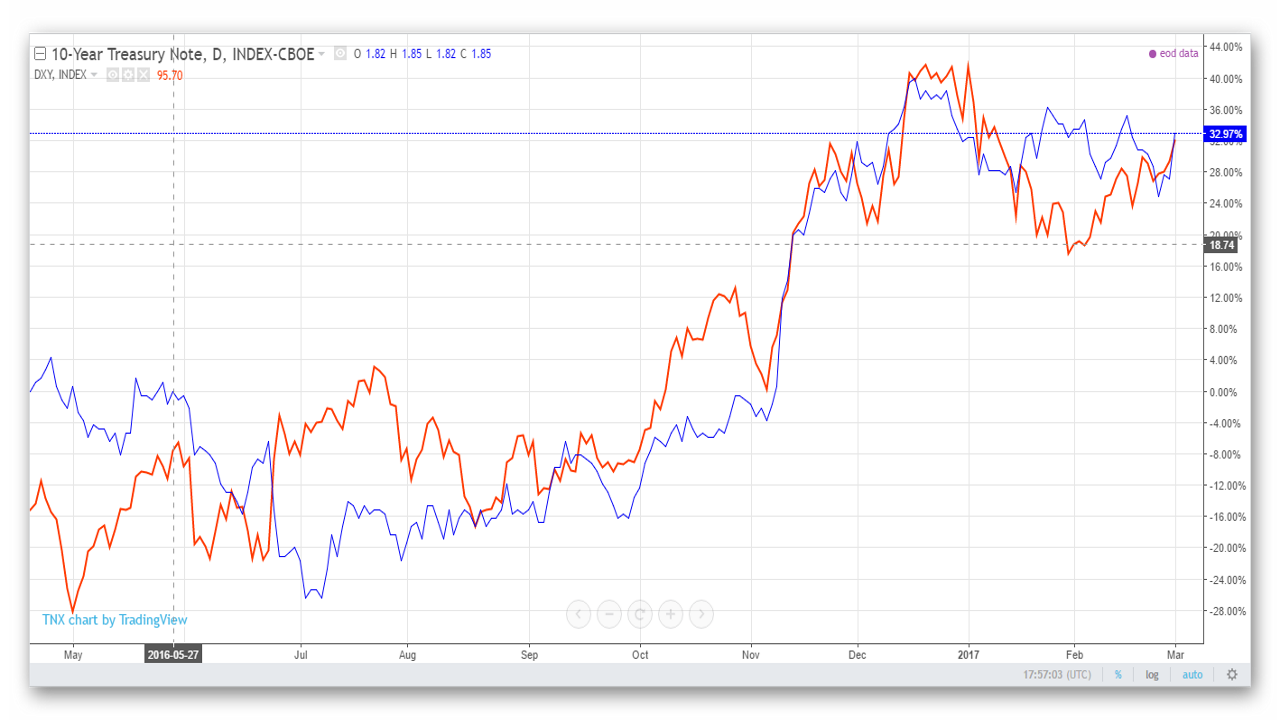 As we can see, there is a strong direct correlation between the dollar basket and US bonds. That is, when bond yields rise, the dollar index also rises; when yields fall, the dollar also declines.
This relationship can be explained by the fact that currencies in the forex market rise or fall partly because of changes in interest rates at central banks. That is, it is the central bank that determines the trend.
But since we cannot know future rates in advance, we are left to rely on expectations. In this regard, the bond market acts as a fairly good leading indicator, because the earliest trends are born there. If bond yields rise, the probability also rises that the bank will decide to raise rates at its next meeting. Likewise, if bond yields fall, a rate cut may soon follow.
But we trade currency pairs. How do we compare the yields of 2 different countries?
Calculating the spread

Yield spread charts for bonds will help us here.
First of all, we look at 10-year securities. At the same time, if you are interested in the EURUSD pair, you need to compare the yields of US and German bonds (the leading economy in the eurozone).
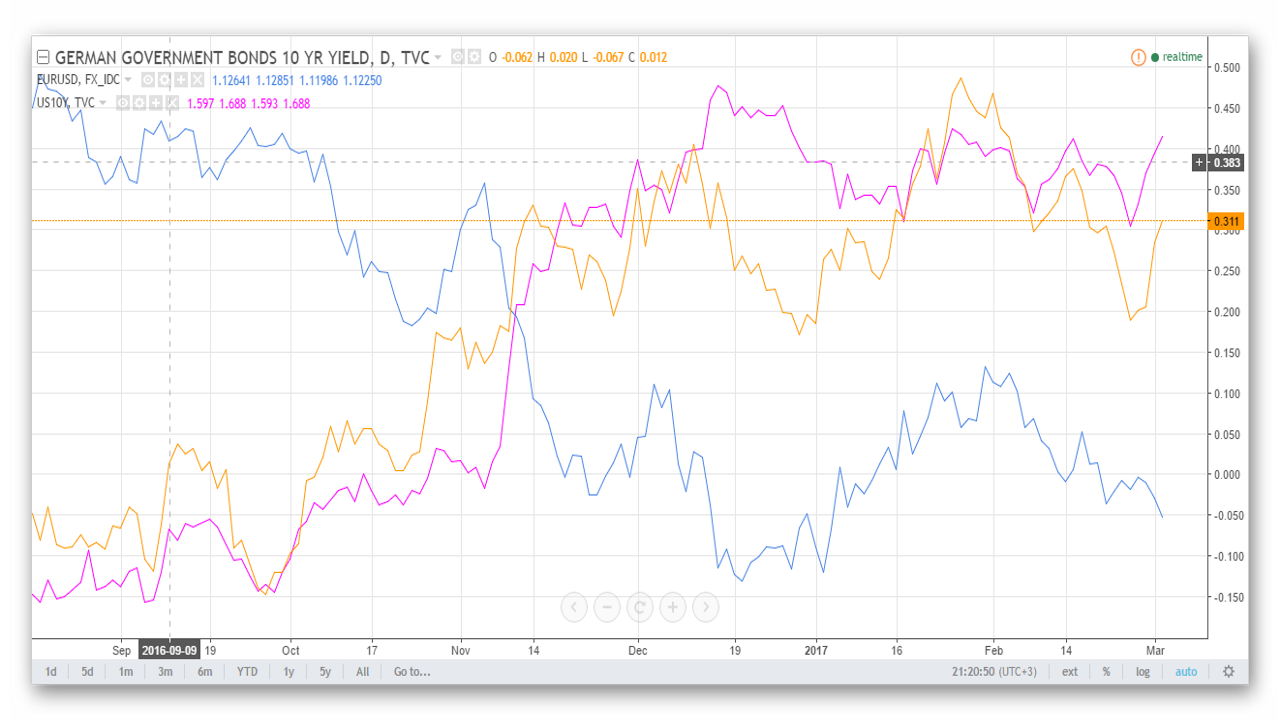 A currency pair has the concept of a spread, but we can also calculate the spread for two bonds. This value can be used as an indicator of the pair's rise or fall. So, the spread of two bonds is the difference in their yields. As the difference between German and US securities grows, we can expect the EURUSD rate to rise; when the spread narrows, we expect the currency pair to fall.
Naturally, you should not look at the momentary value, but at the dynamics of the spread change. That is, look at the trend over several days or weeks, depending on the traded timeframe. For example, if you trade on the hourly chart, several days will be enough. But if your main timeframe is the daily one, you need to analyze the spread over several weeks or months.

There are many different websites that show bond yield values. For example, here you can get changes in bond yields for the US, Japan, the UK, and the Eurozone. There are also full-fledged price charts.

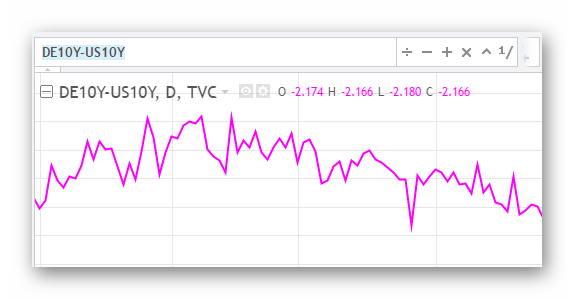
A spread chart can be built on the TradingView platform. In the field for specifying the instrument, you can enter your own formula, in this case, the difference between two instruments. That is, having two tickers, German and US bonds, we can build a spread chart using the formula: current spread = DE10Y-US10Y. Enter the formula and press Enter to calculate the spread.
 List of tickers by country:
- USA - US10Y
- Germany - DE10Y
- United Kingdom - GB10Y
- Japan - JP10Y
- India - IN10Y
- Spain - ES10Y
- France - FR10Y
- Ireland - IE10Y
- Italy - IT10Y
- Portugal - PT10Y
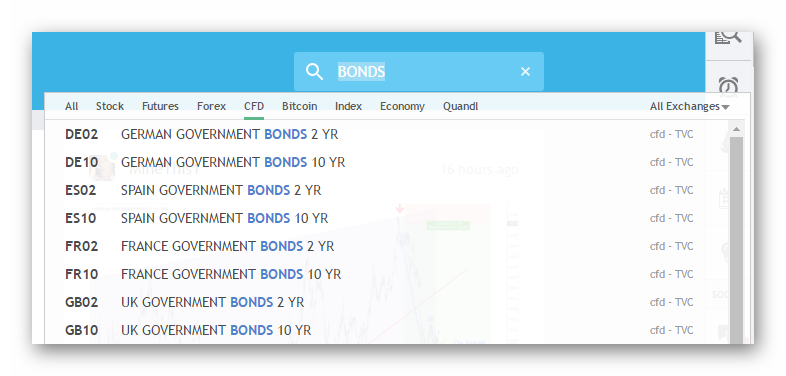
A list of all bonds can be obtained by searching for the keyword BONDS.
 It is worth noting that although 10-year securities are good for forecasting currency rates, two-year notes are better suited for forecasting interest rates. In other words, we choose the appropriate bond term depending on the task.
Making a forecast

On the chart, the orange line represents the spread of 10-year German and US bonds. The blue line is the EURUSD rate.
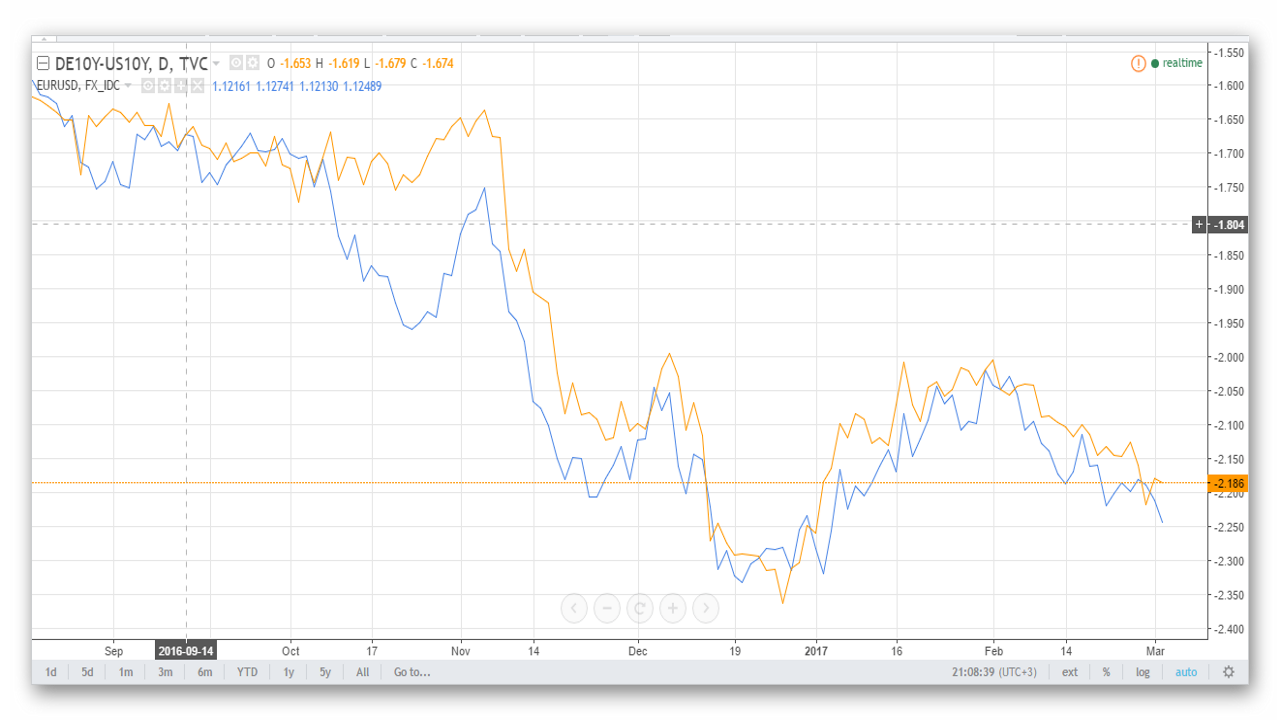 Most of the time, we observe a strong direct correlation. That is, the exchange rate of the currency pair and the yield of the securities move in the same direction. But at times, so-called decorrelation occurs, when the direct relationship breaks down. It is precisely at such moments that we can extract profit.
For example, if a currency pair is rising while the spread starts to fall, this is a signal that the exchange rate will also soon begin to decline. In other words, the spread is a leading indicator, and if we see this relationship break down, we should open a position in the direction of the spread. In this case, when it falls we enter short, and when it rises we enter long.
In fact, it does not matter whose fault caused the decorrelation. For example, the bond spread hardly changed when the pair dropped sharply. In that case, the exchange rate ends up in the oversold zone, which means that at the first opportunity you can take a long position. For confirmation, you can use any technical indicator, for example, Bollinger Bands. As soon as the price breaks through the lower boundary from bottom to top, enter the market.
Conclusion

So, remember: for trading, we look at the 10-year bonds of the countries whose currencies we trade. If it is EURUSD, we look at the Eurozone and the United States. If it is GBPAUD, we look at the United Kingdom and Australia, and so on.
Choose the trend window depending on your trading timeframe. If you trade intraday, naturally, the yield dynamics over the last six months will not tell you much. But if you trade on the daily timeframe, then it makes sense to look at the trend over the past few weeks or months. For the hourly timeframe, 1-3 days will be enough.
Bonds are not a 100% guarantee of a successful forecast, but they are a very strong signal. Therefore, you should also pay attention to other economic news, speeches by central bank heads, correlation with other instruments, and so on. Also, to confirm an entry, especially intraday, use additional indicators - RSI, Bollinger Bands or any other one you are used to.
Sincerely, Pavel Vlasov TradeLikeaPro.ru
