
Fear and Greed Indicator in the Stock Market: the VIX Volatility Index

Financial markets are not only economic reports, monetary policy, and corporate earnings, but also participant sentiment.
When experienced traders talk about assessing market sentiment, the VIX volatility index is most often mentioned in this context. In the financial press it is often called the “fear index” (Fear Gauge Index), although it would be fairer to consider it an indicator of the general emotional background, a mix of fear and greed.
If there is no risk appetite (risk-off), then no reports will produce a noticeable move in the financial markets. And if everything is fine (risk-on), then money flows into the trashiest stories like GameStop shares (ticker GME on NYSE) or even into crypto assets.
Understanding VIX helps novice traders navigate market dynamics better and therefore avoid impulsive and poorly thought-out decisions. How can an ordinary trader learn to use this powerful indicator of fear and greed in order to understand what sentiment is on the market right now?
The answer to this important question for a medium- and long-term trader is below the cut.
What the VIX fear and greed index is
The VIX index (Volatility Index) is an indicator of the expected volatility of the U.S. stock market over the next 30 days. It is calculated by the CBOE (Chicago Board Options Exchange), and it was there that the index was first introduced in 1993. Its chart can easily be found on TradingView.
The main feature of VIX is that it is based not on historical volatility but on expected volatility, which investors and portfolio managers embed in the prices of options on the broad-market S&P 500 index. It is precisely the assessment of expected volatility that makes it possible to use this index as an indicator of fear and greed.
The logic here is very simple: in conditions of increased uncertainty, investors buy options, insurance, and hedging strategies more actively, which means the volatility embedded in options rises.
To calculate this instrument, the prices of a large set of call and put options on the S&P 500 index with different strikes are used. In essence, VIX is a barometer of expectations regarding future S&P 500 fluctuations: the broad market falls and the volatility index rises, and vice versa.
The VIX index is a calculated value, therefore it cannot be traded directly. But exchanges offer a wide range of derivative instruments for trading. The main derivatives on the VIX index are the following instruments:
- VIX futures. They are traded on the CFE (CBOE Futures Exchange) and are the main instrument for professional players for speculation and risk hedging.
- VIX options. They are also available on CBOE and are used for risk-limited hedging and directional strategies.
- VIX and volatility ETFs and ETNs. For retail traders there are exchange-traded funds that track VIX futures, for example VXX, UVXY, SVXY, and others.It is important to understand: they do not track the index itself, only the futures structure. Because of contango, such funds tend to decline over the long term.
How to interpret VIX index values
It is important to remember that the VIX index is not a market direction indicator, it only shows the level of expected volatility. The rise of VIX, despite the inverse correlation with the S&P 500 index, does not necessarily mean a further fall, and its decline does not mean a continuation of growth. It is more a barometer of current sentiment.
The following values are used to assess market sentiment with the help of the fear and greed indicator:
- < 15 — the market is calm, low volatility
- 15–25 — moderate volatility
- >25 — rising fear and uncertainty
- >40 — panic, crisis expectations
Low values often coincide with confident stock-market growth, investors are relaxed. High ones coincide with sharp declines, when most participants seek to insure their positions.
In other words, a high VIX (usually above 30-35 points) corresponds to a phase of fear and uncertainty (risk-off). Market participants expect strong fluctuations. As a rule, this happens during crises, geopolitical shocks, or sharp corrections. Investors panic-buy options on the S&P 500 index and on VIX itself. At such moments greed gives way to the instinct of self-preservation.
A low VIX (usually below 15-20 points) corresponds to a phase of greed (risk-on), calmness, and overconfidence. Market participants are confident in stability and in the continuation of upward dynamics. Investors are relaxed, the need to buy insurance seems minimal: the cost of protective options amounts to a few percent of the portfolio, and in such periods investors prefer to keep those few percent for themselves. In essence, greed and the desire not to miss profit (a bull trend) prevail in the market.
VIX spikes on the historical chart
The volatility index is not called the fear and greed indicator for nothing. At the same time, it assesses fear much better than greed.
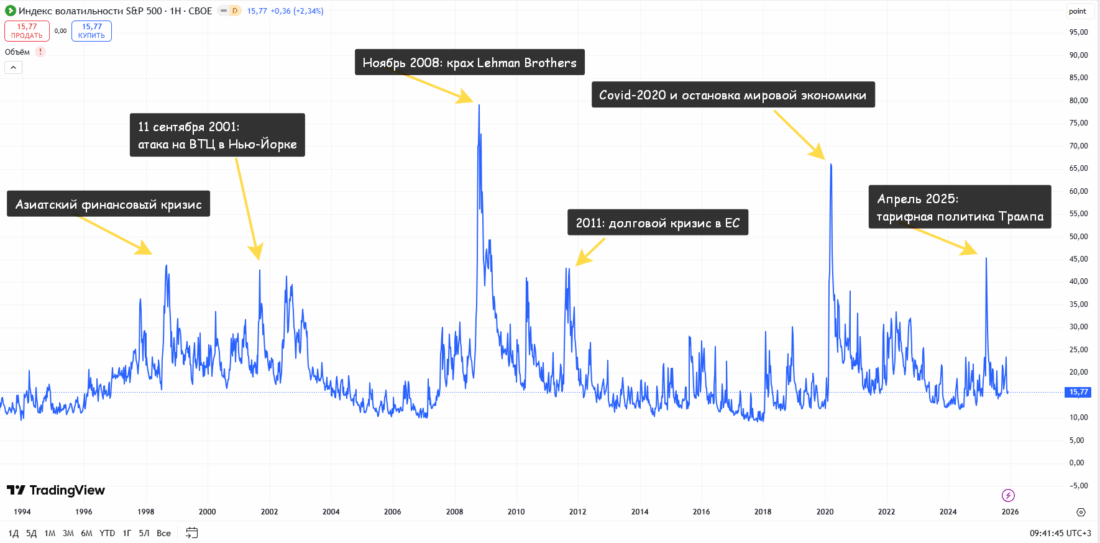
The historical highs reached by VIX always coincide with the biggest crises in the markets. This is what it looks like on the weekly line chart.
VIX reached its highest historical value on October 24, 2008, 89.53 points. The collapse of Lehman Brothers and the chain of bankruptcies that followed strongly resembled the beginning of the Great Depression of the 1930s.
The index reached the next peak (85.47 points) on March 18, 2020, when it seemed to everyone that the pandemic was with us forever and that global trade could be forgotten.
The third peak (60.13) occurred on April 7, 2025. There is no point even mentioning Trump's 50-100-150% tariffs on the whole world.
It is amusing that on the smoothed line chart the one-day VIX spike of August 5, 2024 is not visible at all. Let me remind you that a sharp collapse of the Japanese stock market happened then, one that exceeded the relative indicators of the 1987 crash. The fear index jumped that day from 23.39 to 65.73 and closed at 38.57. The panic subsided in literally two days, and on the weekly smoothed chart it is simply not visible.
VIX analogues: volatility indices in other markets
Besides VIX, there are similar indicators for other stock indices:
- VXN — Nasdaq 100 volatility
- VXD — Dow Jones volatility
- RVX — Russell 2000 volatility
- VSTOXX — the “European VIX” for Euro Stoxx 50
- VXJ — Japanese Nikkei volatility
There are also broader sentiment metrics:
- Fear & Greed Index (CNN) — a combined greed/fear indicator
- MOVE Index — U.S. bond-market volatility
- OVX, GVZ, EVZ — oil, gold, and euro volatility respectively
Thus, the trader has a whole set of ways to learn the emotions of market participants.
How a beginner trader can use the VIX indicator
If a trader has decent capital under management, it is worth thinking about buying futures or options on the fear and greed index. But to trade VIX futures and ETNs one needs to understand the structure of the futures curve, otherwise working with these instruments will be extremely risky.
If elevated risk is not an obstacle but part of the strategy, then it is worth looking toward instruments such as SDS (a double ETF inverse to the S&P 500 index) and SPXU (a triple ETF inverse to the S&P 500 index). Everything is simple here: the S&P 500 index goes 1 dollar down, SDS goes 2 dollars up, and SPXU goes as much as 3.
And what should those do who have several thousand or even tens of thousands of dollars under management and no ability to buy the corresponding derivatives?
In that case, it is necessary to use the VIX volatility index as an indicator of fear and greed. Below is a list of the main actions.
1. Assessing the current emotional background.
If VIX rises sharply, it means investors expect turbulence. In such periods, beginners should avoid excessive risk, especially aggressive leverage.
2. Determining market phases.
- Low VIX → the market is calm, trends may be sustainable.
- High VIX → sharp moves and false breakouts are likely, strategies require caution.
3. Help in choosing a strategy.
High expected volatility makes options expensive: volatility-selling option strategies work well here (for experienced traders). Low volatility makes options cheap: volatility-buying strategies are possible.
4. Using correlation.
VIX often moves in the opposite direction from the S&P 500. This helps to understand how strong the emotions are behind the current move of the index.
Example of assessing market prospects with the VIX fear indicator
Let us examine work with the VIX fear indicator using the example of early 2025, when Mr. Trump announced tariffs against the whole world.
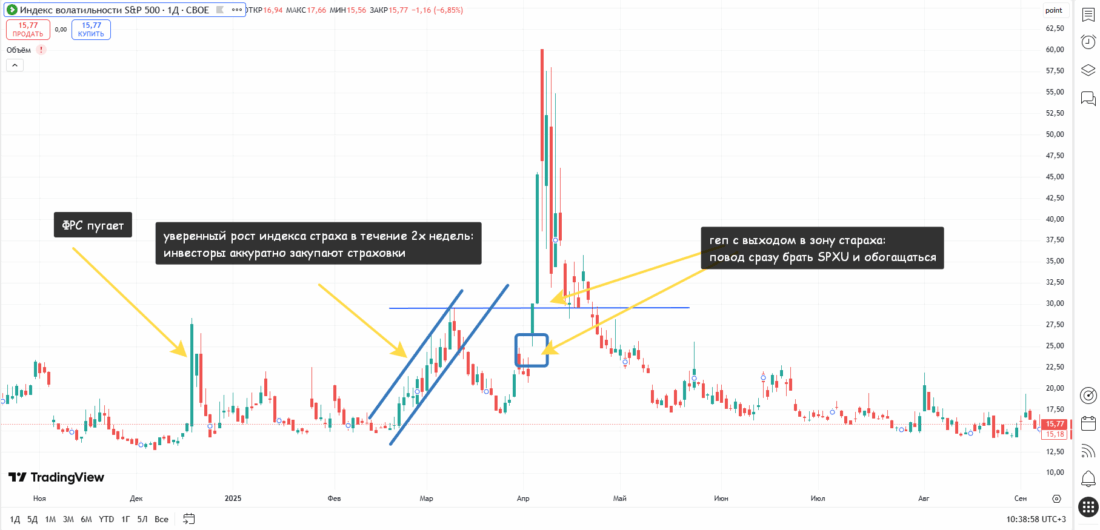
First, let us note that at the last Fed meeting (December 18, 2024) there was a sharp rise in VIX. At the same time, the stock market fell like a stone. What Powell said then, I do not remember and we will not recall it, but the fact remains: the market was strongly triggered, VIX rose to 28.32.
After that there was ordinary work in the range from 15 to 22. And then on Friday, February 21, VIX briskly starts to rise and by March 10 reaches 29.56. What matters here is not the value itself (although it did reach the previous highs), but the unambiguous growth of caution over two weeks.
Then (from March 11 to 25) there followed a decline to 17 points, then another rise within the normal range, though from slightly higher values. And then on April 3 there is a gap on the index. People sharply begin buying futures. And Trump talks about how the whole world must pay.
From April 8 the markets calm down. Whoever needed to did load up on stocks at the tastiest prices in two years in order to make +30% on the S&P 500 index in half a year. And this is without any quantitative easing and against the backdrop of the Fed's tight policy.
And now let us look at the ES chart (S&P 500 futures).
Friday, February 21. The quote falls like a stone, now all of the week's liquidity is much higher than the current values: this is a clear short signal. If you look wider, the quote fell below the liquidity of the previous 5 weeks. A real warning bell. The day and the week close in the 6015-6035 range, which clearly acted as support and was at that moment the average VWAP of 2025.
The next week they work in a plane below all purchases, which is an add-on to selling within the distribution of accumulated shorts. And a week later, starting from March 3, they break down the yearly bottom at 5830-5900. This is also a clear sell signal.
By March 10 VIX reaches highs and begins to reverse. On VIX, by March 12, almost everything is already clear. But ES continues to decline until March 13 (compare VIX and ES for March 13). From March 14, a pullback begins on ES.
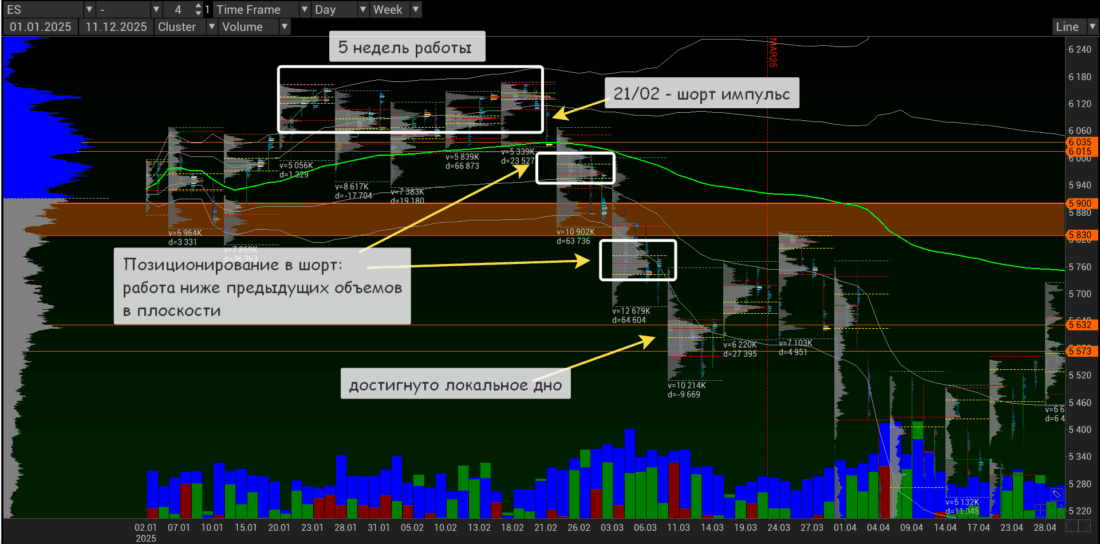
The new contract begins with short distribution. A quite understandable model of continued selling is forming.
We are interested in April 3, the date when VIX clearly entered a buy impulse (a large gap between daily sessions, a breakout of previous highs with holding, and a rise in turnover in the VIX futures).
I will repeat once again: at the end of March it was visible that shorts were being loaded. And from the end of March VIX shows confident growth within its boundaries. But on April 3 (Thursday, the best time to start dynamics) the S&P 500 opens below all supports.
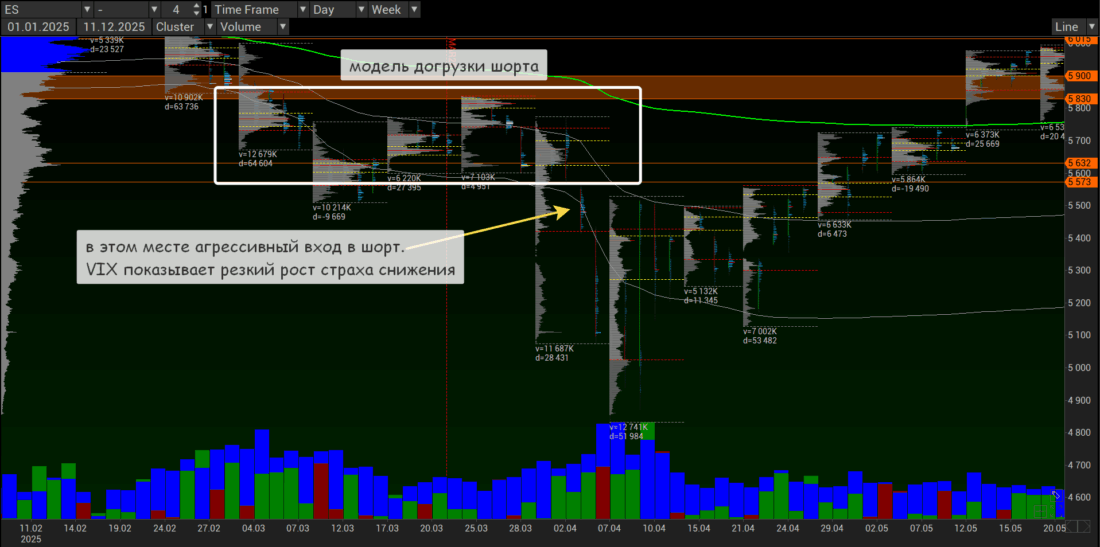
This is a confident continuation of short distribution. It is visible both in the S&P 500 index itself and in the VIX index. This means no buying at all and only speculative short. This short did not last long, but over the last 15 years corrections and pullbacks in the stock market have become shorter and shorter, thanks to the Fed for endless liquidity.
Conclusion
The fear and greed indicator, the VIX volatility index, is not a Holy Grail and does not predict market direction. It does not always react to macroeconomic news. And it can remain relatively low for a long time despite risks, or fairly high in periods of uncertainty even if there is no panic.
But it is precisely this indicator that quite often, reliably, and clearly allows one to determine what investors expect from the market.
Respectfully,
Ivan Rusin