
Everything You Were Afraid to Ask About Divergence in Forex

Hello, fellow traders! I am often asked: does technical analysis work? Which forex indicator is the best?
There is no best indicator. But if I were offered to choose only one element of technical analysis in forex that carries the greatest power, I would choose divergence.
What Is Divergence?

You must be wondering what divergence is. Perhaps you suspect it, or you must be one of the few who truly know what this signal represents. Divergence is an early sign of how the market will behave in the near future. At the moment of its reversal, the market as a rule reaches its peak and lets us know that it no longer has the strength needed to continue its movement in the same direction.
As an interpretation of this term, the dictionary gives a short list of the following related words:
Change of direction, deviation, divergence, and disagreement.
During trading in the forex market, the phenomenon of divergence appears, which is displayed as follows: "the direction of the indicator's movement diverges from the direction of the price movement".
This phenomenon is reflected to a greater extent by such indicators as MACD, the stochastic oscillator, and RSI. You can also see divergence on other indicators that you would never even have thought could display it.
As is known, the market moves in an up and down direction, even in a trend. The oscillator strictly follows the movement of price. If the market moves up, the oscillator also moves up. When the market draws a higher high, the oscillator also draws a higher high.
Divergence forms when the market shows a high maximum on the chart, but the oscillator, which strictly follows it, does not show a higher maximum and instead draws a lower maximum! This clearly demonstrates a situation when the oscillator indicates that the market has weakened and that there is a high probability that in the near period of time a price correction (pullback), or even a market reversal, will occur.
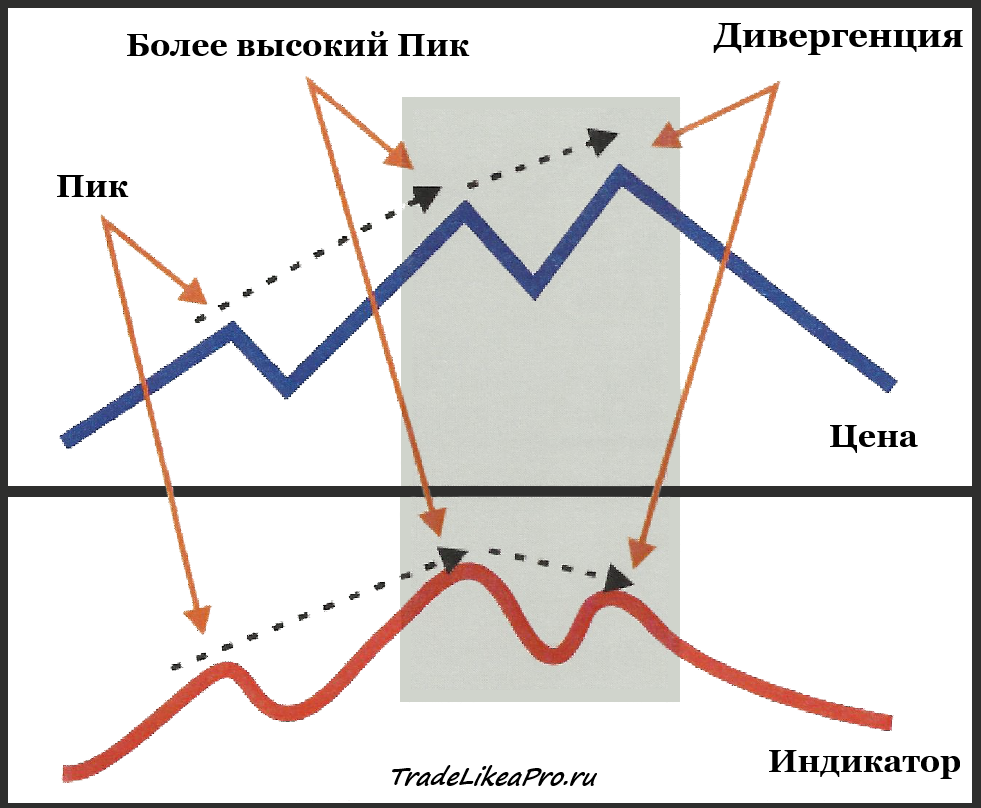
The market makes a higher high, however the indicator draws a lower high!
The divergence in the example above is called a classic "bearish" divergence. We will gradually introduce new terms and their interpretation. In this example, we show you the point that indicators do not always display the trend present in the market. And we can use this discrepancy to open a position!
A similar situation can also appear in a falling market. If the market shows lower lows, the indicator also shows lower lows. If there is a discrepancy between the price chart and the indicator, we assume a possible change of direction.
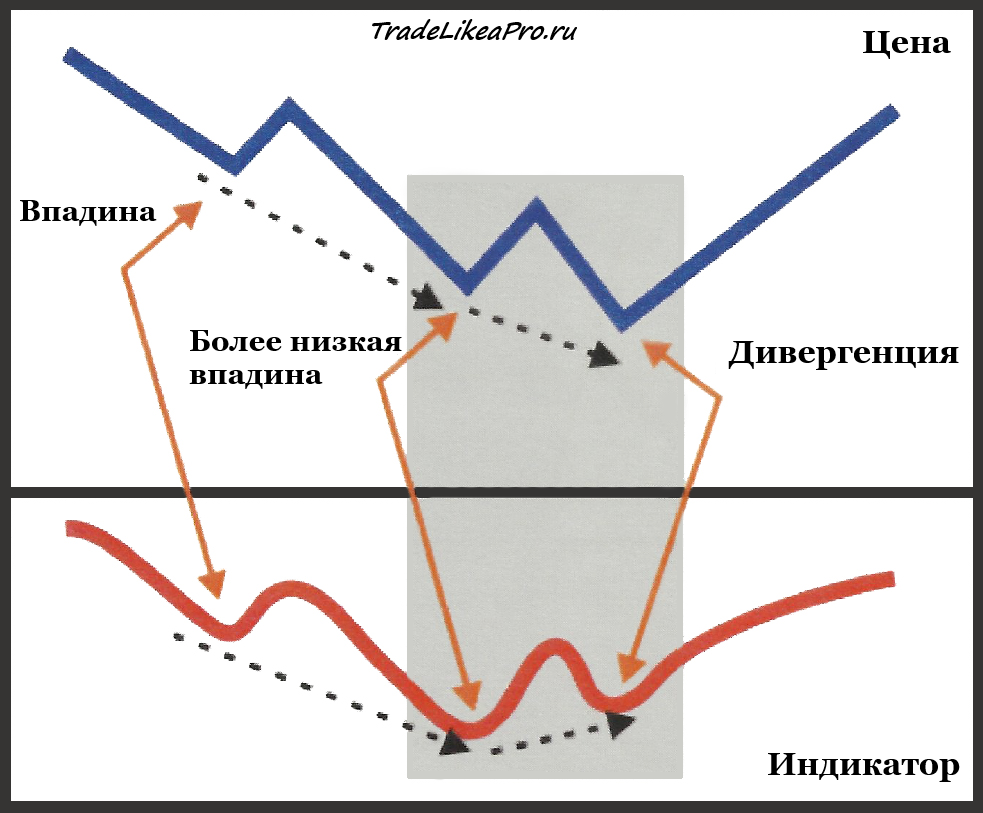
The market makes a second lower low, however the indicator makes a higher low!
The divergence described above is called a classic "bullish" divergence. The term "bullish" refers to the direction of the price chart in which the market will move after the divergence.
- "Bullish", if the market then goes upward.
- "Bearish", if the market then goes downward.
Different Types of Divergence

Earlier we considered the possibility of trading in both types of trends, using various counter-trend trading techniques. There are different types of divergence.
The most common type of divergence is counter-trend divergence. Many traders to some extent possess the techniques of trading against the trend. Since these techniques are so widespread in ordinary trading, this type of divergence is called classic or ordinary divergence. At the basis of other trading systems used by traders there sometimes lies the same ordinary divergence, it is just that the trader does not comprehend its presence in it. In this guide, we will help you understand trading techniques more deeply, and you will identify divergence in your trading strategies, along with the application of other trading principles.
Types of Divergences
1. Classic or ordinary divergence
2. Hidden divergence
3. Extended divergence
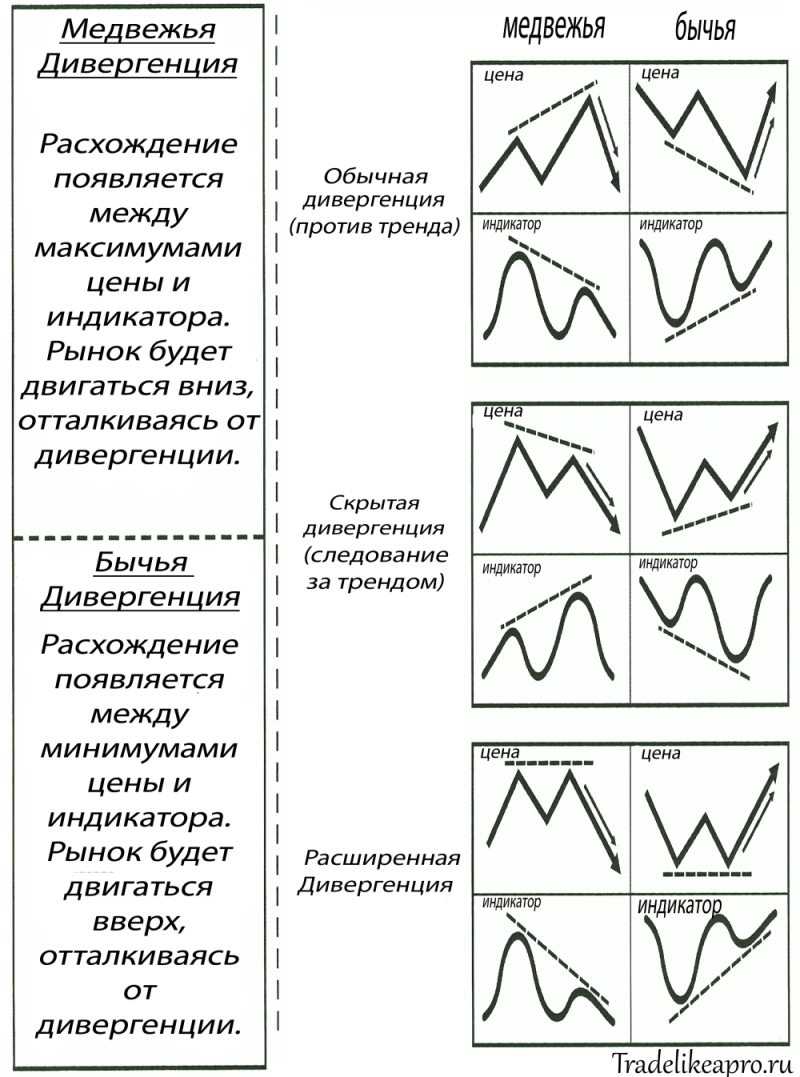
Classic divergence is the most frequently encountered; it occurs during a trend reversal.
Hidden divergence is known to approximately 25% of forex traders who use regular divergence. Hidden divergence is a sign of trend continuation.
Extended divergence is also a sign of trend continuation. Few people know about this type of divergence. Nevertheless, it is a powerful signal that can be used in trading.
Classic Divergence

Regular divergence is one of the types of divergence that foreshadows a trend reversal in the forex market and may be a signal to open a long (buy) or short (sell) position.
- Regular bearish divergence indicates that the price chart is about to go down, be ready to sell.
- Regular bullish divergence indicates that the price chart is about to go up, be ready to buy.
Classic bearish divergence:
In order to identify regular bearish divergence, we must look at the highs, or peaks, of the price chart and the indicator. Regular bearish divergence takes place when the price chart draws a higher high, while the indicator draws a lower high. For this it is not at all necessary that there be a series of higher highs on the price chart (in the market); it is enough to see one higher peak compared with the previous one. If the indicator shows divergence, then this is a signal of a possible downward movement that we can use to open a sell position.
Classic bearish divergence
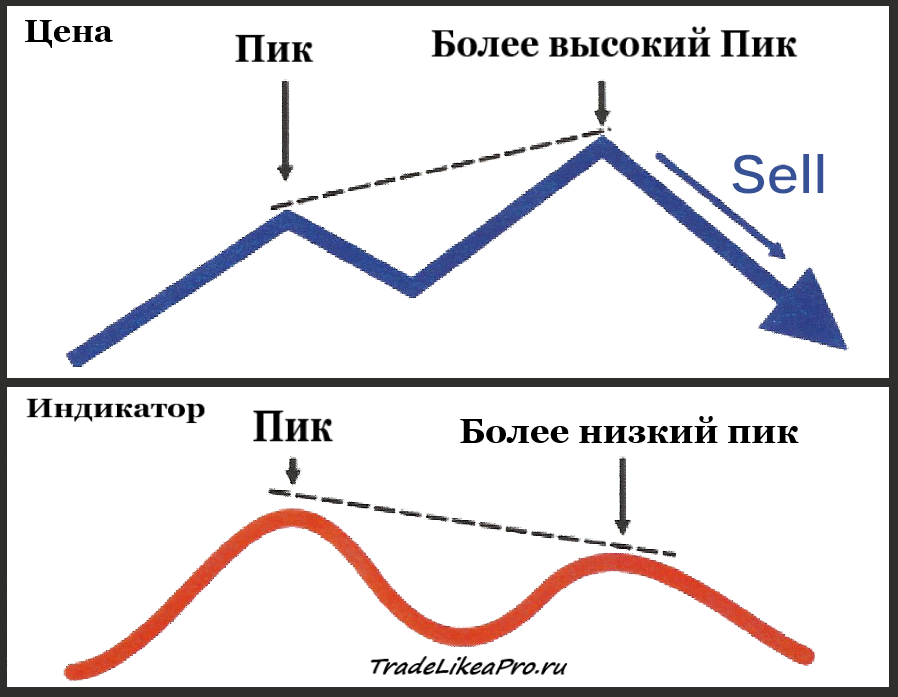
The dotted lines help you determine whether the second high is above or below the first.
Classic bullish divergence:
In order to identify regular bullish divergence in forex, we must look at the lows, or bottoms, of the price chart and the indicator. Regular bullish divergence arises when the price chart draws a lower low, while the indicator chart draws a higher low. Similar to what was said earlier, it is not at all necessary that this be a series of lower lows on the price chart; it is enough to see one lower low compared with the previous one. If the indicator shows divergence, then this is a signal of a possible upward movement that we can use to open a buy position.
Classic bullish divergence
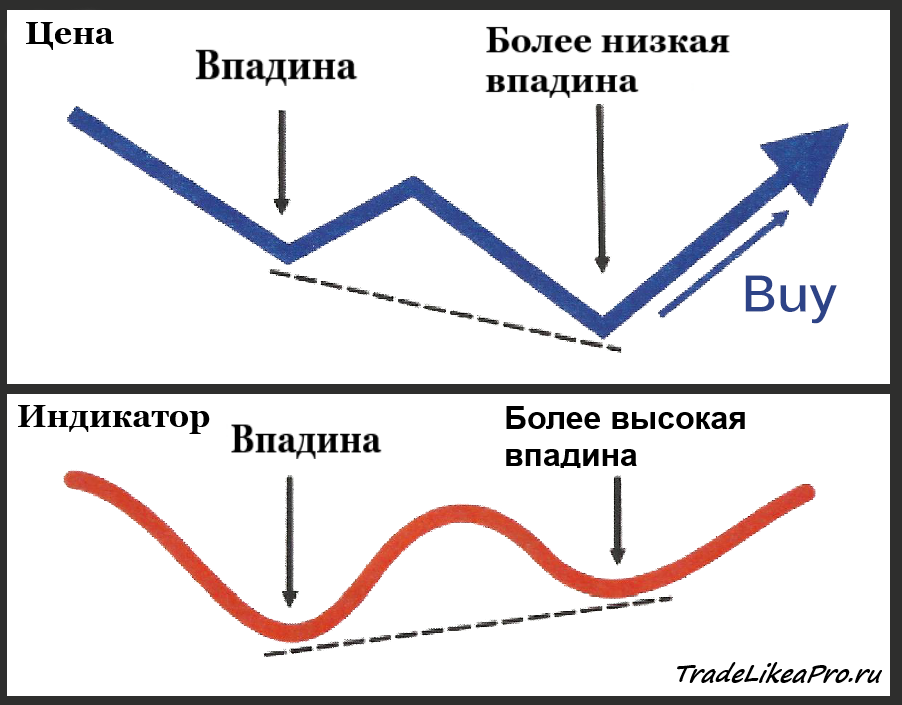
The dotted lines help you determine whether the second low is above or below the first.
As you can see from these examples demonstrating divergence, in most cases you will see a line connecting the first high (or low) with the second high (or low), both on the price chart and on the indicator. This is the very best way to clearly detect divergence. Later you will see divergence visually, but at the beginning, while you are just starting to master this signal, the connecting lines will help you a great deal in this. I have used divergence as a signal for entering the market for many years, but even at the present time I still draw these auxiliary lines on my charts.
Hidden Divergence

Hidden divergence is divergence that is a trend continuation signal and is much more difficult to see. Very few traders know about its existence. Like regular divergence, hidden divergence may be a signal to open either a long or a short position.
- Hidden bearish divergence indicates that the price chart continues to move downward.
- Hidden bullish divergence indicates that the price chart continues to move upward.
Hidden bearish divergence:
To identify hidden bearish divergence, we must look at the highs, or peaks, of the price chart and the indicator. Hidden bearish divergence occurs when the price chart (the market), moving downward, forms lower highs. In this case, the indicator, displaying divergence, forms a higher high.
Hidden bearish divergence
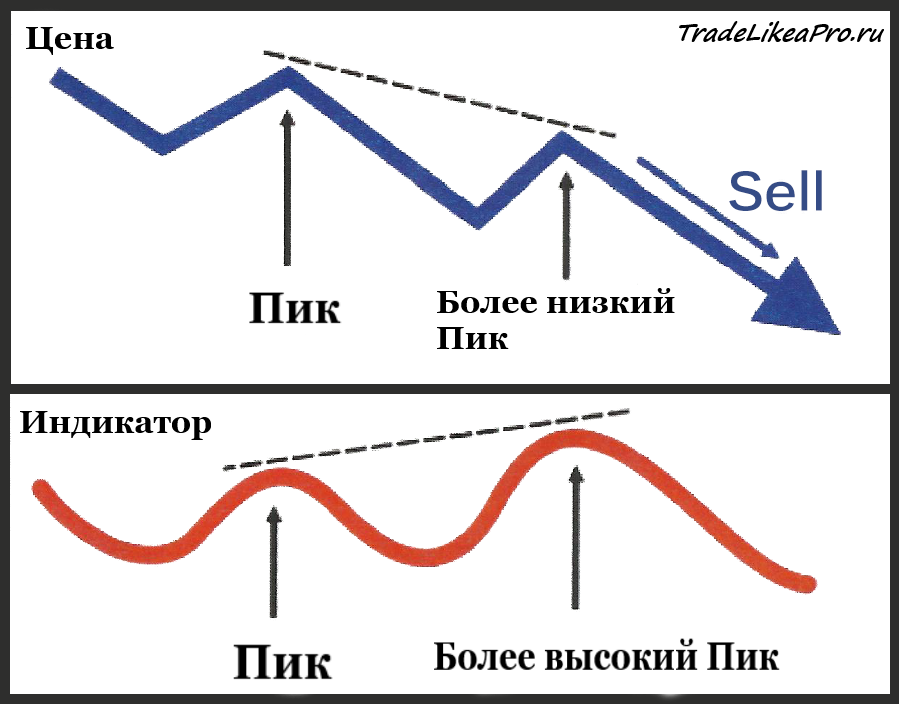
The dotted lines help you determine whether the second high is above or below the first.
Hidden bullish divergence:
To identify hidden bullish divergence, we must look at the lows, or bottoms, of the price chart and the indicator chart. Hidden bullish divergence occurs when the price chart (the market), moving upward, forms higher lows. In this case, the indicator, displaying divergence, forms a lower low.
Hidden bullish divergence
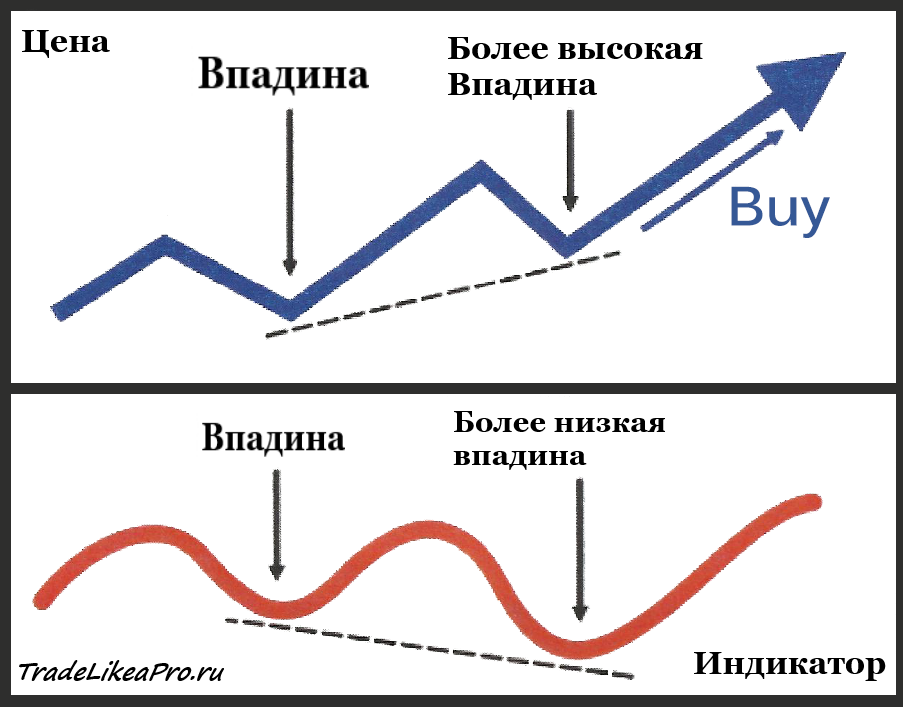
The dotted lines help you determine whether the second low is above or below the first.
Hidden divergence is sometimes compared to a slingshot. The idea is that the indicator acts as the slingshot: after a small correction, the market catapults in the same direction in which it is already moving. The indicator shows a small pullback, providing you with a good signal to enter the market.
Extended divergence

Extended divergence is similar to regular divergence, but in this case the price movement chart forms a figure very similar to a double top or a double bottom. Along with the fact that the second top (or bottom) on the price chart is at the same level as the first, the indicator forms a second high (or low) at another level, which differs significantly from the first. This extended interpretation of market behavior indicates that the market continues to move in the same direction.
Quite often, if the market makes similar rises and falls, there is hope that some consolidation will occur. Extended divergence can indicate that the market still has enough potential to continue its movement and that consolidation will not occur yet.
Extended divergence is one of the varieties of regular counter-trend divergence. You will see it every time at the bottom of a powerful market move, at the moment when the market begins to think about pausing its movement. Instead of changing direction to the opposite and instead of forming a consolidation figure, the market will continue moving in the same direction.
- Extended bearish divergence indicates that the price chart continues moving down - time to sell.
- Extended bullish divergence indicates that the price chart continues moving up - time to buy.
Extended bearish divergence:
To identify extended bearish divergence, we must look at the highs, or peaks, of the price chart and the indicator. Extended bearish divergence is usually identified at the peaks of a large move. The market forms a kind of double top, but it is important to note the fact that the double top does not necessarily have to be classical: the second high may be slightly above or below the first. Despite the fact that the highs on the price chart are located at approximately the same level, the indicator will show a significantly lower second high. The indicator DOES NOT DRAW a double top similar to the market movement chart. The relationship between the price chart and the indicator will seem rather unusual... extended.
Extended bearish divergence
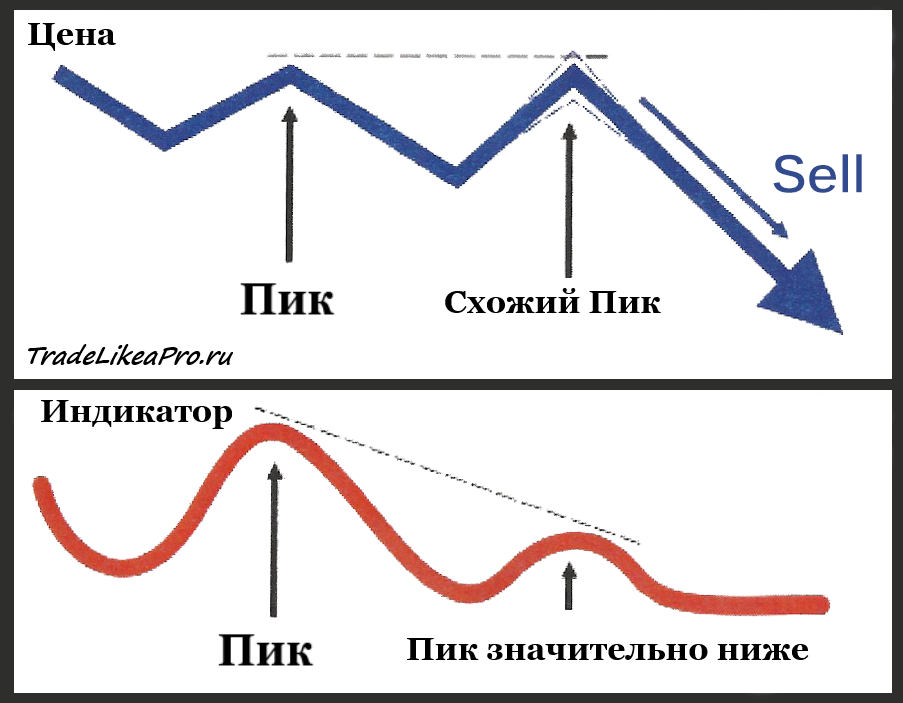
The dotted lines help you determine whether the second high is above or below the first.
The highs on the price chart are located at approximately the same level, resembling a double top. The indicator, however, shows a significantly lower second high.
This situation can also be approached from another side: without thinking about extended divergence, you can see that the price chart forms a double top (or a double bottom), while the indicator does not try to form a market-like double top (or double bottom). It looks as if the indicator simply stopped trying to copy the price movement.
Extended Bullish Divergence:
In order to identify an extended bullish divergence, we must look at the lows, or bottoms, of the price chart and the indicator. Extended bullish divergence is usually identified at the lows of a large move. The market forms a kind of double bottom, but it is important to note the fact that the double bottom does not necessarily have to be classic: the second low may be slightly higher or lower than the first. Despite the fact that the lows on the price chart are located at approximately the same level, the indicator will show a significantly higher second low. The indicator does NOT DRAW a double bottom similar to the chart of the market movement. The relationship between the price chart and the indicator will seem quite unusual... extended.
Extended bullish divergence
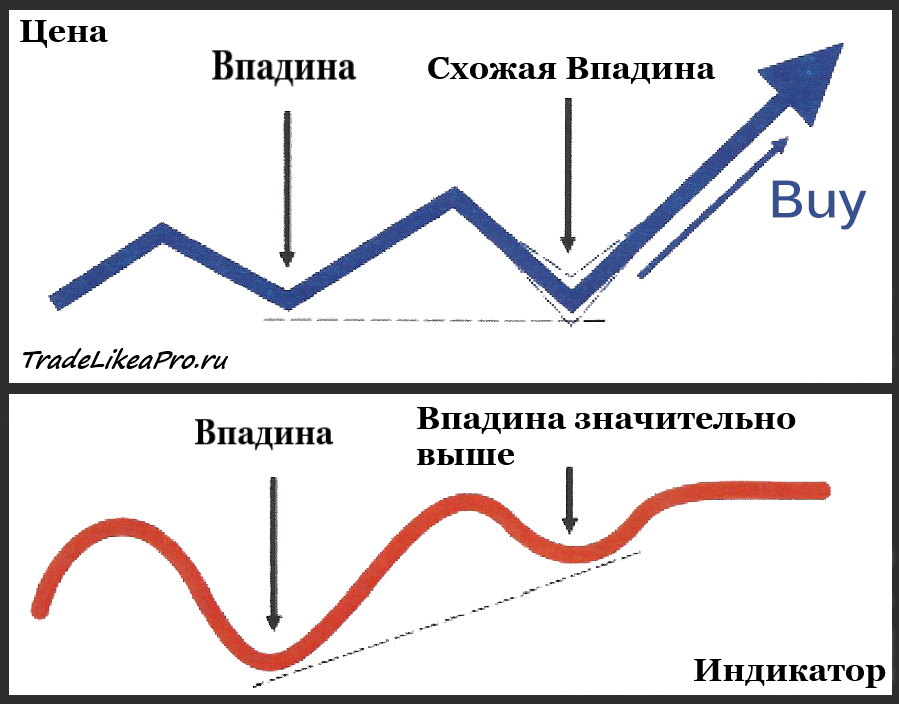
The dashed lines help you determine whether the second low is above or below the first.
The lows on the price chart are located at approximately the same level, resembling a double bottom. The indicator, however, shows a significantly higher second low.
Conclusion
Divergence in forex is a constant phenomenon and is one of the most powerful elements of technical analysis. However, seeing divergence on a live chart is not easy. Experience can help you with this.
Naturally, you should not rely on divergence alone when opening a position in forex. You should take into account the readings of other indicators, chart patterns, support / resistance levels and Price Action signals.
Next time you use oscillators, do not forget about divergence, it is really important.
Best regards, Pavel TradeLikeaPro.ru