
Everything About Japanese Candlesticks
 Today, Japanese candlesticks are the de facto standard for most trading platforms and monitoring systems. They earned such popularity thanks to their informativeness and the simplicity of presenting information about market trading. This is a truly advanced tool for forecasting market trends, all the advantages of which Western traders were able to appreciate only at the beginning of the last century. We, meanwhile, are allowed to use all the benefits of the broad Japanese heritage absolutely free of charge. Japanese candlesticks are today's topic.
A Brief Overview

The roots of Japanese candlesticks, as you might guess, come from Japan. Japanese traders began using Technical Analysis back in the 17th century, almost from the very birth of exchange trading. The rice merchants of that time managed to notice the high potential in the newly invented way of depicting price dynamics. At the same time, Homma Munehisa, who is considered the original inventor of the candlestick chart as such, made a considerable contribution to the popularization of Japanese candlesticks.
And indeed, the candlestick chart has some obvious advantages over the traditional line and bar charts used at that time by Western traders. This continued right up until the nineties of the last century, when the materials of Steve Nison on the method of chart analysis of financial markets based on Japanese candlesticks were released. He also introduced the Western world to dozens of ready-made candlestick formations, which in themselves are already a signal to act. These include patterns such as the “Evening Star,” “Morning Star,” “Triple Strike,” “Three Crows,” and many others.
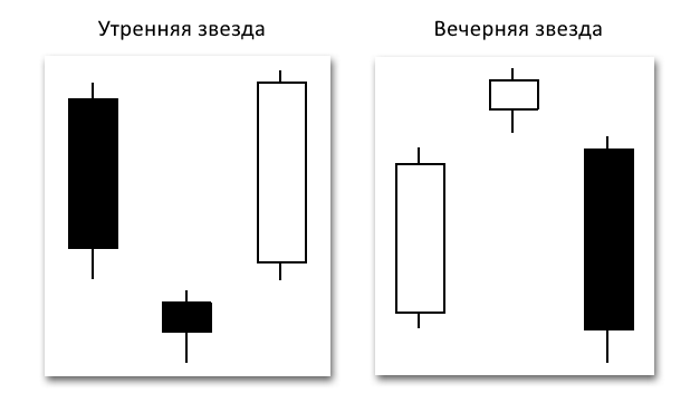 This topic was covered in greatest detail in Gregory Morris's book “Japanese Candlesticks,” where a substantial part of the material is devoted to the practical use of candlestick charts.
Unlike the traditional line chart, in one element, a candlestick, we get as many as four indicators instead of one. The visual clarity of the candlestick, in turn, allows us to identify complex chart patterns on the graph almost instantly. This significantly increases the informativeness of the chart and makes it possible to conduct comprehensive market analysis.
The nature of the candlestick helps in understanding the psychology of traders, which is an important aspect of candlestick analysis. The candlestick chart made it possible to identify standard patterns of trader behavior and, accordingly, predict their subsequent decisions. As a result, at first glance primitive analysis allowed its creator to multiply his capital significantly.
Candle Formation
Each candlestick on the chart denotes the range of price movement over a certain period, also called a timeframe. The candle itself consists of a body, usually white or black, and two shadows (tails), above and below the body. The shadow of the candlestick indicates the maximum and minimum price over the period.
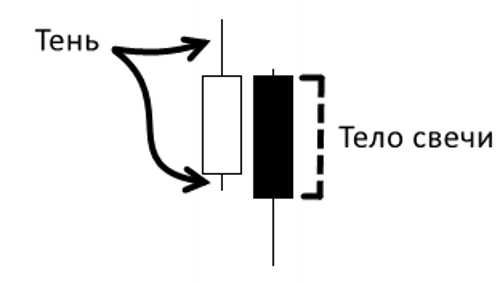
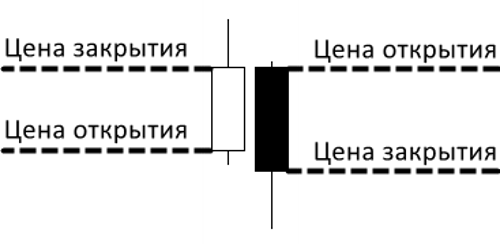
A bullish candlestick (usually white) means the closing price of the period was above the opening price, in other words, the price rose. A bearish candlestick (usually black) means the closing price was below the opening price, that is, the price fell.
In some cases, the body of the candlestick may be absent if the opening price equals the closing price, that is, by the end of the period the price did not change. Such a candle is called a Doji.

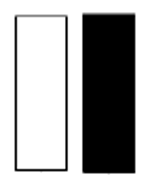
Another extreme is when a candlestick is missing one or both shadows. This happens when the opening and closing prices of the period are also its maximum and minimum values.
Trader Psychology

From the appearance of a single candlestick we can determine the behavior of buyers and sellers and, accordingly, assess their further intentions. There are many candlestick patterns, the identification of which is an important component of technical analysis, but since everything lies on the surface, you can learn to “read” candlesticks even without having any idea of traditional candlestick models.
The size of the candlestick is the first parameter worth paying attention to. The larger the relative size of the candlestick body, the stronger the pressure of buyers or sellers. A candlestick with a large white body speaks of the predominance of bullish sentiment. This means that by the end of the period buyers were prevailing. A dark candlestick speaks of the predominance of sellers.
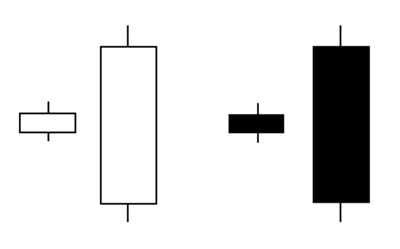
Short candlesticks, on the contrary, indicate the formation of consolidation or stagnation. This usually happens when the number of buyers and sellers is approximately equal and the market has not yet decided in which direction it should move next.
Thus, the relative positioning of the candlestick plays a major role. A large white candlestick after a prolonged downward trend may indicate a change in the direction of the main trend. If such a candlestick breaks a resistance level, this may indicate the consolidation of a new price level.
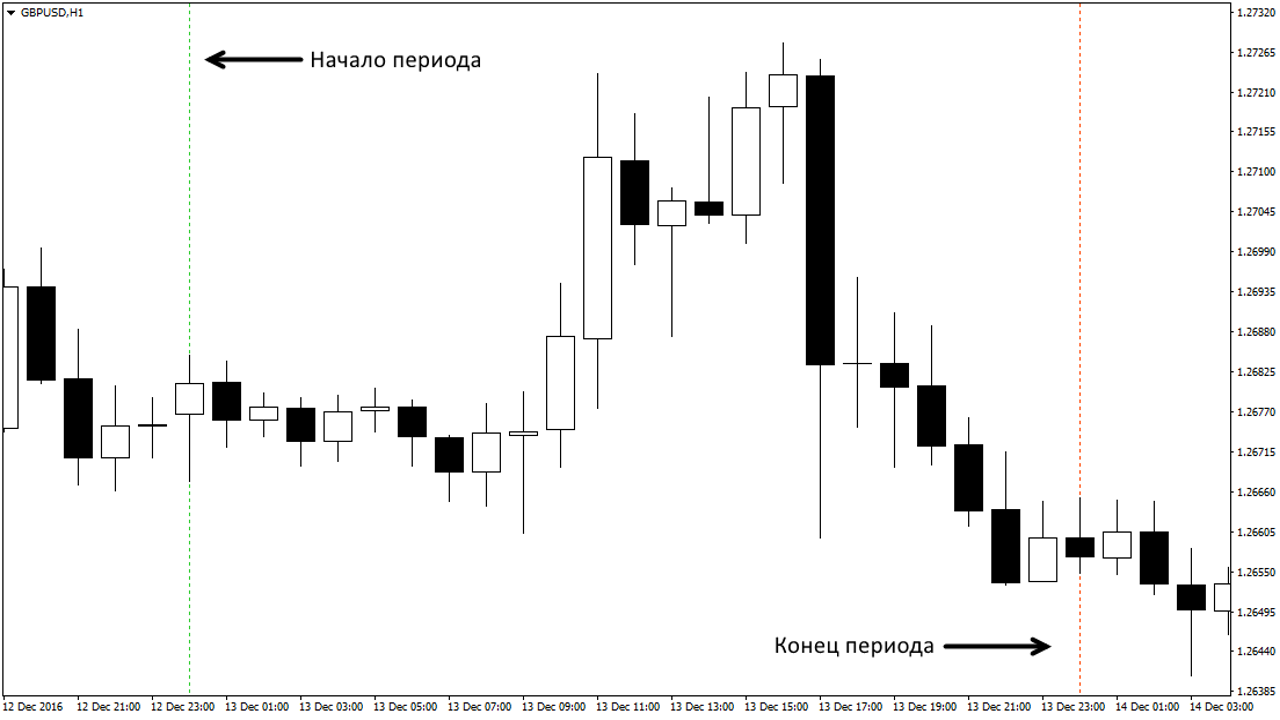
At the same time, we cannot say with certainty what happened during the formation of the candlestick. Price movement from the opening point to the closing point can be either straight or zigzagging. Usually, to determine the nature of the movement, it is enough to go down one or two timeframes lower, if possible.
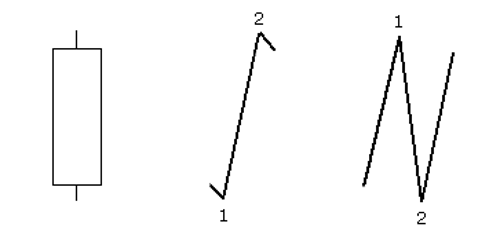
A large tail at one end usually indicates a change from bullish sentiment to bearish sentiment (and vice versa) during the formation of the candlestick. A candlestick of this shape is commonly called a pin bar, and it forms at extremes, as a rule, foreshadowing a change in short-term direction or the continuation of the trend after a correction. Such candlesticks can often be observed near important key levels that the price was unable to break through, having pressed a large tail toward the level.
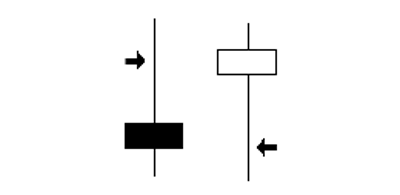
As mentioned earlier, to track price movement inside a candlestick, it is enough to go down to a lower timeframe. For example, if a pin bar formed on the daily chart, then to see the process of candlestick formation, it is enough to go down to the hourly timeframe.
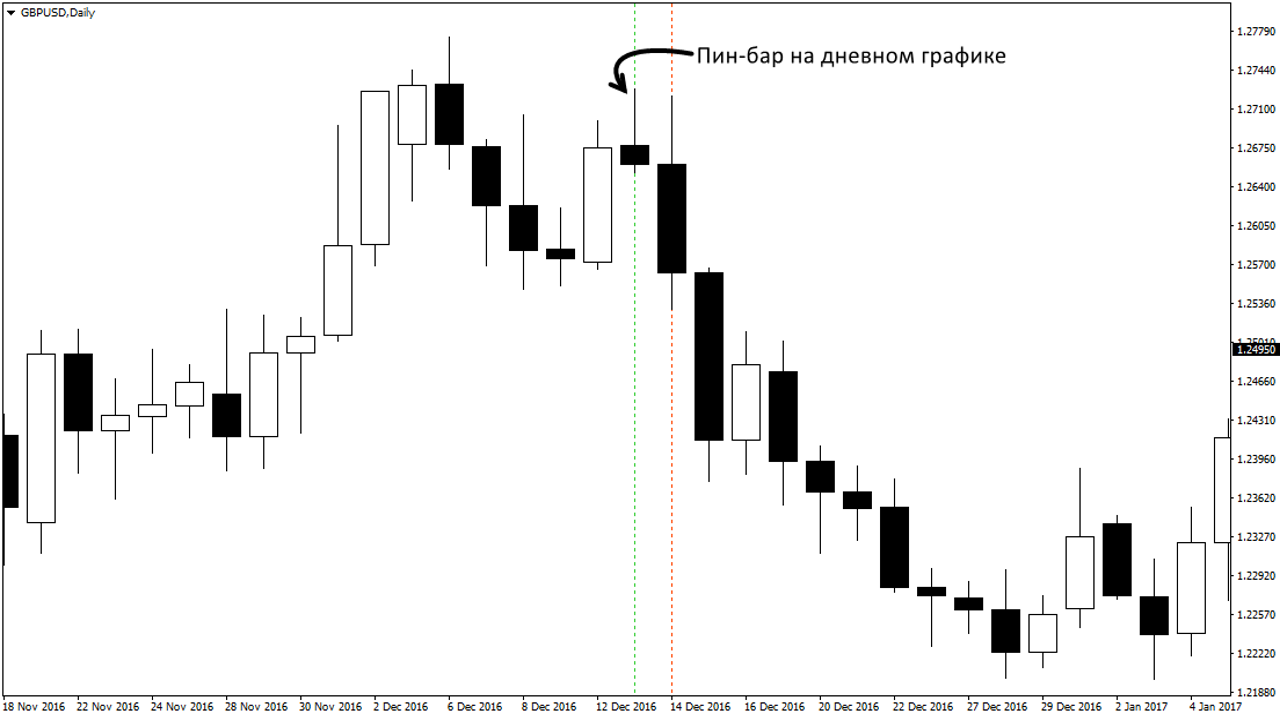 On the hourly chart, the movement typical of a pin bar is visible. The price first rises, and from about the middle of the period it begins to fall, closing near the opening level.
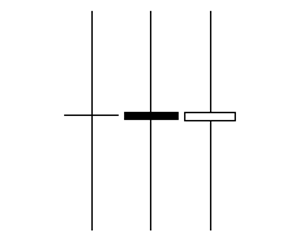
 Sometimes the struggle between buyers and sellers reaches its climax, as a result of which we observe on the chart a Doji with very large shadows. This indicates a high level of indecision in the market, when trading is conducted very actively, but without any visible result.
Candlestick Sentiment
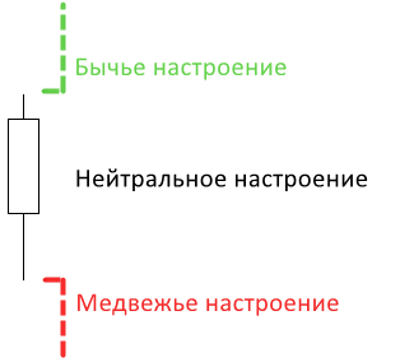
For a more accurate determination of the nature of a candlestick, Price Action expert Lance Beggs introduced into use such a concept as candlestick “sentiment.” This approach has some advantages over the traditional classification of candlesticks, since it is not guided solely by the color of the candlestick, but takes into account the nature of price movement. There can be 3 types of sentiment in total: bullish, bearish, and neutral. At the same time, each of the sentiments additionally has 3 gradations (levels): high, medium, and low.
If the candlestick closed above the previous maximum, it has bullish sentiment. Conversely, if the closing price of the period turned out to be below the previous minimum, the candlestick has bearish sentiment. A candlestick of neutral sentiment forms when the closing price is within the range of the previous candlestick. That is, the close of the current candlestick should fall into one of 3 zones relative to the previous period.
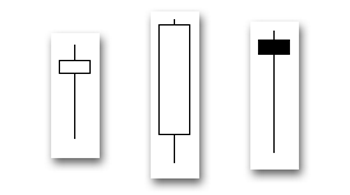
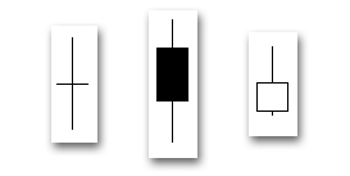
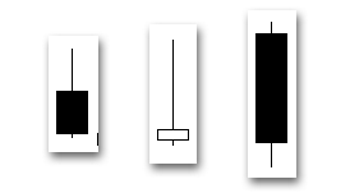
Next, we can determine the candle's sentiment level. To do this, it is necessary to identify the candle's closing area: a high close, a medium close, or a low close. To determine the level, the current candle must be divided into three zones. The level of its sentiment will depend on which part of the range the candle closed in.
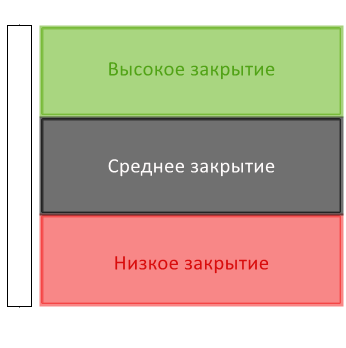
Examples of candles with a high close are presented here, where the period close falls in the upper third of the range.
Examples of candles with a medium close, where the period close falls in the middle third of the entire range.
And also examples of candles with a low close, where the candle closes in the lower third.
Conclusion

Japanese candlesticks did not gain their popularity for no reason. This once again proves that it is not the information itself that matters, but the way it is presented. Even today, after several centuries, the candlestick chart does not lose its effectiveness in determining traders' intentions. In essence, the first thing every beginner in the market should do is learn to "read" candles. Without this skill, no trading will be complete and successful.
Respectfully, Alexey Vergunov
TradeLikeaPro.ru