
Elliott Waves: Market Magic or Simple Mathematics?
After the first money blown as a result of trading chart patterns, a novice trader begins looking for something more suitable. The second or third system that practically every beginner tries in the process of searching for a new Holy Grail is the "Elliott wave principle," or simply Elliott Waves.
The text below explains in detail why Elliott Waves are not "mysticism" or "magic," as they are sometimes portrayed, but merely a graphical description of common models of the long-term dynamics of various socio-economic processes, such as statistical indicators, economic indicators, prices of various assets, and so on.
Elements of mysticism arise among "market gurus" selling sacred knowledge to ever newer generations of traders. By the way, Ralph Nelson Elliott titled his book "Nature's Law. The Secret of the Universe." Such a title immediately attracts those who are not indifferent to mysticism.
In the text below, we will try to present in simple language the mathematical foundations of "Elliott theory" and provide several basic formulas that will show the principle of wave formation and help write advisors that use wave principles.
What Elliott Waves are, in not very simple words
The key idea of Elliott Wave Analysis (Elliott Wave Analysis, hereinafter EWA) is extremely simple: the development of a trend in most processes does not go along a perfectly straight line, but in waves.
The main and most commonly used structural scheme is five phases (or "waves") of an impulse in the direction of the main trend and then a three-wave correction against it. Impulse waves are traditionally numbered 1–5, while corrective waves are denoted by the letters A–B–C.
It is from this scheme that a beginner plunges into the depths of Elliott Waves.
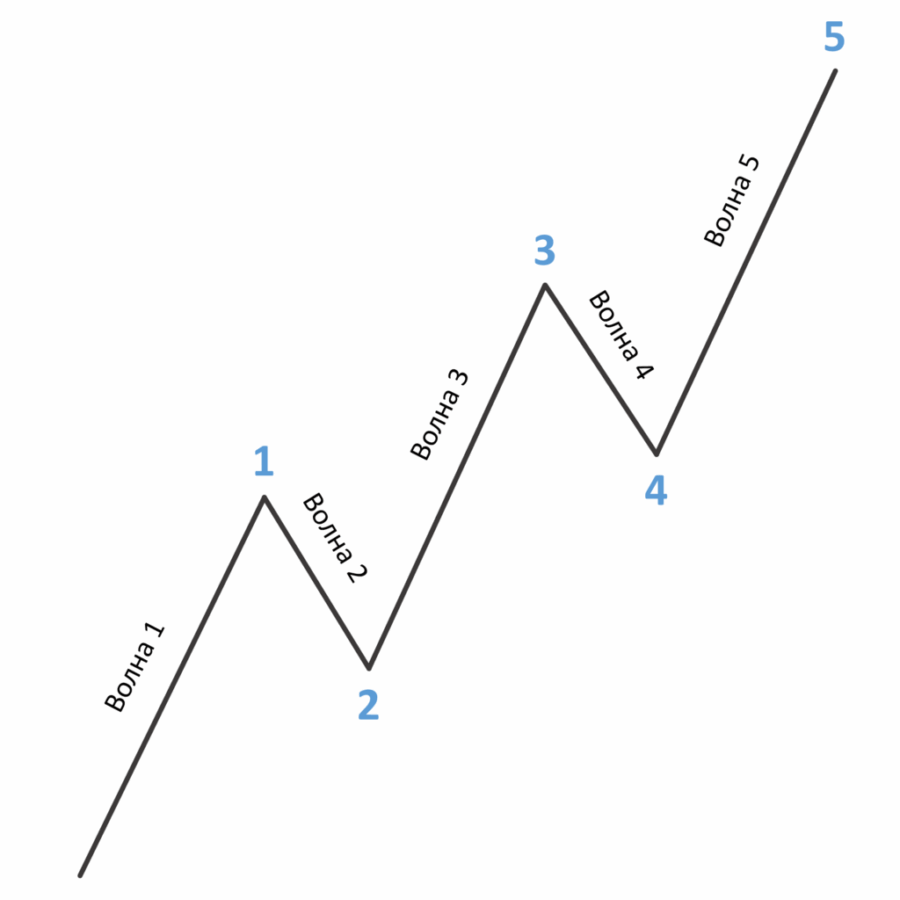
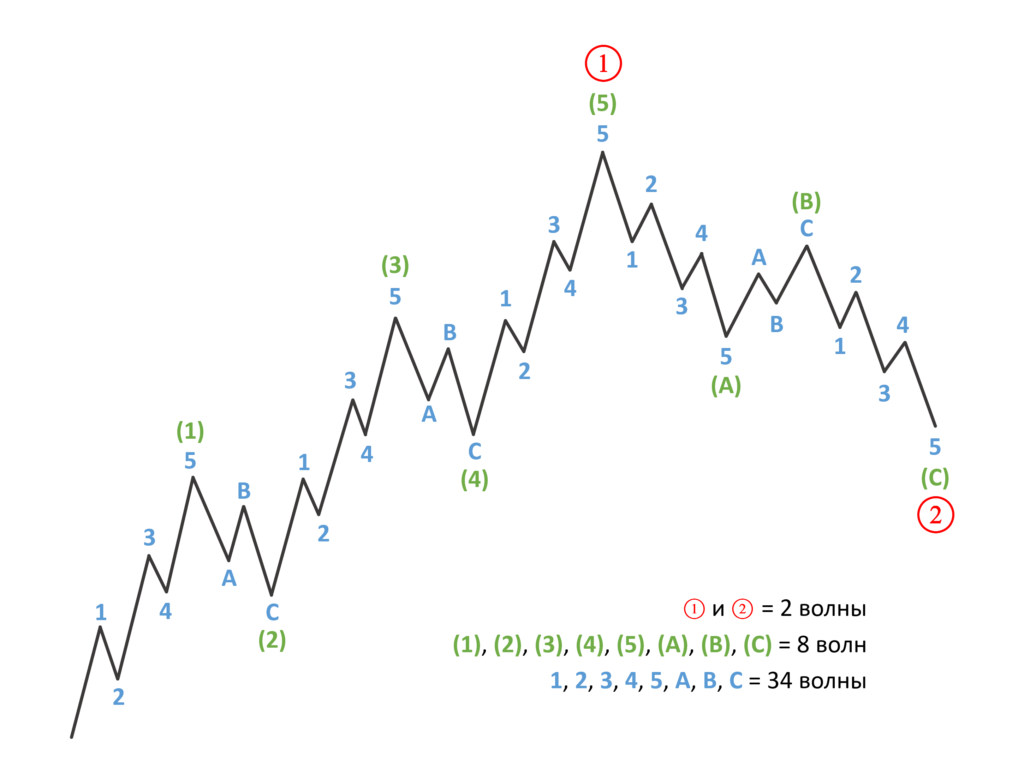
One of the central provisions of EWA is self-similarity: each of the eight waves of a full cycle, upon detailed examination, breaks down into subwaves of either three or five elements. In particular, waves 1, 3, 5, A, and C are often structured as five-wave moves, while waves 2, 4, and B are three-wave moves.
This composition repeats across different time scales: the same cycle can be part of a larger wave and at the same time contain smaller waves within itself.
Each of the eight waves of a full cycle, upon detailed examination, represents a set of either three or five waves of the next, smaller level.
As a rule (though not always), waves 1, 3, 5, A, and C are five-wave, while waves 2, 4, and B are three-wave.
In turn, the full "impulse-correction" cycle can be regarded as waves I and II of a higher scale. In the diagram shown below, the full cycle consists of two waves and of the largest level, or eight waves (1)-(2)-(3)-(4)-(5)-(a)-(b)-(c) of the medium scale. If these medium-scale waves are also decomposed into smaller-level waves, their total number will reach 34 (21 waves in the main impulse phase and 13 in the correction phase).
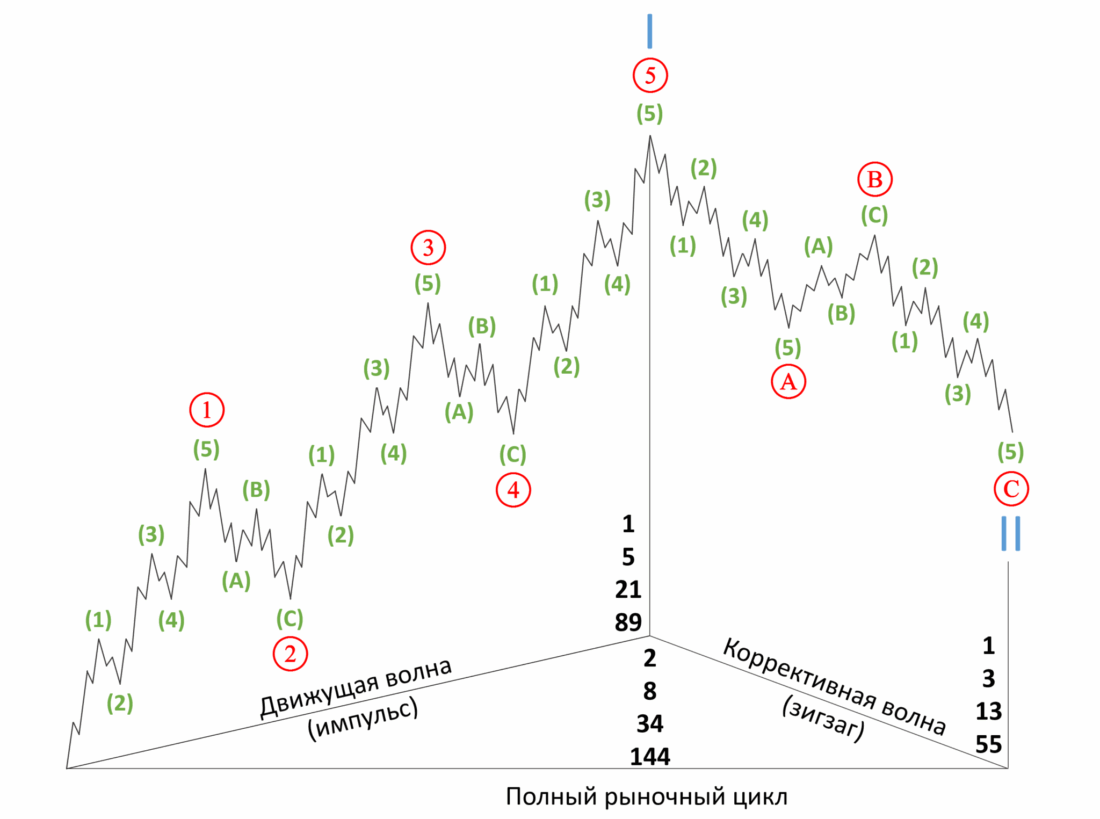
Theoretically, this process of subdivision can be continued to any depth.
For example, the next stage will yield 144 waves of an even smaller level (89 in the impulse phase and 55 in the corrective phase). It is easy to notice that all these values (1, 1, 2, 3, 5, 8, 13, 21, 34, 55, 89, 144) are numbers of the Fibonacci sequence well known in mathematics, where the first two elements are equal to one and each subsequent one is the sum of the previous two.
Fibonacci Numbers
As a result of analyzing a full market cycle, the famous Fibonacci numbers (1, 2, 3, 5, 8, 13, 21, 34...) appear.

If you count all the waves of different scales, their number falls exactly into this sequence. For lovers of mysticism this is a "miracle," but it is simply a mathematical consequence of such a wave structure.
But in fact everything is very simple. With repeated subdivision, the number of subwave elements in the impulse and correction phases can correspond to elements of the Fibonacci sequence.
The presence of Fibonacci numbers in the structure does not make Elliott's method mystical: it is a simple consequence of combinatorics and self-similarity when oscillations are superimposed.
Where the 5+3 structure comes from: a simple model
Imagine that price is the result of adding together several processes:
- The overall trend (a slow rise, like a snail crawling upward).
- Long-term oscillations (big and slow economic "swings").
- Medium-term oscillations (smaller and faster swings).
- Short-term oscillations (fine and frequent ripples from news and market sentiment).
To understand the reason for the appearance of the 5+3 structure, it is enough to consider an idealized model of a series as the sum of a directed trend and several oscillatory components of different frequencies and amplitudes.
If you plot a growth line + one large sine wave, you will get the simplest wave.
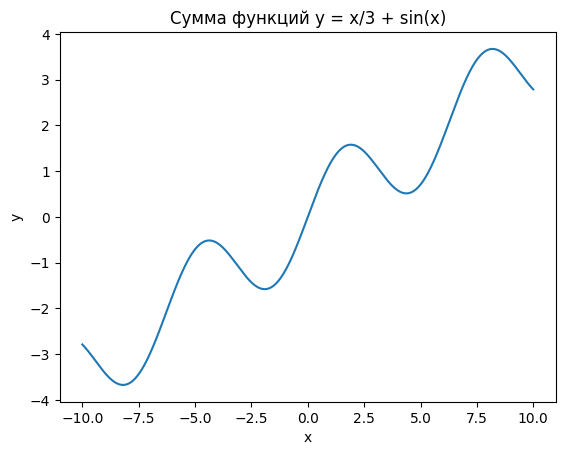
Let us begin with the simplest model: the sum of the linear function y = x/3 and the sine wave y = sin(x).
The resulting curve generally shows growth, but has a wave-like character.
Let us continue the modeling, now taking into account medium-term oscillations as well.
It is important to remember the statistical rule: for a series of independent identically distributed random variables, the variance of the sum of N variables equals the variance of one variable multiplied by N. Consequently, the standard deviation (the square root of the variance), which is what characterizes the amplitude of oscillations, is proportional to the square root of N.
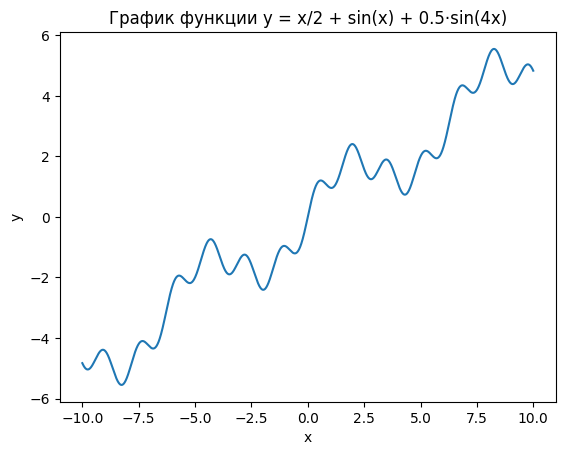
This means that oscillations, for example, of four times lower frequency, will on average have half the amplitude. Therefore, let us build the graph of the function: y = x/2 + sin(x) + 0.5 * sin(4x).
Before us is the basic configuration of the EWA cycle: a five-wave impulse followed by a three-wave correction, and so on.
It is easy to assume that taking short-term oscillations into account, in addition to long- and medium-term ones, will give a similar result. Let us add one more oscillatory term with lower frequency to the previous function: 0.25 * sin(16x).
A recognizable structure?
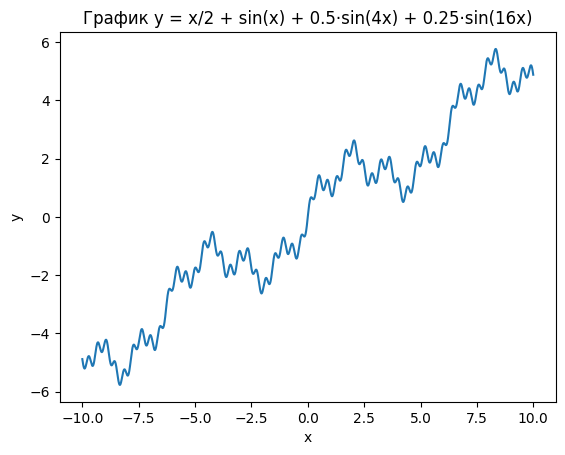
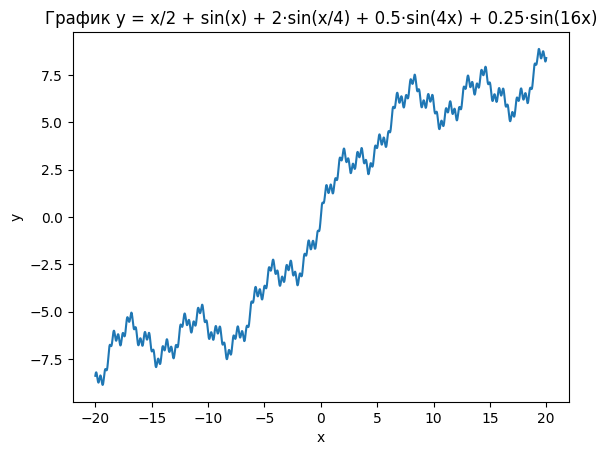
As expected, we obtained a more detailed wave structure characteristic of EWA, in which waves of three different degrees are combined. One can move in the opposite direction as well, that is, toward a larger scale: let us add the term 2 * sin(x/4) to the series from the last graph and slightly expand the time horizon.
What the essence of Elliott's "Nature's Law" is
As we can see, the general pattern of the basic EWA structure, an impulse of five waves and a correction of three, is preserved at all levels: from the largest to the smallest.
This is precisely the picture that Elliott empirically described: the superposition of a trend and many oscillations of different scales. In the real market, the amplitude and length of these "swings" constantly change, so the ideal picture is rare, complex corrections and exceptions appear. But the foundation remains the same.
It turns out that the basic EWA structure takes exactly this form (5 impulse waves and 3 correction waves) for the simple reason that the observed processes are a superposition of a linear trend and several oscillatory processes with different amplitudes and frequencies.
Of course, in practice, as shown above, each type of oscillation is characterized by variable amplitude and frequency, so the real picture described by EWA is much more complex than the idealized model.
Corrections Can Also Be Calculated
However, this variability of parameters only gives rise to more complex and less aesthetically "correct" structures, but does not cancel the basic principles, which for the most part retain their force.
There are simply numerous exceptions and complications: so-called "fifth-wave failures," various complex and irregular corrections, as well as diagonal triangles and other composite components of EWA.
For example, by manipulating the variable amplitude of long-term and medium-term oscillations in the model, one can obtain an ascending narrowing diagonal triangle or "wedge," often observed in real markets.
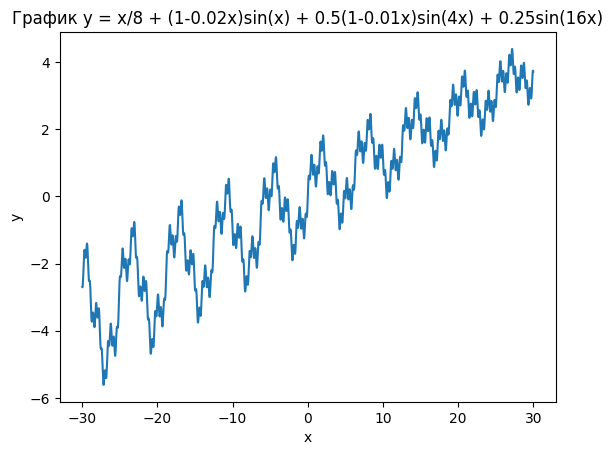
You can play with the numbers a bit more and get the following picture, which is much closer to what we often see in the markets.
And, of course, it is worth noting that in the picture one can find both a double bottom and a head and shoulders, and much more besides.
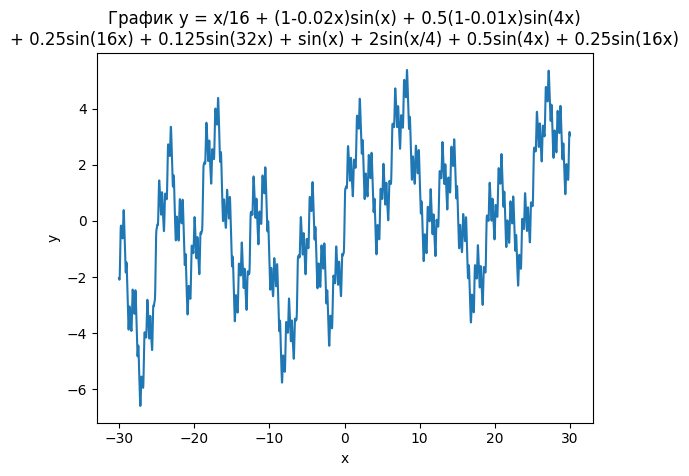
In the picture above we see a very rich non-stationary signal: a large wave → nested oscillations → fine "turbulence," with a smooth change in amplitude and a slight drift.
In effect, we have built a model of a deterministic analogue of noise with a hierarchy of scales, close to systems with an energy cascade, which include financial markets.
Conclusion
Elliott Wave Analysis is not an occult doctrine, but a description of the geometry that naturally arises in any complex process where there is an overall direction of movement (trend) and several cyclic oscillations superimposed on one another.
In other words, EWA is the superposition of a trend and many oscillations of different scales, and this is precisely what Elliott described empirically. In the real market, the amplitude and length of these "swings" are constantly changing, so the ideal picture is rare, complex corrections and exceptions appear. But the foundation remains the same.
If an impulse (trend) is organized oscillations (in the mathematical sense) and can be described by relatively simple formulas, then balance (consolidation) is a transition to a complex non-stationary structure.
Modern computing power makes it possible to iterate through many more variants of the development of the EWA structure, especially after training on tens of millions of actual implementations of the "Elliott principle" in real markets.
Any more or less competent programmer can easily transfer this "esoterica" onto a chart in MT or TradingView, where more than 100 Elliott Wave scripts have already been posted. But all or almost all of these scripts are based on somewhat different principles, which greatly reduces their predictive ability.
By the way, in the early 2000s there was a special program that "predicted" further movement based on current price behavior. I remember how it "drew" targets and the structure of how they would be reached. Now I understand that the predictive mechanism there was rather weak: the algorithm simply did not have time to iterate through variants of structural development within scalping. But on a higher TF, the program made it possible to assess the market quite well from the point of view of wave theory.
Respectfully,
Ivan Rusin