
The Elliott Wave Indicator That Can Build a 5-Wave Structure

Elliott Wave Theory is based on the idea that market movements reflect the collective psychology of participants and therefore form repeating wave sequences: five waves in the direction of the trend (impulse) and three waves against the trend (correction).
Despite the subjectivity of the method, or perhaps precisely because of it, almost all traders go through a stage of fascination with Elliott waves. And where there is demand - interest in the theory - supply appears as well - indicators.
The absolute majority of Elliott Wave indicators do not actually count the wave structure as such, but ZigZags - corrections. This is much easier to implement technically, but from the point of view of the theory - it is incorrect. At the same time, for some mystical reason, almost no script can consistently and reliably build a 5-wave impulse.
In 2023, the Elliott Wave indicator appeared on TradingView and immediately made it into the editors' pick selection. This is the first and almost the only free indicator that builds the entire wave structure online: 5 impulse waves and 3 corrective waves.
A Very Brief Overview of Elliott Wave Theory
Elliott Wave Theory was developed by the American accountant Ralph Nelson Elliott in the 1930s. He noticed that prices in financial markets do not move chaotically, but in repeating fractal cycles that reflect crowd psychology: optimism → euphoria → fear → panic. The basic structure consists of an impulse phase (5 waves with the trend) and a corrective phase (3 waves against the trend).
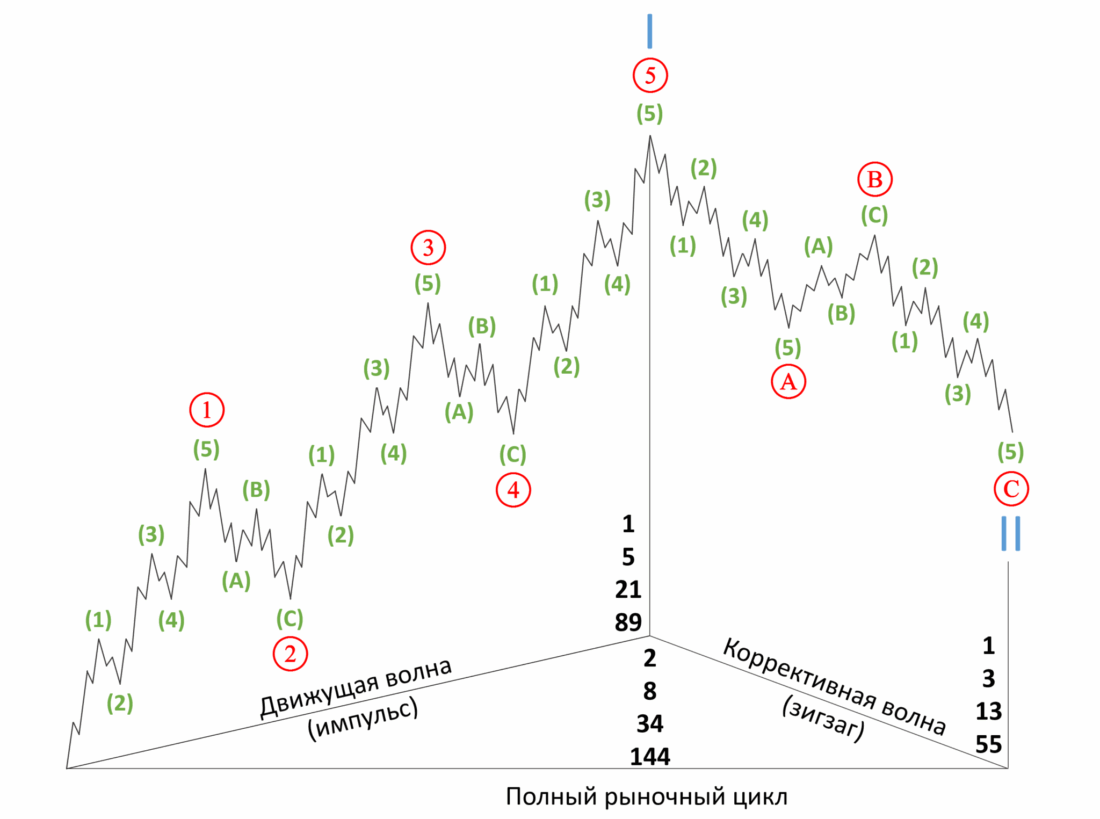
Impulse waves are numbered 1-2-3-4-5: waves 1, 3, and 5 move in the direction of the main trend, while 2 and 4 are intermediate corrections. Corrective waves are labeled A-B-C. Waves are fractal - each larger wave consists of smaller ones.
Basic rules (mandatory for pattern validity) are as follows:
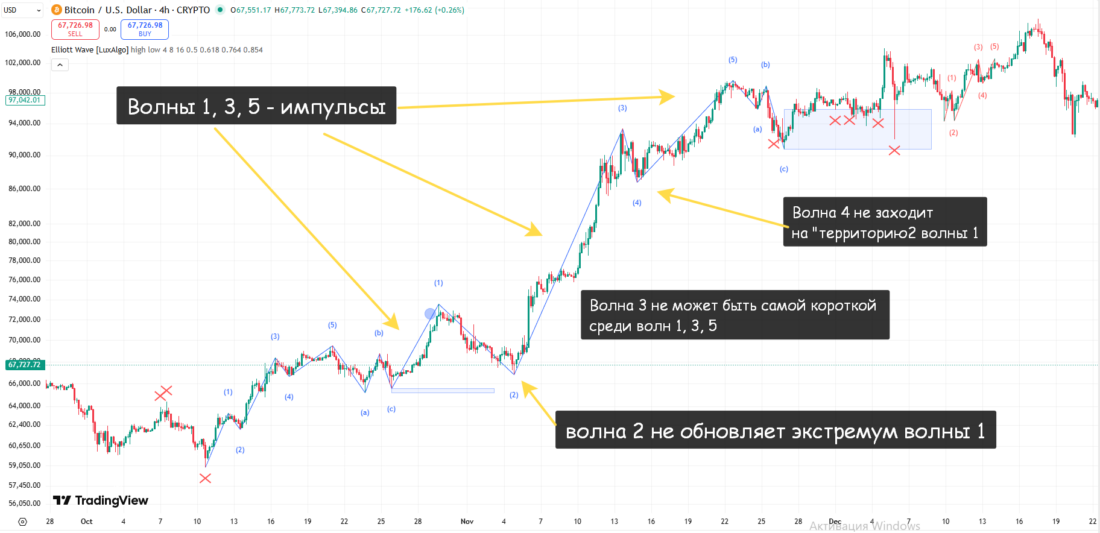
- Wave 2 never retraces below the start of wave 1.
- Wave 3 cannot be the shortest of the impulse waves (it is usually the longest).
- Wave 4 does not enter the price territory of wave 1 (no overlap).
- Wave 5 often extends or looks truncated.
Fibonacci retracements: wave 2 - 50–61,8% of wave 1, wave 4 - 38,2–50% of wave 3.
Fibonacci extensions: wave 3 - 161,8% of wave 1; wave 5 - 61,8% or 100% of waves 1–3; an ABC correction often ends at 61,8–100% of the impulse length.
Trading by Elliott waves is the forecasting of reversals and trend continuation.
A typical entry strategy: buy/sell after the correction is complete (the end of wave 2 or 4, or wave C in a correction) in the direction of the main trend. The stop-loss is placed beyond the extreme of the previous wave (below the start of wave 1 for a long). The take-profit is set by Fibonacci extensions of the next wave (161,8% or 261,8%).
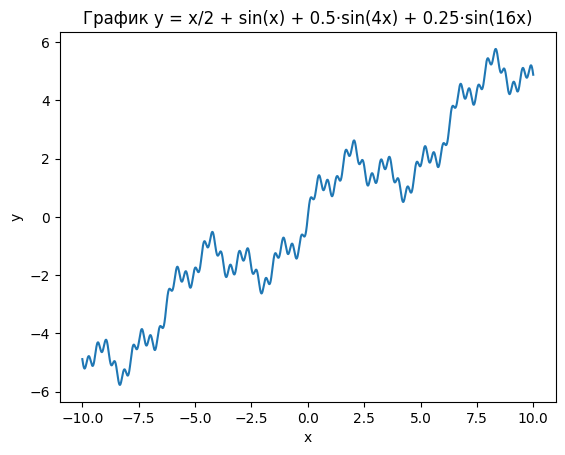
The mathematical analysis of the Elliott Wave principle is relatively simple, which we wrote about not so long ago. In fact, we are talking about applying a trend in the mathematical sense to a set of oscillations of different scales. In the image below is the formula of the classic five-wave structure:
How Can the Wave Counting Process Be Automated?
You can choose a dedicated terminal or use scripts / indicators.
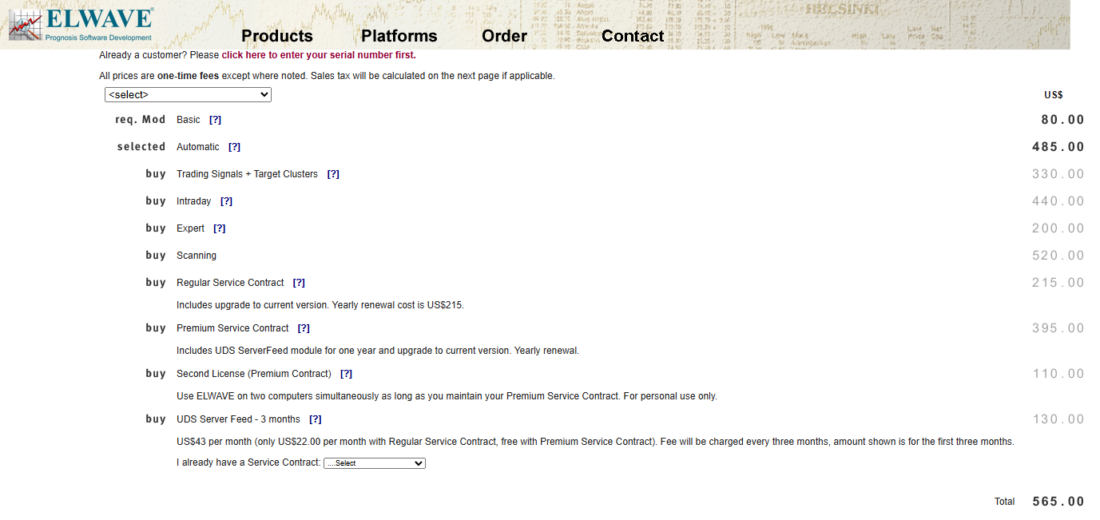
In the ELWAVE terminal, a scheme is partially implemented that takes into account the mathematical foundation of Elliott waves specifically. You can read about the terminal on our forum, where you can also find links to trial versions.
If you do not want to bother with settings and integrations, you can buy the terminal from the developer. Prices start at $80 for a version where you can "draw" waves yourself and the terminal will "correct" them. If you want to see how the program draws a wave with a projection, you should prepare for an investment starting at $565. And so on down the list.
If you do not want to install the ELWAVE terminal, you can try your luck with scripts for MT 4/5 or indicators on TradingView.
Mysticism: Scripts Cannot See a 5-Wave Structure

Unfortunately, the absolute majority of attempts to create an Elliott Wave indicator end with yet another version of a script that "finds" zigzags on the chart. Searching for and finding zigzags is not bad, but this is by no means a full implementation of the Elliott Wave principle.
Until recently, at least 98% of zig-zag scripts (my tongue does not turn to call them Elliott Wave indicators) did a decent job of finding A-B-C corrective structures, but "hung" on the 5-wave impulse structure.
It can only be called mysticism that zigzag scripts often fail on marking a five-wave pattern. They simply "do not see" it.
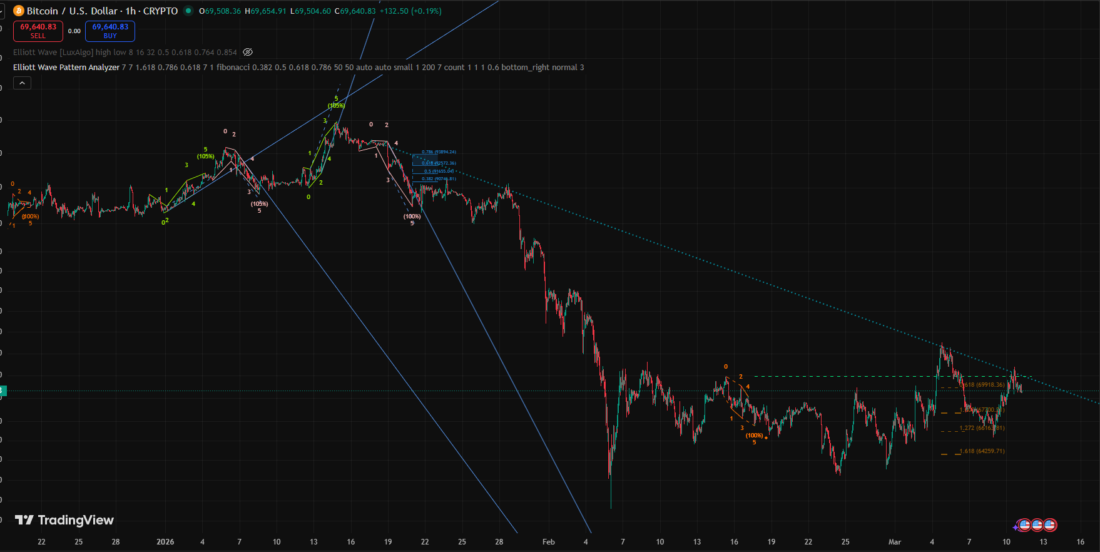
Here is an example of the Elliott Wave Pattern Analyzer script in action. It draws a five-wave pattern in a correction and does not see it in an impulse.
And here is an example of the Elliott Wave with Supertrend Exit - Strategy script in action. Again, the five-wave markup is missing, because of which the Supertrend indicator (the second part of the indicator) does not work, even though it is precisely the one that follows the trend rather than looking for a countertrend!!!
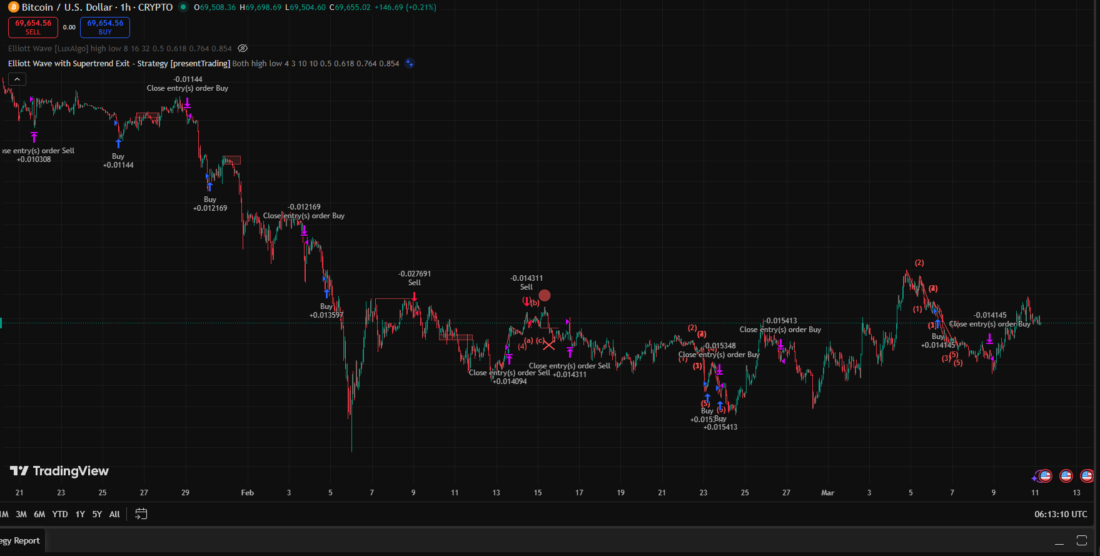
Thus, if you remove the material part but keep the logic, then the 5-wave structure can be described through an A-B-C sequence that meets the basic rules described a little above. For some reason, probably not all developers cope with this, likely not very difficult, task.
But in 2023, a team entered the scene that managed to do what far from everyone could do: draw 5-wave patterns quite reliably through the analysis of A-B-C structures.
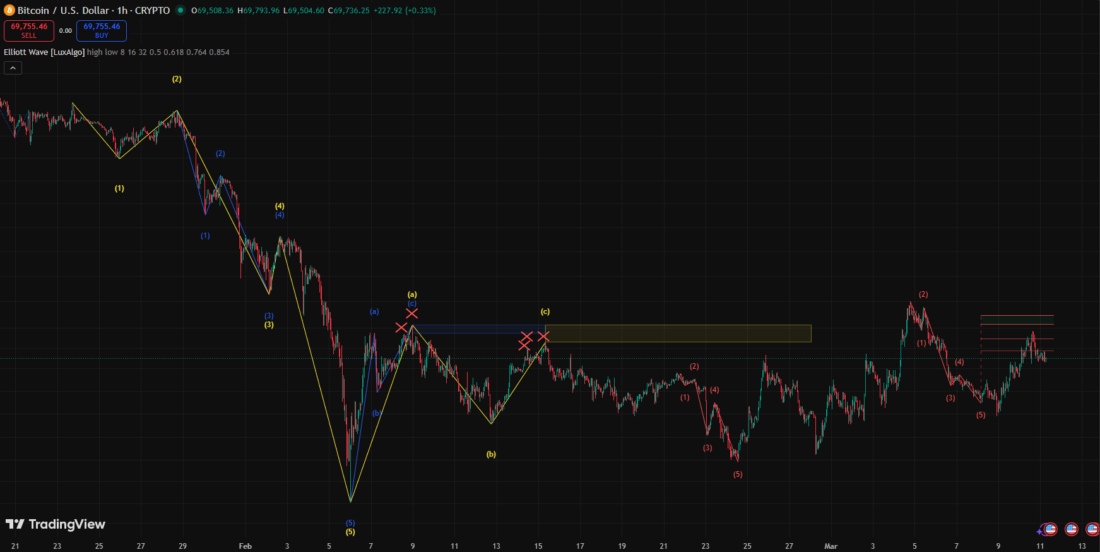
The Elliott Wave script on TradingView really "draws" a 5-wave structure, although sometimes with errors. The script handles fractality (wave nesting) quite well and is good at navigating corrections.
The same chart on the same segment. The Elliott Wave script managed to properly mark exactly the impulse!!!
In general, it is worth talking about it in more detail.
Elliott Wave [LuxAlgo] Indicator
The Elliott Wave indicator is one of the most popular tools for automating Elliott Wave analysis on TradingView. It solves the main problem of manual counting, subjectivity and delay, using advanced algorithms to search for wave structures in real time .
Publication date: March 6, 2023. Tag: Editors' Pick. Statistics: about 15,3K "boosts", more than 609 000 views. Publisher: LuxAlgo (1,23 million subscribers).
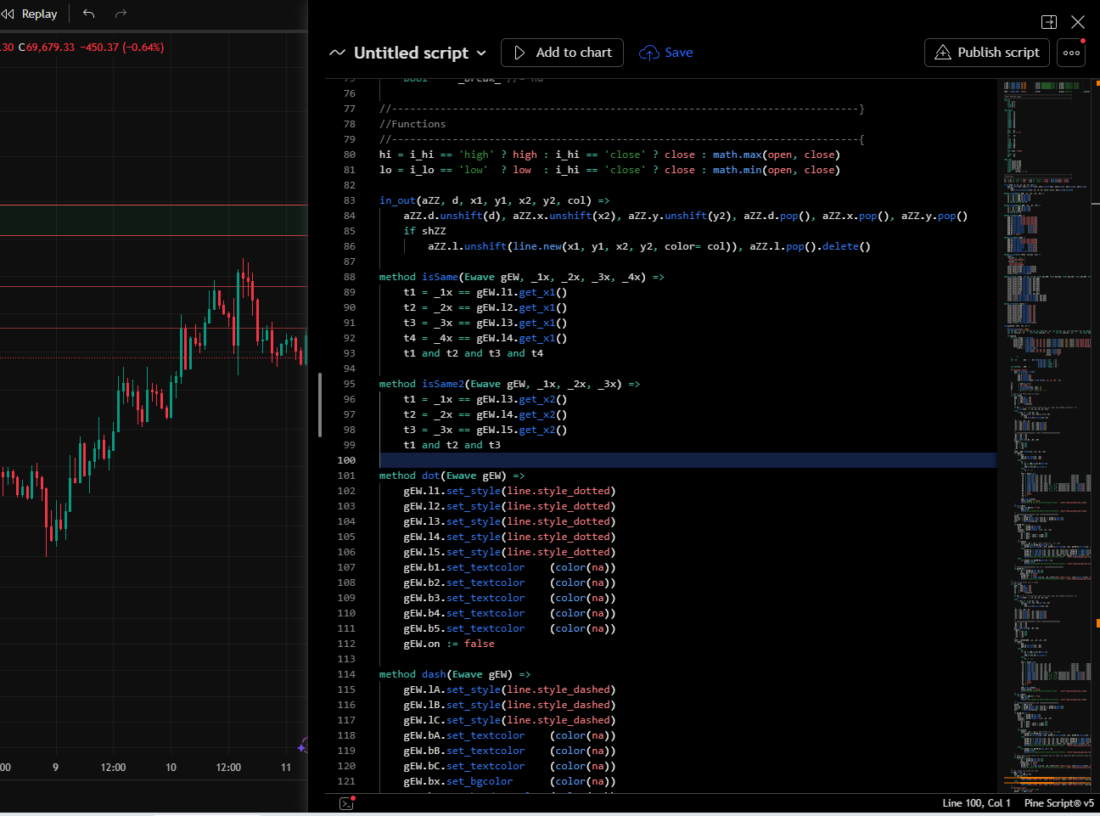
The script is open, which allows you to study/modify the code if desired.
The Elliott Wave indicator automatically finds Elliott impulse waves (EW) and corrective wave structures directly on the chart. The indicator displays the wave structure sequentially, which allows traders to track the evolution of an impulse or corrective wave.
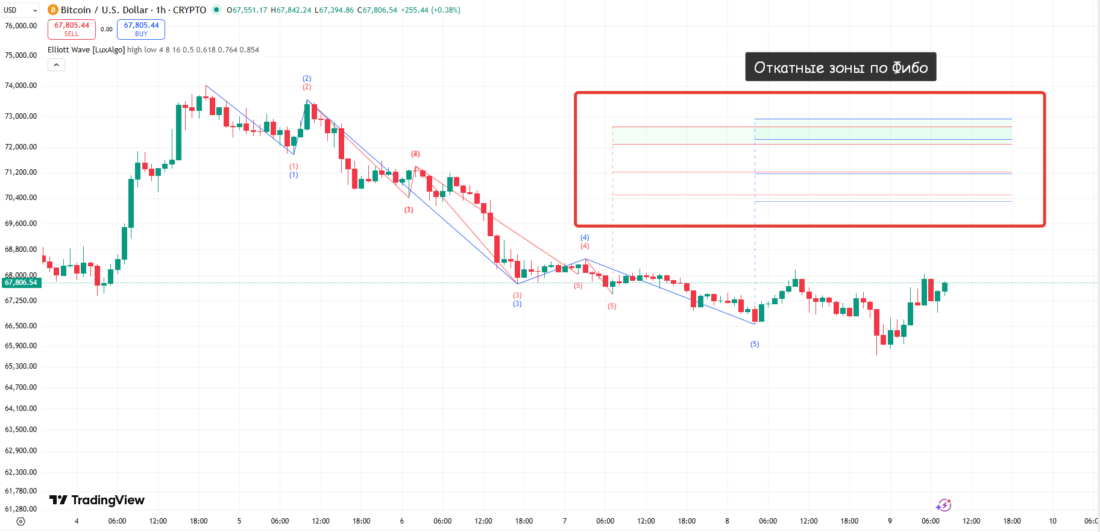
The indicator includes Fibonacci retracement levels built on the basis of detected impulse waves. You can configure alerts to be sent across a wide range of trigger conditions.
Indicator Settings
The indicator settings are very simple.
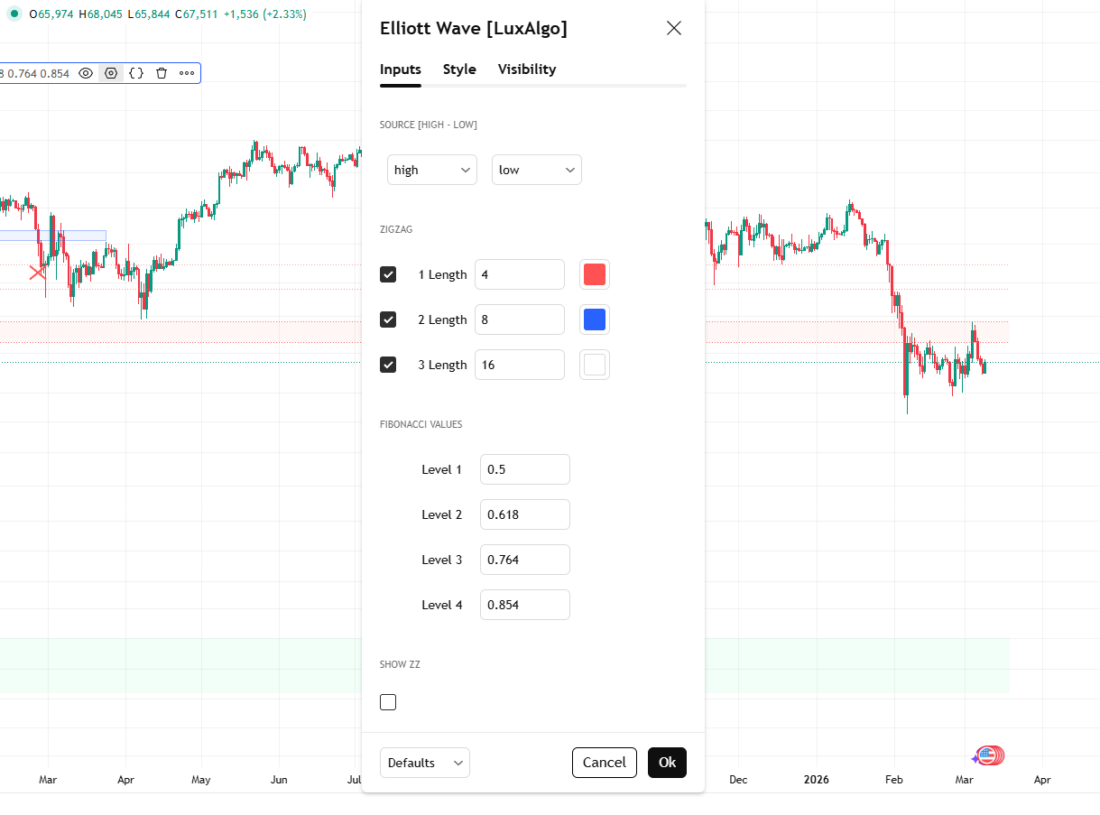
Source: possible values for highs/lows, for example, "high" -> "options high, close, maximum of open/close".
ZigZag: the source and length are used to check for the appearance of a new pivot point (Pivot Point). Default settings: 4, 8, 16. We recommend testing different variants on different timeframes in order to filter out market noise.
Fibo levels (Fibonacci Values): 4 adjustable values.
You can also enable / disable the ZigZag display in the settings.
Example of the logic: with source = high/low and length = 10, a new pivot high appears if the previous high is above the current one, and all 10 bars before the previous high are lower. These reference points form ZigZag lines, which are then used for pattern recognition.
Applying the Indicator
Basic principles of Elliott impulse detection in the script:
- Trend movement (motive/impulse) is divided into 5 waves (Waves 1 → 5).
- A corrective wave against the trend is divided into 3 waves (Waves A → C).
- Waves can be broken down into smaller-degree waves.
- Wave 2 cannot retrace beyond the start of Wave 1.
- Wave 4 must not overlap the price territory of Wave 1 (the "no overlap" rule for a standard impulse).
Search process: after a 5-wave motive pattern (1→5) is confirmed, Fibonacci lines are drawn to show potential bounce zones during the correction.
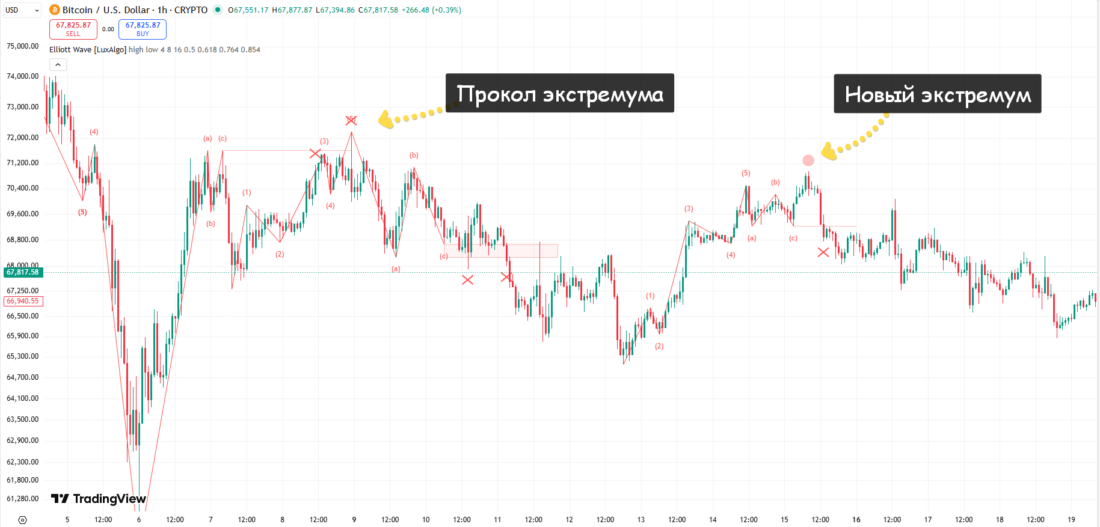
After a new high / low forms, a circle of the same color as the line is drawn.
If the pattern boundary is broken (the low or high of the box), a red cross appears.
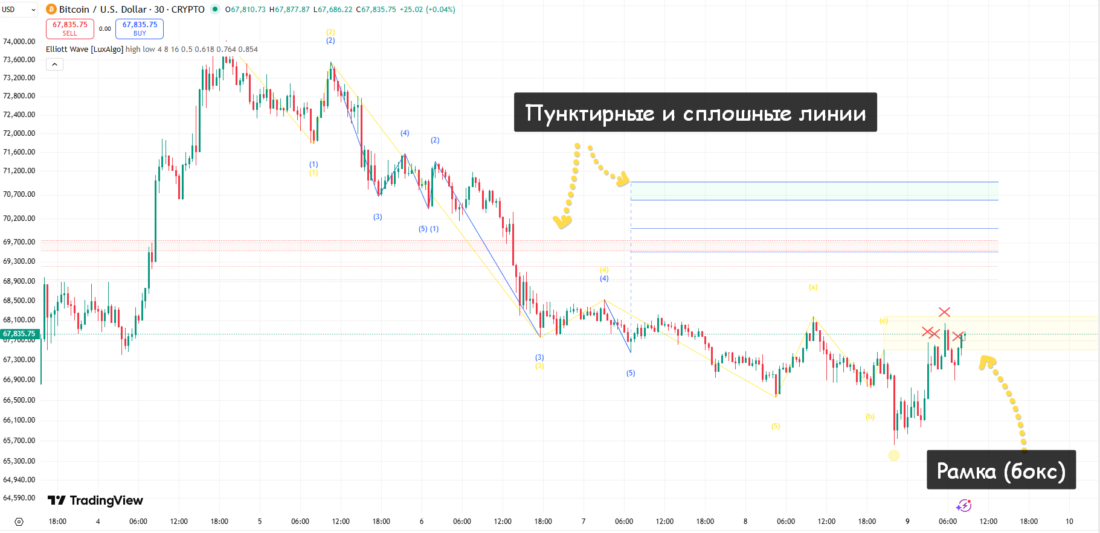
Confirmed impulse or corrective patterns are shown with solid lines, invalid ones with dashed lines or dots. When a corrective wave becomes invalid, the ABC pattern is marked with a dashed line.
Let Us Sum Up

The Elliott Wave indicator is a useful tool for traders interested in wave analysis: it speeds up structure recognition and builds Fibonacci levels after identifying the corrective phase.
Based on the selected source (high/low/close) and ZigZag length, pivot reversal points are determined. The algorithm applies Elliott rules: it checks that Wave 2 does not exceed a 100% retracement of Wave 1, that Wave 4 does not cross Wave 1, and so on. As soon as a 5-wave impulse is confirmed, Fibo levels immediately appear to determine the expected correction.
The visualization is convenient: solid lines are confirmed patterns, dashed lines are canceled patterns, circles are new highs, and red crosses are breaks / punctures. This lets you instantly see that the pattern is broken and adjust.
The script does not identify a 5-wave impulse while it is still developing, but it almost always finds it afterward and generally labels it correctly on the live chart. 99% of other Elliott Wave indicators and scripts cannot do this.
In addition, the script does not show impulses with flat loadings (23,6% Fibonacci corrections), but they are quite rare, although the most productive.
Despite its drawbacks, the Elliott Wave indicator is an excellent educational and analytical tool. Probably the best of all free options.