
EA Analyzer software: learn everything about your strategy!

Hello, fellow Forex traders! When trading with real money, you need to possess as much information as possible about your strategy. Sometimes it is enough to make only very minor adjustments to the rules of an unprofitable trading system for it to start generating profit.
For example, remove one instrument or another from trading, or change the time for trading. But how do you understand what exactly needs to be adjusted in order to start making a profit? It is important to know the profit information and what to expect during periods of drawdown and stagnation, as well as to have monthly and yearly results for any strategy that you are going to use for real-money trading. The EA Analyzer program can help with this. That is what we will talk about today.
Installation

The program is installed like any other Windows program. There are 32-bit and 64-bit versions.
Install the program from the archive at the end of this review.
Why is the program so useful?
EA Analyzer performs a more advanced analysis of your trading results compared with the terminal's standard capabilities. In addition, the program allows you to make consolidated statements of expert advisors working on several currency pairs, that is, to combine several expert advisor reports for different trading instruments into one.
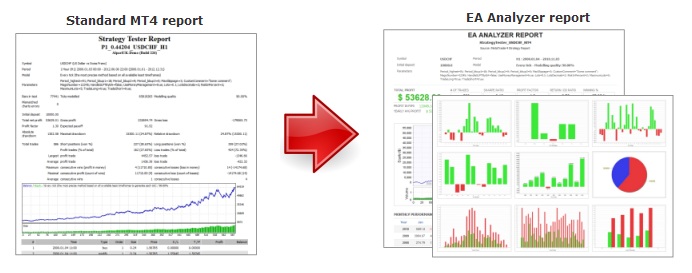
In the statement created with this program you will see:
- detailed statistical characteristics of trading, including those unavailable in the terminal's standard report.
- profits by months and years.
- various charts, such as profit/loss depending on the entry hour, on the day of the week, on the month, the total number of trades by hours, days of the week or months, trade duration and the dependence of a trade's profitability on its duration, and a bunch of other statistical data presented in a simple graphical form that is easy to understand. More than 20 different charts.
- naturally, the equity curve with drawdowns and the trade list.
- the main characteristics can be displayed in currency, pips, or as a percentage of the initial deposit.
- the "What if?" scenario allows you to see "on the fly" how the trading result would have changed if, for example, we had not traded during certain hours or on certain days of the week.
- Monte Carlo analysis, which allows you to test your trading for robustness.
How to use it?

The program does not have Russian-language support, so for those unfamiliar with English it will be a little difficult at first. The first thing we need is to prepare a report. This can be a report from MetaTrader4 or even a report downloaded from myfxbook.com in *.csv format. Load it by clicking the load button in the top menu of the program. If you have several reports, for example when testing an expert advisor on several instruments, load them all at once. The free version of the program has a limitation: you can load only 20 reports. If you forgot to load some reports, you can also use the load button on the bottom panel. To calculate a consolidated report, you need to select all the loaded reports by ticking them and click the Create portfolio button. A new consolidated report named Portfolio 1 will appear.
A little below the main menu there is another one with 9 buttons. Let us go over each of them in more detail.
- Overview (general).
Displays the main trading results. There is an option to display them in money, pips, or percentages; to do this, just use the second button in the main panel, immediately after the Load button.

So, what do we have here:
total profit (overall profit). Displayed in currency, pips, or percentages.
Profit in pips (profit in pips). Total profit in pips.
Yearly avg profit - average profit per year. Relevant if you loaded the expert advisor's reports without applying money management (that is, an expert advisor that traded the whole time with the same lot size). In all other cases, this indicator is not informative.
Yearlyavg % return - average annual return as a percentage of the deposit. Same as in the previous point.
# of trades - the total number of trades.
Sharpe ratio - Sharpe ratio. One of the secondary statistical characteristics of the account.
Profitfactor - profit factor. One of the main statistical characteristics of the account - pay special attention to it. In essence, this is the profitability factor of the trading system. It is believed that if this characteristic is below 1.6, the system works inefficiently. At 1 the system breaks even. The higher, the better. But values above 3 should raise concern.
Return/DDratio - the ratio of average profit to drawdown. Too small a value indicates "sitting out" a position. The higher the value, the better.
Winning percentage - the number of winning trades as a percentage of the total number of trades. It can vary greatly for different strategies. For example, when trading with the trend this value can be 40% or even lower. For a scalping tactic, as a rule, it is no less than 70%.
Drawdown - absolute drawdown. How much the initial deposit drew down.
% drawdown - the same thing, only expressed as a percentage.
Daily avg profit and monthly avg profit - average daily and monthly profit (in currency, percentages, or pips).
Average trade - the average trade. If it is negative, that is bad.
Annual %/ MaxDD% - the ratio of total profit as a percentage of the initial deposit to drawdown as a percentage. It allows you to evaluate the overall effectiveness of the strategy over the tested time interval. If the interval is 10 years and this indicator is below 10, that is not very good. Again, as with many other indicators, this one will be different when MM is applied and when it is not.
R expectancy - mathematical expectancy relative to average risk. Example of calculation: Expectancy = 50% * 1.5 - 50% * 1 = 0.25, where 50% and 50% are the number of profitable and losing trades in percentages, 1.5 to 1 is the ratio of take profit to stop loss.
Rexpectancyscore - the same as the previous one, only the result is divided by the total number of trades.
strategy quality number - a strategy quality rating assigned by the program based on the overall statistical characteristics.
SQNscore - the same as above, only tied to the number of trades.
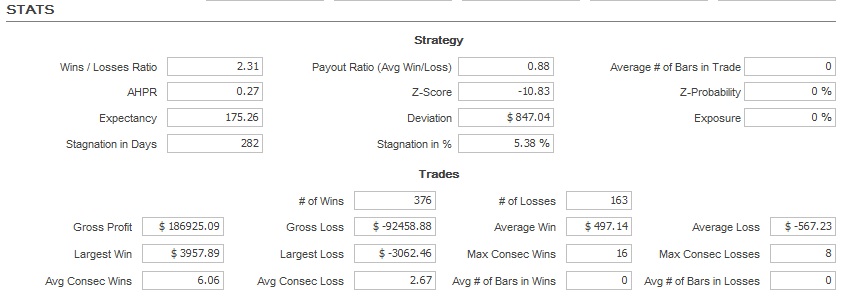
Wins/lossesratio - the ratio of profitable trades to losing ones.
Payoutratio (avgwin/loss) - the ratio of average profit to average loss.
Average # barsintrade - the average number of bars in a trade. Simply put, the average trade duration expressed in bars.
Z-score - z-score. A measure of deviation from the average value of the trade result. If this parameter is positive, then a losing trade follows a profitable one; if it is negative, then another profitable one follows. The farther it deviates from zero, the greater this probability. For example, when the Z-score is greater than one, it is often quite effective to use such a dangerous money management method as martingale.
Expectancy is the mathematical expectancy of the system. How much each trade brings on average in the long-term perspective.
Deviation is the standard deviation from the mathematical expectancy. For example, the mathematical expectancy equals 200$. At the same time, Deviation=300$. This means we can statistically expect the following result from a trade: from -100$ to 500$. The smaller the Deviation parameter, the better. The smoother the growth curve we can expect from the system.
Exposure is exposure.
Stagnation in days is stagnation in days. The operating time of the system with zero profitability.
Stagnation in % is the same thing, but expressed as a percentage of the total operating time of the system.
Next come the characteristics that are also typical for the MT4 terminal report. The only thing that can be singled out is the average number of bars in loss and profit (Avg # of bars in losses and in wins). Then you can study the table of the distribution of profits/losses by months and years. Losing months are not uncommon for any system. Losing years are a much worse situation. Just judge for yourself, are you ready to finish several years in a row at a loss? I think even nerves of steel may not withstand that.
- List of trades (list of trades)
All trades from the statements are collected here in calendar order in the form of a table, somewhat resembling the standard terminal report table. Still, I will translate the columns of this table:
- ticket (order ticket)
- symbol (instrument symbol)
- timeframe (chart period)
- type is the order type (buy/sell, stop/limit pending order)
- opentime is the opening time
- openprice is the opening price
- size is the lot volume
- closetime is the closing time
- closeprice is the closing price
- timeintrade is the time in the trade
- profit/loss is the profit/loss ratio
- cumulative P/L -
- P/L in money is profit/loss in currency
- cumulative money P/L -
- P/L in pips is the profit/loss ratio in pips
- cumulative pips P/L -
- P/L in % is the profit/loss ratio in percent
- cumulativeP/L % -
- comment - a comment on the order.
In addition to everything else, there is a Manage view button here. This is nothing more than the view setting for this table. Here you can create a trades table with only the parameters you need and then select the display template using the Choose view window. It is also possible to save the trades table in *.csv format for further use, for example, in myfxbook.com.
- Equity chart (balance chart)
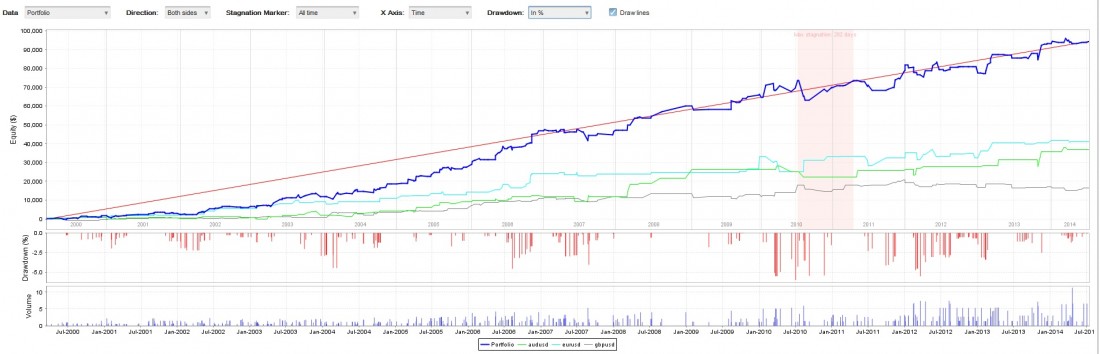
If you uploaded several reports and then combined them into one portfolio, all of them will be displayed on the chart. There is an option to display only buy or sell trades (direction), enable/disable highlighting of the stagnation period, as well as select how drawdown is displayed (do not show, show in currency, percentages, or points). There is also an option to draw a trend line on the growth chart (the drawlines checkbox).
- Trade analysis (trading analysis)
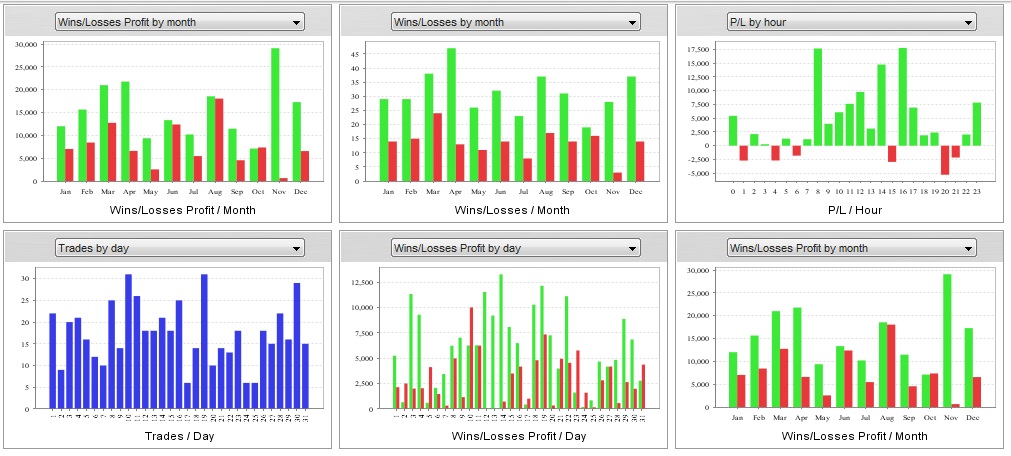
Very valuable information. In addition to the profitability chart by year, it is possible to configure up to 20 charts displaying various statistical information in the form of bar and pie charts:
- tradesbyhour/weekday/day/month/year - the number of trades by hours/days of the week/days of the month/months of the year/years
- tradesbyduration - trades by duration
- P/Lbyhour/weekday/day/month/tradeduration - profit/loss by hours/days of the week/days of the month/months of the year/trade duration
- longvsshorttrades - the ratio of long and short trades
- longsvsshortsP/L - the ratio of profit factors of long and short trades
- profit/loss - the ratio of total profit to loss
- longprofit/loss and shortprofit/loss - the ratio of total profit to loss only for buys and sells separately
- wins/lossesbyhour, day, weekday, month - profitable and losing trades by hours of the day, days of the month, days of the week, or months.
- wins/lossesprofitbyhour, day, weekday, month - profit and loss in currency by hours of the day, days of the month, days of the week, or months.
6 different charts of your choice can be displayed in the final report.
- Settings (settings)
If you uploaded a report on an expert advisor's performance, the expert advisor settings will be displayed in the window; if it is a report on manual trading, only the initial deposit. You can also set a custom initial deposit in the Initialdeposit field. Do not forget to click the Recomputestats button (recalculate the statistics for the report).
- Monte Carlo.
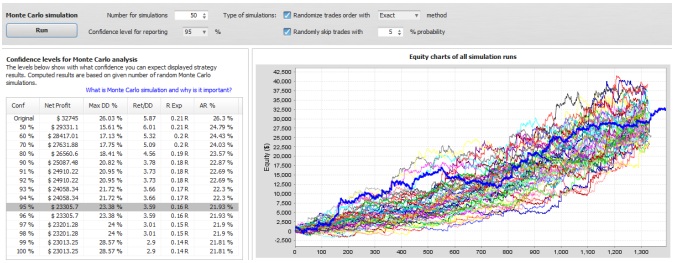
This is a special algorithm that allows you to test the system for robustness when some of its parameters are slightly changed. In other words, by conducting a Monte Carlo analysis of the system, you will get more or less realistic data about its operation: how robust the system is, what minimum profit and maximum drawdown can be expected from the system in the future. The settings are simple: the number of simulations (the higher it is, the more reliable the result, but there is still no point in using more than 100) and the confidence level of the calculations (I advise leaving 90%). In total, there are two ways to use the algorithm:
- swapping all trades around. All trades in the report are rearranged in random order. It gives an idea of how the system would behave if the market were a little different. The main goal of the method is to determine the limits of the system's maximum drawdown. To choose this method, it is enough to check the box next to the first item.
- a random skipping of a certain percentage of the total number of trades (set by the probability parameter). Here, some number of trades from the report is simply skipped at random, as if the trader had simply not noticed them.
Both methods can be used together. The chart on the left shows a graph with possible development scenarios plotted on it. The closer these lines are to the original one, the better: the more robust the system is and the less random the results are. In the free version of the program, unfortunately, only the analysis of the first 30% of trades from the report is available, but even on this basis it is often possible to judge the quality of trading.
- What if scenario (the "what if?" scenario)
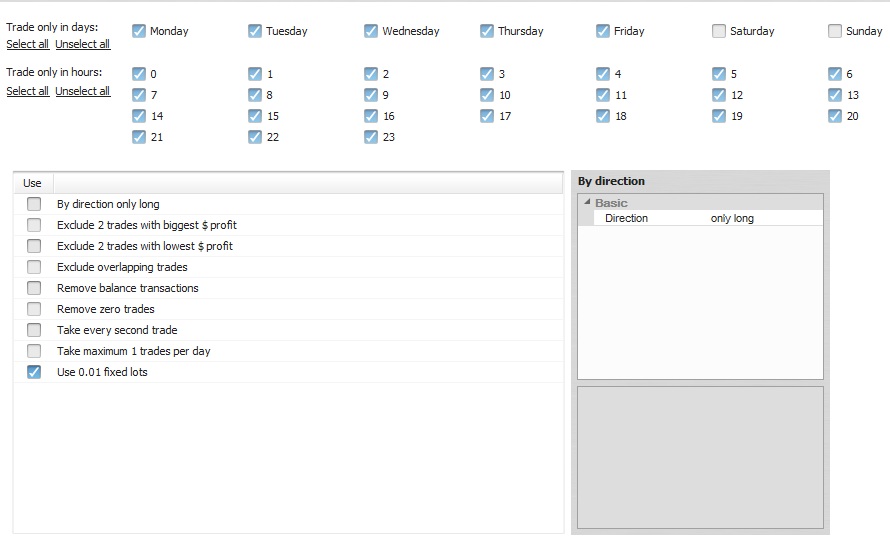
A fairly useful function of the program that allows you to obtain a system profitability chart if we were to follow a certain additional rule:
A) trade only on certain days marked with checkboxes.
B) trade only during certain hours marked with checkboxes.
C) only buys or sells
D) exclude a certain number of trades with the maximum or minimum profit
E) exclude trades that overlap each other in time.
F) remove deposits/withdrawals and trades with zero profit from the report
G) leave only every second trade
H) leave only a certain number of trades per day
I) Use a fixed lot.
All these restrictions allow you to make adjustments to your trading system and, as a result, trade more profitably.
- Equity control (equity control)
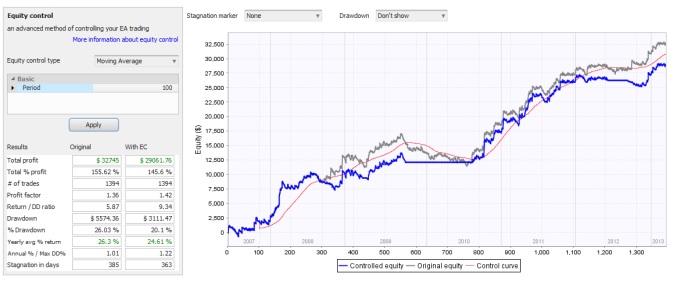
The main point of this tool is to control the equity level (essentially the current drawdown) using various indicators plotted on the equity chart: Bollingerbands, Ishimoku, Movingaverage, and others. In theory, in some cases this improves system performance and reduces drawdowns.
- Portfolio Analysis (portfolio analysis)
If you are analyzing a portfolio made up of several reports, here you have the opportunity to analyze the correlation between trades on different instruments and the number of trades opened simultaneously across several instruments.
10. QuantEditor.
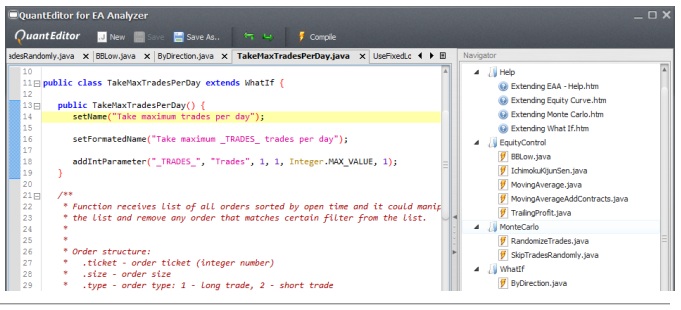
The last thing I would like to mention is the built-in QuantEditor, in which any trader with at least a basic understanding of programming can code any of their own scenarios for use in Monte Carlo or WhatIf analysis. This opens up truly unlimited possibilities in analyzing your trading, limited only by your needs and your imagination.
Conclusion

EAAnalyzer is a very powerful program for analyzing your trading. It allows you to carry out a comprehensive analysis of your trades, helps you examine your trading in more detail, and improve its result.
Download EA Analyzer

Respectfully, Dmitriy aka Silentspec TradeLikeaPro.ru