
Double High / Double Low Pattern

Hello, fellow forex traders. We all know the importance of support/resistance levels. But have you ever wondered how they begin to form? And what if this moment can be identified (even if not always)? An interesting idea, agree.
And based on this, an extremely effective Price Action pattern called Double High / Doble Low was identified. Today I would like to tell you about it.
Price Action DHDL Pattern

In this article, I would like to touch on a very interesting setup called Double High / Double Low. You may have seen it somewhere under a different name, but that is not so important.
This pattern is quite effective and profitable. I mentioned it in webinars, and now I would like to make a separate article about it.
So what is the essence of the Double High / Double Low setup?
As we remember, all our Price Action setups are traded from a level. And what is a level, you ask? We will not go into details, because we have many separate lessons on levels.
A level is a price area above which the price does not go. It is not allowed to pass above (or below) a certain level.
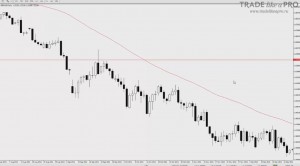
In this case (in the screenshot above), we have a bearish trend present, so the price is not allowed to rise upward. Simply put, some price appears above which the quotes do not move. The reason for this event is not so important to us. We simply know that this is a certain boundary above which the price does not rise.
Now let us forget about levels for a second and look at these two candles:
More precisely, let us look at their tops.
One candle has a high of 1,6414:
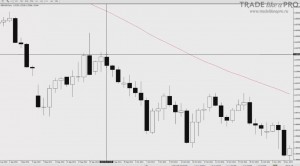
The other candle, meanwhile, has a high of 1,64125:
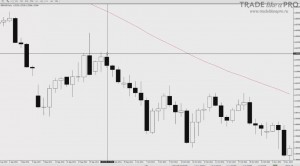
We can consider the tops of these two candles identical, because we all know that quite often different brokers may have slightly different quotes, and because of this a difference, a slack of 1-2 points appears. This is quite acceptable, and there is no need to worry about it.
What does this mean? It means that there is a certain price above which the quotes did not go, or they were "not allowed" to go. This is not very important for us. We simply know that the price did not go. And it is noteworthy that this happened over two consecutive days.
That is, the price was not allowed through the first and the second time:
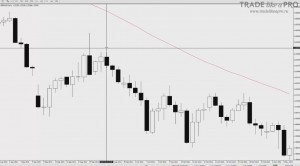
Players see this and understand that there is some strong seller at this level, or there are no buyers above these values. Something is preventing the price from moving, and this is on the daily chart. So that you understand, to keep the price from going above certain boundaries on the daily chart requires a large amount of funds.
Thus, it turns out that we have a certain price barrier. And a price barrier is nothing other than a level:
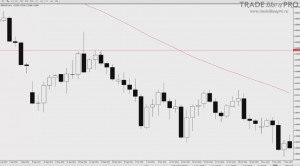
That is, these two candles formed a level. We still do not know, without seeing the right side of the chart, whether this will turn out to be a level, but the price is giving us the prerequisites for it. Two identical highs tell us that the price is being kept from moving up on the daily chart for two days in a row. And if the price is not being allowed upward, then it will go down. And that means we can open a position and earn some profit.
I would like to immediately draw your attention to one point.
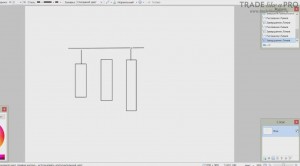
Please note that identical candles do not necessarily have to come one after another. There may be one or a couple of candles between them. If the candles are very far apart, then this already turns into the double top / double bottom setup. We had a separate video about it.
There may be one or two candles between candles with identical highs or identical lows. If there is a candle between them that breaks through this level created by the edges of the candles like this:
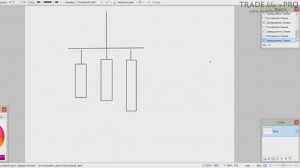
Then this means that although the price bounced off this level, it can quite possibly break through it. This level is not stable, and it is not worth considering it as a Double High / Double Low setup. Therefore, pay attention that there is no breakout of the price level created by identical tops.
Also note that sometimes the tops rest on a level that was already there at this point. This makes the setup much stronger.
How will we enter the market?

As always, when trading Price Action, we do not rush into battle with "saber drawn". We do not strive to enter the market, but on the contrary place a limit order not far from our formed level:
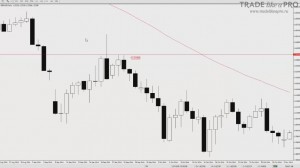
If this is a Double High, then we enter a sell, and if it is a Double Low, then we enter a buy. And, naturally, we try to do this in the direction of the main trend. We treat setups against the trend with great distrust.
We would place the sell limit order right here:
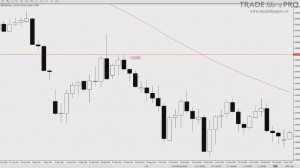
I understand that many might say that the price will immediately go down, so what is the point of not entering the market right away? Yes, it may. And in this case that is exactly what happened. Yes, this happens, but we always remember the risk-to-reward ratio, which, as I said, should be at least 1:2.
We enter with a limit order, placing it not far from our as yet untested level.
Stop Loss and Take Profit

We place the stop loss slightly above the level:
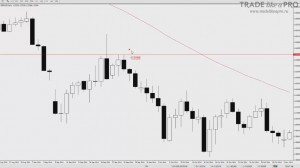
Next, we set take profit at the next level. If it is not visible, then we simply multiply our stop loss by 3-5 depending on the size of the stop loss:
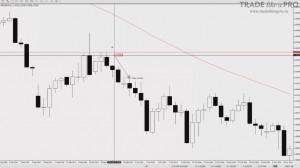
It turns out that our take profit should be somewhere around here:
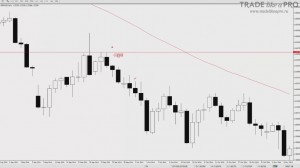
And even if we did not enter the market, if the order had been activated, we could have made a profit even 5-10 times greater than the size of the stop loss.
Naturally, there will be situations when our order is not activated, and we will not enter the market. If you are interested in a more detailed explanation of why we try to enter with a small stop and a large take, watch the webinar called "Take profit and stop loss".
Another small trick that I would recommend you use is moving the order to breakeven after two stop losses. That is, when the price has moved into profit by the level of two stop losses. In this case, our stop loss was 45 points. Accordingly, at the level of 90 points we would have moved our order to breakeven:
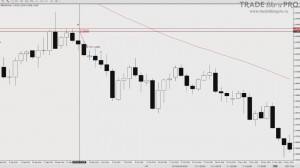
This is a precautionary measure that will quite often help you stay "even" even when the market reverses sharply.
Examples

Now let us look at another example for a buy.
In this case, we have the daily USDJPY chart open:
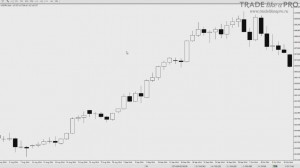
I want to draw your attention to the fact that this setup is effective on daily charts and on H4. I would not advise using it on H1.
So, let us return to our example. The trend on the chart is bullish.
A Double Low setup is formed:
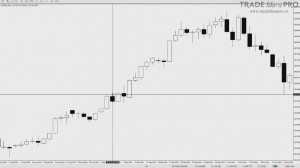
We observe two candles. One has a low of 104.73, and the second 104,74. This is entirely acceptable, as I said earlier. Immediately note that the next, third candle moved a little lower, which is why we place our stop loss beyond the forming level to prevent a loss.
Such spikes are possible, and it could even have been the case that the big players were not planning to push the price below this boundary. But it happened that it went down. This is normal, because it is precisely because of such spikes that a stop loss is placed.
You can build the level right away:
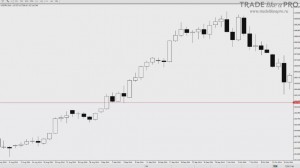
We do not enter the market immediately after the second candle closes:
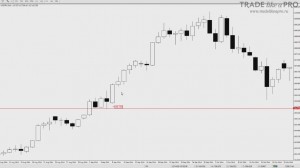
We place our buy limit order slightly above our forming level, that is, approximately right here:
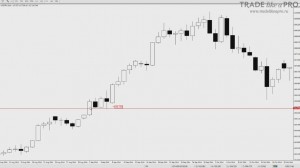
Do not forget about the stop loss, which we place slightly below the level:
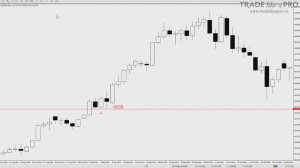
Later our order would have been activated, and note that if we had entered the market immediately after the second candle closed, we would have missed out on 48 points of profit:
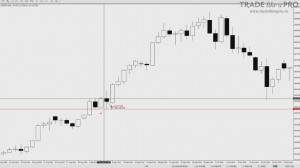
And this is greater than our stop loss, which amounted to 40 points:
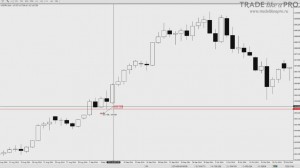
And at the same time our stop loss would have been 85 points, which, you must admit, is twice as much as the stop loss with which we managed to enter the trade.
For further work, we could have multiplied the stop loss by three, and already here we would have exited the trade:
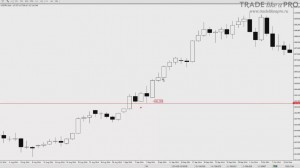
Very often the take profit is multiplied from three to five units. In this setup, three is the minimum unit that we use to find the take profit. If there is no reference point in the form of a level, then the stop loss can be multiplied by five as well, if it is very small.
Sometimes it turns out that the stop loss is large, and multiplying it by some large factor is incorrect. I advise you to focus on a value from three to five.
Let us look at one more example:
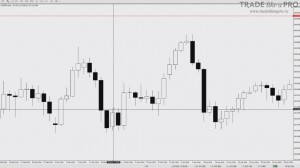
We see that there are two candles in a row:
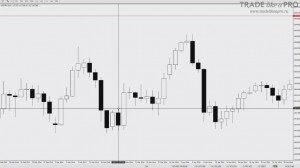
The same 101,28 low. As we can see further on, the price returned very close to this price level. There was an opportunity to enter with a buy limit order and, in principle, any take profit would have been taken.
In this case, by the way, one could have focused on this level:
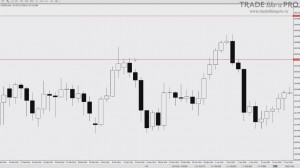
The take profit here would have been approximately around here:
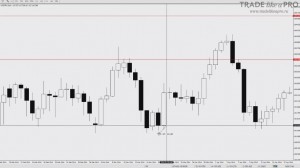
And the stop loss would have been somewhere around 28 points:
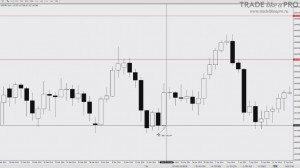
However, I would like to note that this setup does not always work.
That is why we place stop losses. The price can quite easily go wherever it wants, and because of this the trade can be unprofitable. Do not forget about the possibility of a loss. If we use a risk-to-reward ratio of 1 to 3, then three stop losses are offset by just one profitable trade. Although in essence there are few stop losses in this setup. In practice, it works quite well.
And now let us consider that very moment that I spoke about at the very beginning of the article:
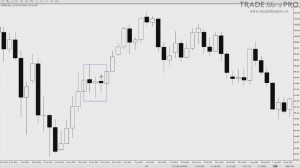
It would seem to be the same low for the candles, but the middle candle pierces through them, and I would not enter such a setup.
This candle shows that the level is not that strong and it is possible that the price will break it and go down:
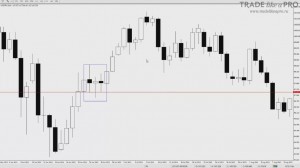
In such cases, you should not enter on this setup, even if the price then moved higher.
Another example on the EURUSD pair:
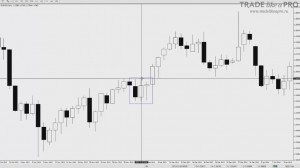
The difference between the lows is one and a half points. We can say that they are the same on both candles.
The price again returned with a tail and gave us an opportunity to enter the market with a limit order with a small stop loss and great profit potential:
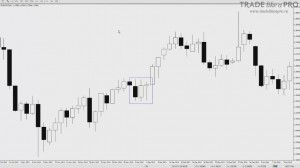
Please note that very often the price tends to test this newborn level. Therefore, it is quite logical to enter the market not immediately at the close of the second candle, but near our forming level. In this way, we reduce the size of the stop loss and increase the size of the potential profit.
And finally, let us consider one more example:
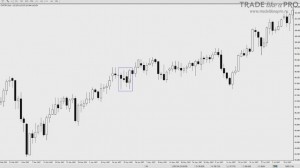
This time the candles with identical lows do not go one after another. Between them there are two candles with different lows that do not break the supposed level.
The first candle has a low of 97,70:
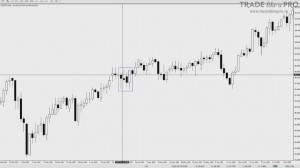
Then there are two candles with different lows and the next candle with a low of 97,71:
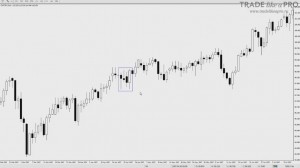
Here we would not have managed to enter the trade because the price ran upward, but nevertheless it was a valid setup that was quite suitable for entering the market.
I would like to remind you of what I said earlier, that in the Double High / Double Low setup there can be one or two candles between the candles. Three candles is the maximum. But it is better if these candles with identical Low or High go one after another. Then the setup is considered stronger, and the level more stable. At the same time, the candles located inside between the identical values should not break the forming level. If there is a tail that breaks the level, then this is no longer a valid setup and I would not advise considering it.
Conclusions

- The Double High / Double Low setup shows us a certain price boundary below (above) which the price is not allowed to go, and we assume that this is a forming level. The difference in points between two identical candles can be about one or two points. In addition, there may also be one or two more candles between them. But of course it is better if they go one after another. Then, as I said before, the setup is stronger and the level more stable.
- We try to enter the market in the direction of the main trend. If there is support from some previously formed level, then we use it as a reference. We enter with a limit order slightly above the level if these are buys, or slightly below if these are sells.
- We place the stop loss slightly below the level if these are buys and slightly above if these are sells, in case of random price spikes that can bring a loss. We try to keep the stop loss small.
- We place the take profit at the next level. If there is none, then we multiply the stop loss by 3-5 depending on the size of the stop loss. In this way we determine the size of the take profit.
- This pattern works well on daily charts and on H4.
- On H1 and below, I would not recommend using it because of instability.
- It is also recommended, after the price has moved two stop losses in the direction of profit, to move the stop loss to the breakeven level. That is, to the level of the order opening.
- The Double High / Double Low pattern can help you in trading on the forex market and bring sufficient profit when used and calculated correctly.
Respectfully, Pavel Vlasov
TradeLikeaPro.ru