
DMI Indicator: An Oscillator in the Service of Trend Traders

Directional Movement Index (DMI indicator) is a decision-making system proven by decades of market practice. The strength of DMI lies in its ability to measure trend objectively, without yielding to the trader's emotional swings.
DMI has the appearance of an oscillator, but at the same time it is a trend indicator that helps answer two questions: who is dominating right now, buyers or sellers, and whether the trend is pronounced enough to trade at all.
The Directional Movement Index (DMI) indicator was developed by J. Welles Wilder Jr. and first introduced in his book "New Concepts in Technical Trading Systems," published in 1978.
I should note that this work became a turning point in technical analysis: in addition to DMI, Wilder described such tools as the Relative Strength Index (RSI), Average True Range (ATR), and Parabolic SAR, indicators that are now considered the standard.
DMI was originally created for commodity markets, but it quickly proved its effectiveness on stocks, currency pairs, and indices thanks to its universal approach to evaluating directional price movement.
Thus, the DMI indicator firmly entered the arsenal of trend traders, especially in markets where price movement proceeds in a series of impulses and pullbacks.
This material is for informational purposes, cannot and should not be regarded as consultation or advice.
Formula for Calculating the DMI Indicator
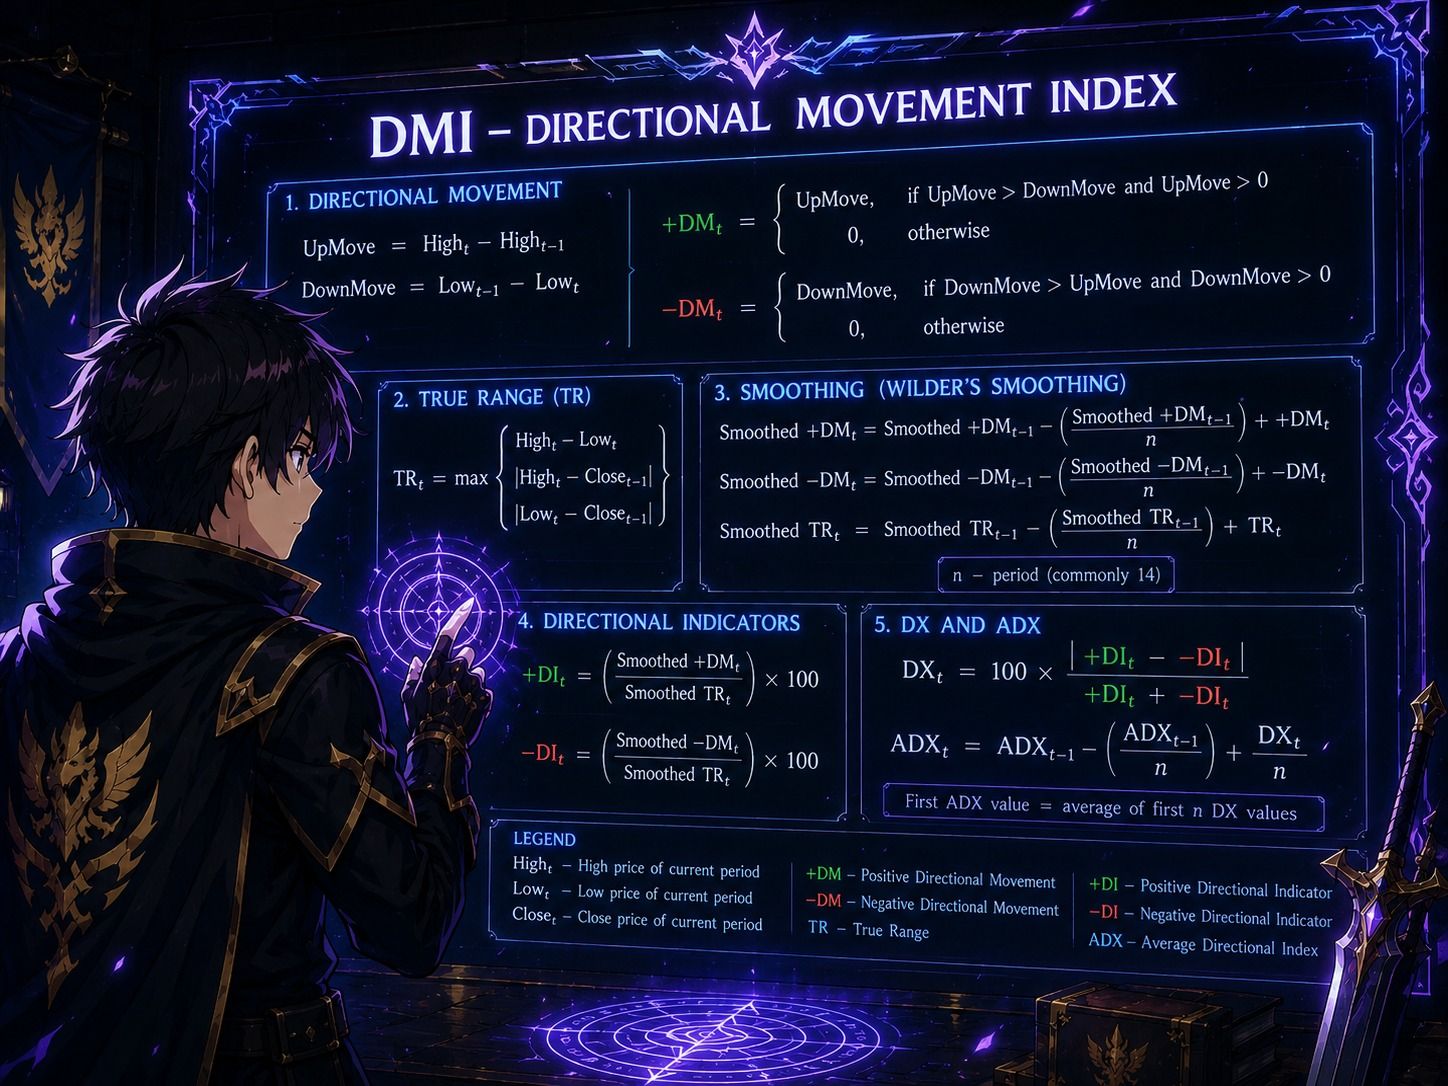
The basic idea of DMI is very rational.
The indicator first measures how much the current bar has "advanced" upward or downward relative to the previous bar, then normalizes this movement by current volatility through True Range/ATR, and only after that smooths the result. This approach is needed so as not to compare "naked" price points in different market regimes, calm and impulsive.
Thus the DMI indicator is a system of three interconnected components:
| Component | Purpose |
|---|---|
| +DI (Positive Directional Indicator) | Strength of upward movement |
| -DI (Positive Directional Indicator) | Strength of downward movement |
| ADX (Average Directional Index) | Overall trend strength without regard to direction |
In simplified form, the DMI calculation looks like this:
UpMove = High(current) - High(previous)
DownMove = Low(previous) - Low(current)
+DM = UpMove if UpMove > DownMove and UpMove > 0, otherwise 0
-DM = DownMove if DownMove > UpMove and DownMove > 0, otherwise 0
This logic cuts off the "noise" of intraday fluctuations: only true directional movement exceeding the opposite one is taken into account.
Next, the +DM and -DM values are smoothed by Wilder's exponential moving average, analogous to an EMA with a period of 14, and normalized through the Average True Range (ATR), which acts as a measure of volatility. ATR brings the values to a relative scale of 0-100. This makes it possible to compare trend strength across different instruments regardless of their absolute price.
Smoothing reduces noise and makes the indicator suitable for systematic trading, and not only for visual analysis.
The calculation itself looks as follows. Smoothed +DM and -DM are divided by ATR and multiplied by 100: this is how +DI and -DI are obtained. After that, DX = 100 × |+DI - -DI| / (+DI + -DI) is calculated, and ADX is the smoothed DX.
Thus, ADX is a smoothed version of DX and serves as a significance filter: a value above 25 signals a strong trend, below 20 a sideways market or weak movement. It is fundamentally important that ADX does not indicate direction, it merely measures the market's "temperature."
The economic meaning of the formula is key here. High and low prices are used because they better reflect the real price pressure in a bar than closing prices alone.
Strategies for Using the DMI Indicator
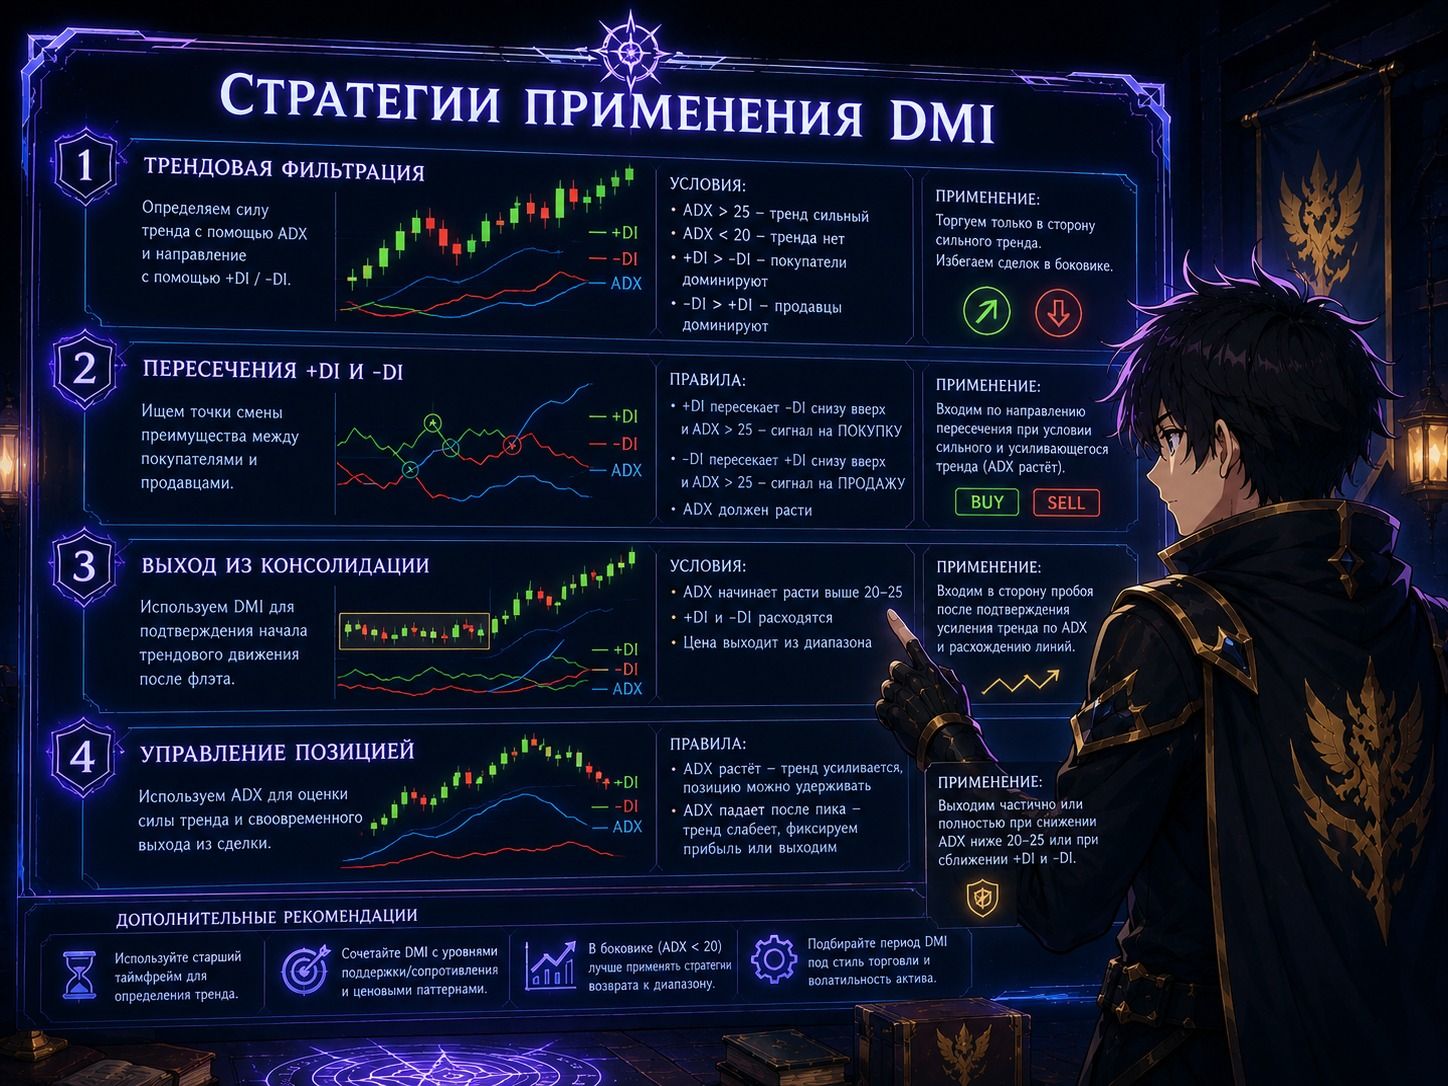
Above, we have already shown the basic interpretation of the indicator's readings.
- +DI > -DI with ADX > 25 indicates an upward trend and the priority of longs.
- -DI > +DI with ADX > 25 indicates a downward trend and the priority of shorts.
- ADX < 20 signals that trading is taking place in a range, which means DMI signals are ignored.
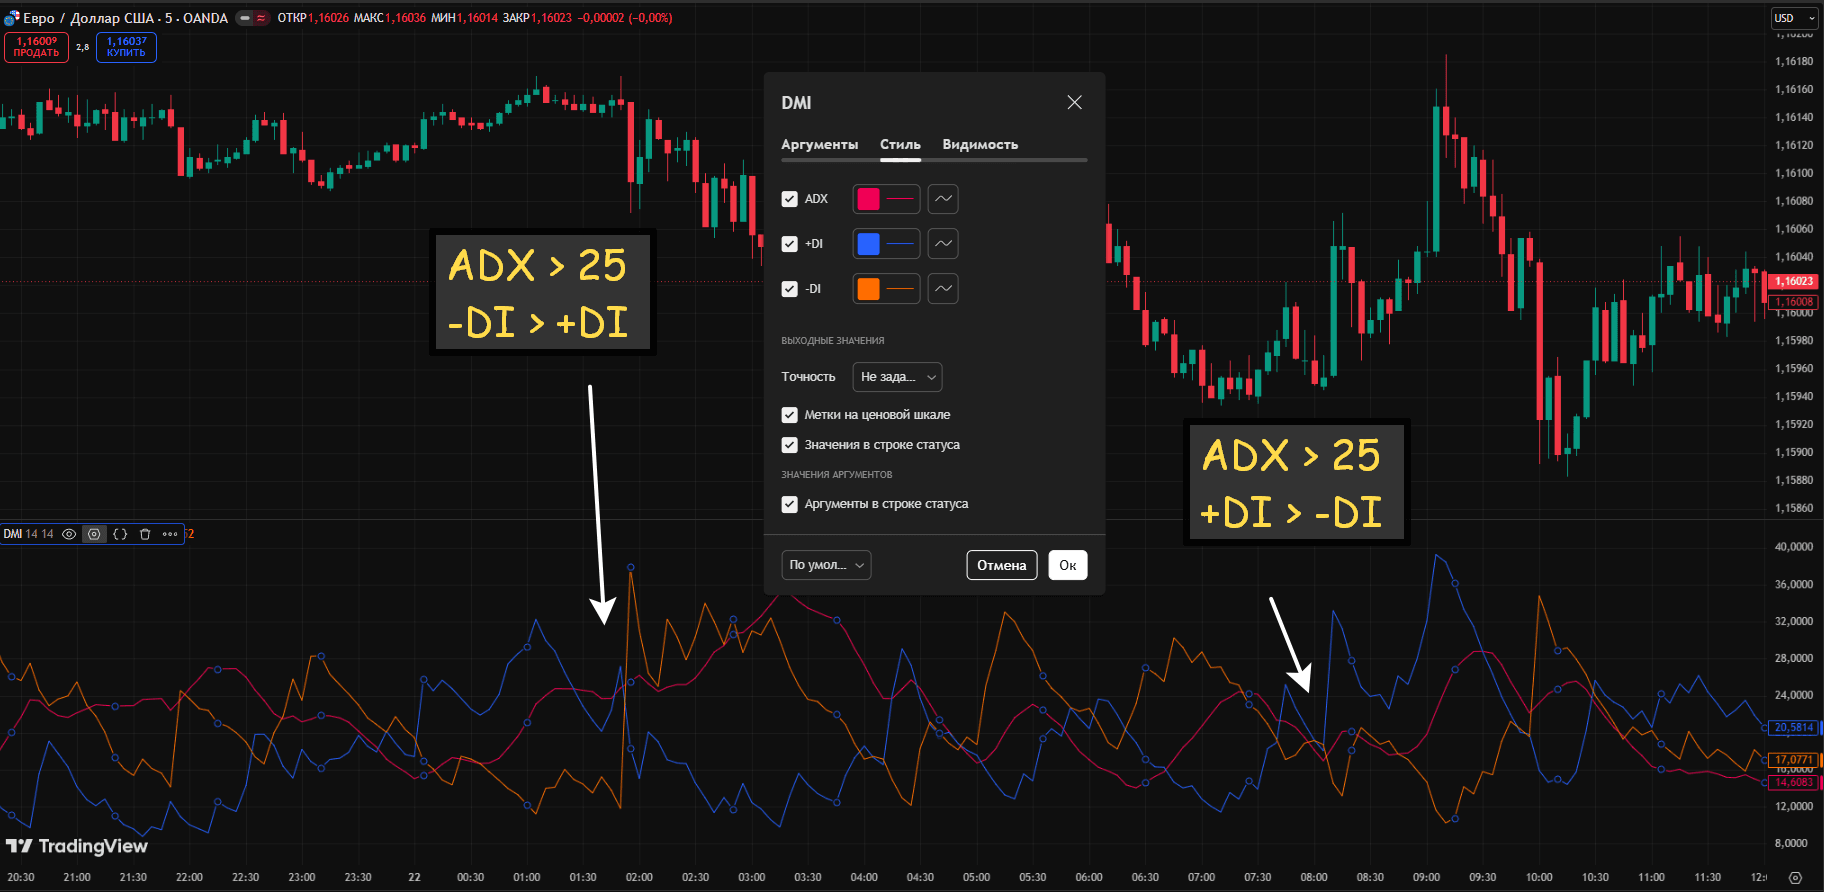
A classic signal is a situation in which +DI crosses -DI from below upward or -DI crosses +DI from above downward. In the first case, we can speak of the appearance of a bullish signal; in the second, a bearish one. The image above shows a bearish signal (TradingView platform, built-in indicator).
Note that novice traders often fall into the trap of false crossovers during periods of low volatility. Therefore, confirmation of ADX > 25 is a mandatory condition.
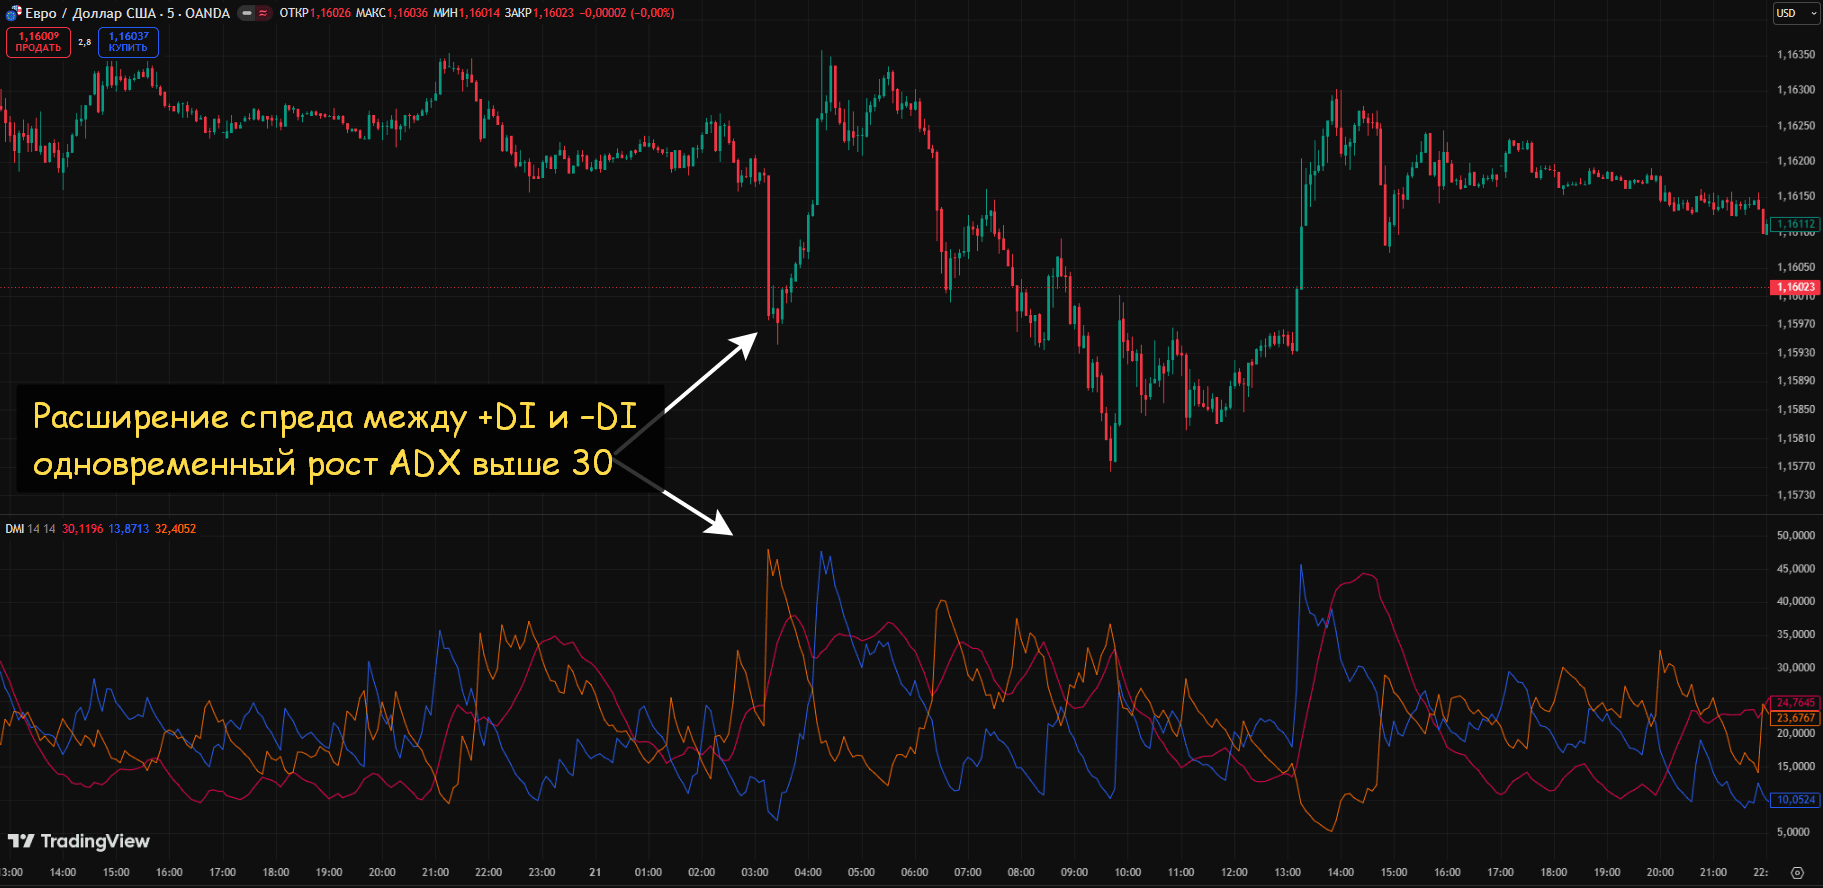
A more advanced approach requires not just a crossover, but a significant excess of one DI over the other (a widening spread between +DI and -DI) while ADX simultaneously rises above 30. This filters out weak signals and leaves only impulsive moves with a high probability of continuation. The image below shows a bullish signal (TradingView platform, built-in indicator).
DMI can be used to detect divergences between the indicator and price. If price makes a new high but +DI does not confirm it with a new peak, this is a signal of weakening upward momentum and a possible correction. This technique is especially effective on higher timeframes (H4, D1).
Combining DMI with Other Indicators
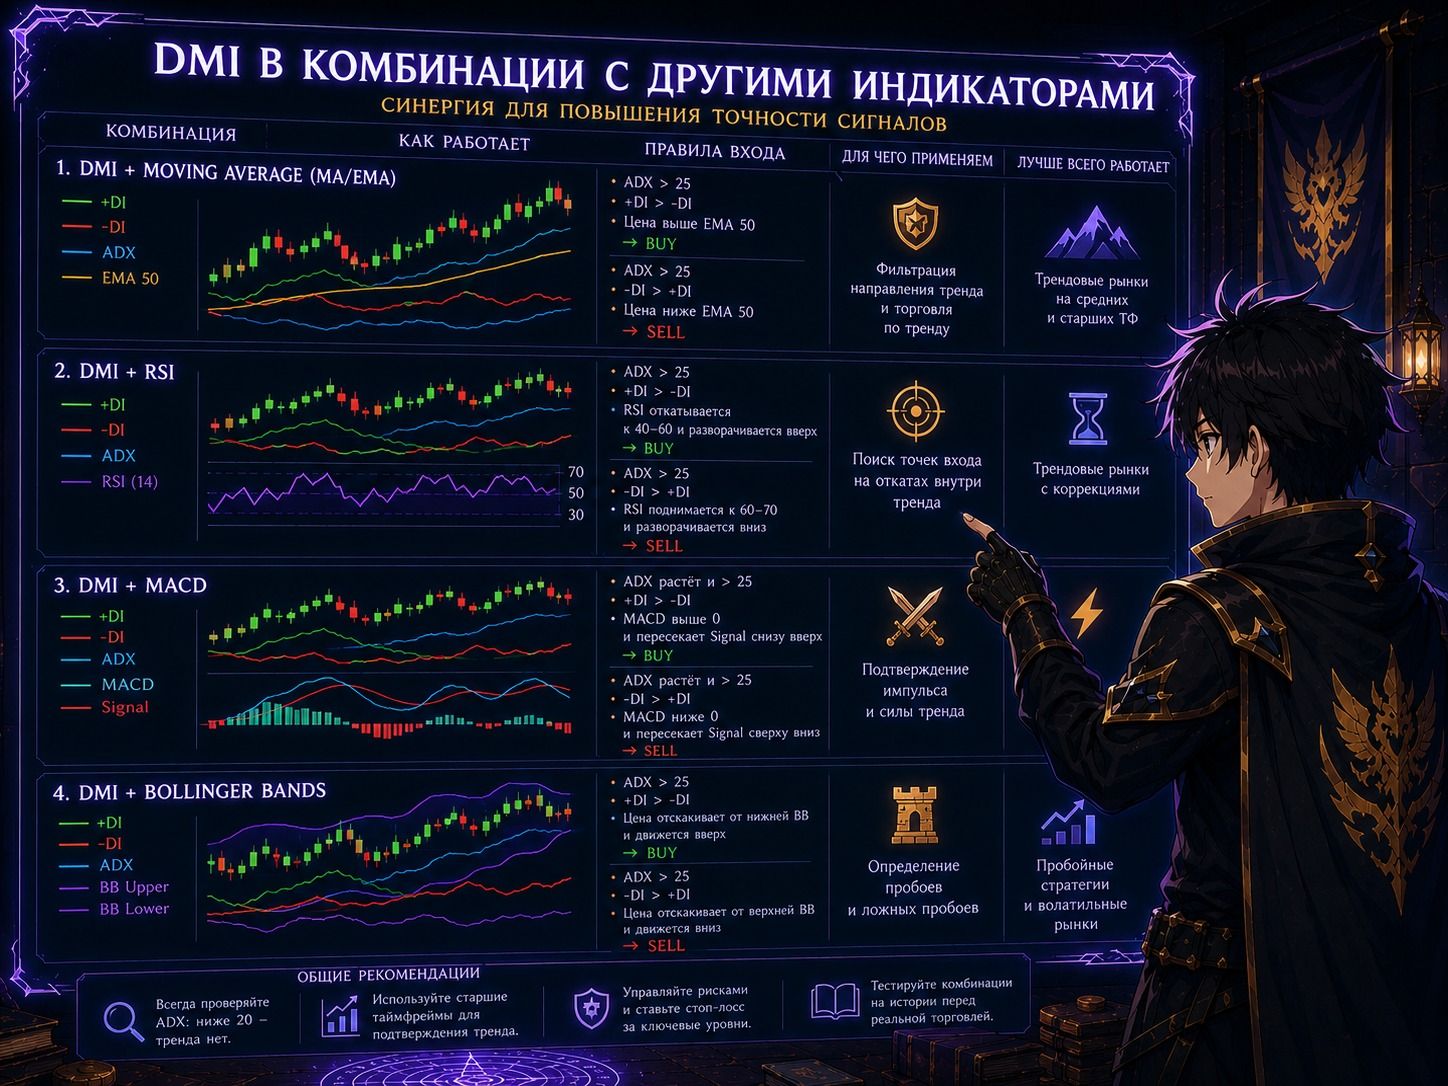
In professional work, DMI is rarely used on its own. The best approach is to split the roles: DMI provides the market regime and direction, while the second indicator is responsible for timing.
The most effective combinations are as follows.
| Indicator | Role in the System | Example |
|---|---|---|
| RSI | Overbought/oversold filter; enter only when ADX>25 and RSI<70 for long | Reduces the number of false entries in the extreme-value zone |
| Volume | Breakout confirmation: rising ADX on increased volume strengthens the reliability of the signal | Makes it possible to distinguish a true breakout from a false one |
| Bollinger Bands | A move beyond the bands + a DMI signal = entry in the direction of volatility expansion | Especially useful after a period of band compression |
| MA | Directional filter: long only when price is above MA(200) and there is a bullish DMI signal | Keeps the trader aligned with the global trend |
| MFI | Money-pressure assessment: MFI>50 confirms bullish DMI, MFI<50 bearish | Adds volume context to directional movement |
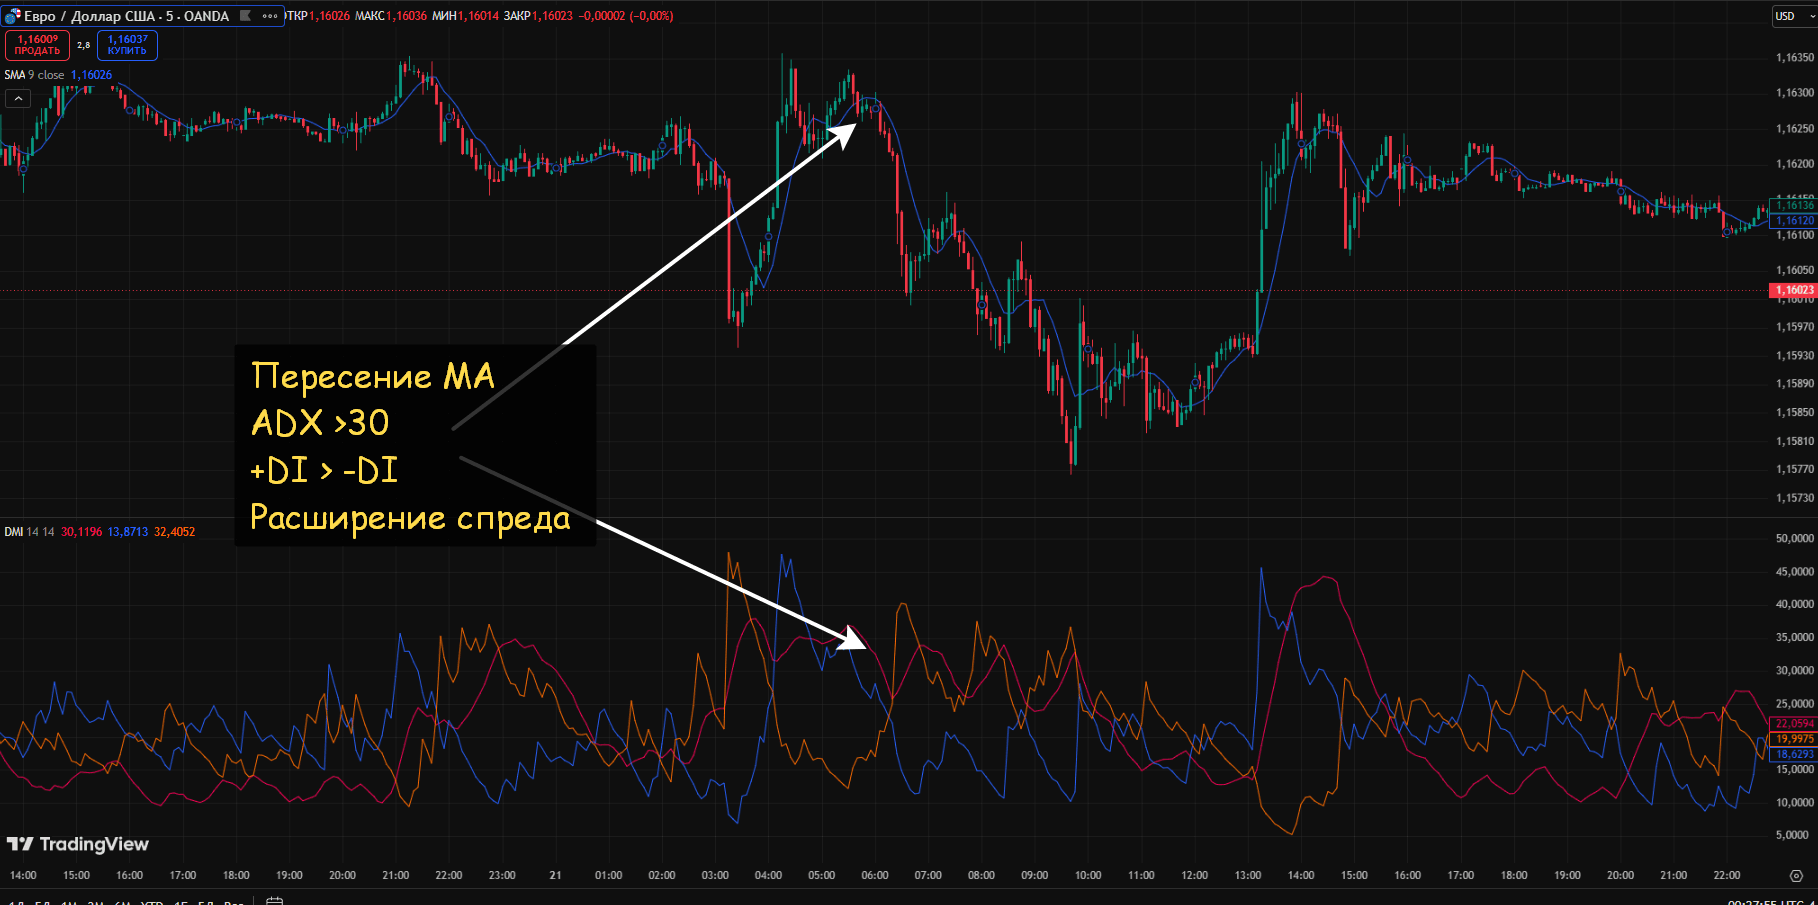
- Determine the global trend by MA(200).
- Wait until +DI > -DI and ADX > 25.
- Check MFI: a value above 50 for long.
- Enter on a pullback to the short-term MA(20).
Such a multi-level filter significantly increases the percentage of successful trades.
Summary
DMI shows the direction of movement through +DI and -DI, while ADX within this system shows the strength of the trend. Therefore, by its nature this is a tool for analyzing the trend and its strength, not for searching for overbought/oversold conditions like RSI or Stochastic.
ADX really does move in a limited range from 0 to 100, so visually it is a bit similar to an oscillator. But functionally it is not an oscillator in the classical sense, but a trend filter. In practice, this means:
- +DI above -DI - buyers have the advantage (ADX >25)
- -DI above +DI - sellers have the advantage (ADX >25)
- ADX is rising - the trend is strengthening (ADX >30)
- ADX is falling - the trend is weakening