
Defining Targets for "Killer" Trading with the ADR Indicator

How often has greed made you stay in a trade longer than necessary? How many times have you scolded yourself for exiting the market too early? Enough!
Enough. It's time to stop wandering in the dark and gain a clear vision of targets in intraday trading. One of the secrets of short-term trading is knowing when you need to exit a trade. At the same time, taking the maximum number of points, but without sitting in the trade too long in the hope of illusory profit. And a professional forex indicator for determining intraday targets will help us with this - ADR (Average Daily Range).
Characteristics of the ADR Indicator
Platform: MetaTrader 4
Currency pairs: any
Timeframe: from M5 to H4
Trading time: European and American sessions
Recommended brokers: Alpari, Forex4You
Installation

The Average Daily Range indicator is installed according to the usual instructions for working with indicators, there is no need to invent anything.
Capabilities of the ADR Indicator

The ADR indicator is a calculator for computing the average daily range (ADR) and is a professional tool for trading on Forex.
The average daily range is an indicator of the maximum size of the daily market movement that can be expected within reasonable limits. The ADR calculator provides valuable real-time market information that is visible even to the naked eye. The ADR calculator will significantly help you in trading, namely in determining targets.
Advantages of the Professional ADR Indicator
• Automatic calculation of daily and weekly trading ranges
• Makes it possible to outline intraday trading reference points - intraday highs and lows.
• After determining the weekly range, you can use the built-in strategies of bouncing from or breaking through major price levels.
• It is configurable and convenient.
• Determines areas of support and resistance.
• Determines and verifies the correct direction in trading.
Options of the Professional ADR Calculator
• Display settings: standard (full-size) or mini display.
• Adjustable colors.
• Settings for selecting the average daily range for different traders.
• Ability to choose the display location in a corner: upper left, upper right, lower left, or lower right.
• Adjustable font size
• Settings for daily and/or weekly levels.
How the ADR Indicator Works
The Average Daily Range (ADR) indicator stands for Average Daily Range. The name speaks for itself. The indicator calculates the daily range for intraday trading. It is useful both for beginners and experienced traders.
I suggest we break down what it is. This can be shown more clearly on the chart of some currency pair. For example, on the hourly chart of the euro/dollar. The daily range is nothing more than the distance in points from the lowest point to the highest point on the chart traveled by price over a particular trading day. Please do not confuse this with the distance from the day's open to the close.
The range for 27.03 will be 67 points.
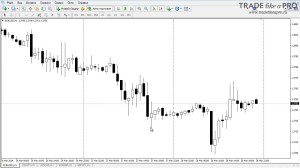
If you switch to the daily chart, the range will be equal to the distance from the high to the low of the daily candle. The average daily range is the arithmetic mean over a certain number of days. For example, if we want to know the average range for the past week, then we need to take the value of each day. That is 114 points for Monday, 96 points for Tuesday, 53 for Wednesday, 67 for Thursday, and 68 for Friday. Add them together, then divide by the total number of days. That is, by 5.
As a result, the average daily range will be 80 points.
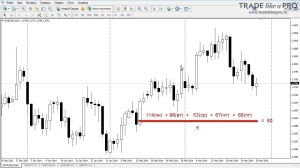
Any other period is calculated in the same way. Let's see what the indicator looks like. It is installed in the same way as any other indicator. If there are any difficulties with this, you can read the instructions posted on our website by using the search. Drop the indicator onto the chart.
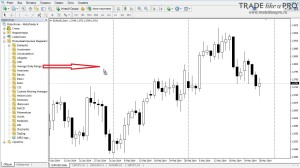
A window with parameters opens.
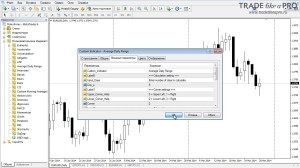
And we click OK. We see several levels and, in the lower left corner, a table with information. Let us call this the auxiliary window.
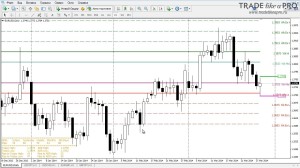
The primary value lies in the two levels that are the ADR boundaries.
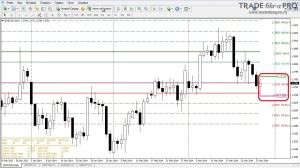
This range shows approximately within what interval the price will move. It shows what potential a currency pair has. The remaining levels are weekly auxiliary levels. They are also calculated on the basis of ADR.
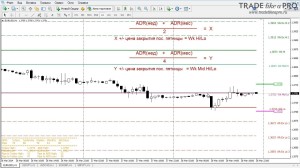
Let us consider how ADR for a week is taken. That is, for 5 days. And ADR for a month, for 20 days. They are added together and divided in half. If we add the closing price of the last Friday to the result obtained, then we get the week high level. And, if we subtract the closing price of the last Friday from the result obtained, we get the week low level. If the sum of the weekly and monthly ADR is divided by 4 and the closing price of the last Friday is added, then we get the week mid high level. And, if we subtract the Friday closing price, then we get the week mid low level. The remaining levels are built further with the same interval as between the week high and week mid high levels.
In the auxiliary window, you can find useful information for yourself. This is the average daily range for the number of days specified in the settings. By default, 5 days. For the previous day. For the week. For the month. And for half a year. It also displays the high and low of the current day and the distance in points from the current price to the high and to the low. It also shows the high and low values of ADR. And the distance in points from the current price to the upper and lower boundaries of the range.
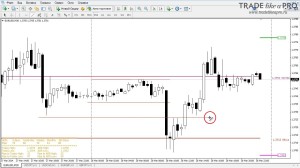
Let us consider how to use all this in practice. At night, when the American and European markets are closed, the market is quite sluggish - flat. And the main trading begins when Europe opens, which we can use and try to enter the market on a breakout of the sideways night movement. On M-30 this trading corridor will be seen better. We draw support and resistance levels. The resistance level almost coincides with the weekly level week mid low. After the breakout of the support level, we enter the market, and our target will be the lower ADR boundary. For better reliability, you can make the take-profit a couple of points smaller, because this is, after all, an average range. It is not some exact figure. It can be either larger or smaller. But, for reliability, it will still be necessary to take a little less. As we can see, the price falls further. And it reaches 1.3702. If you had set a take-profit at this level, the price would not have reached it, literally, by 1-2 points.
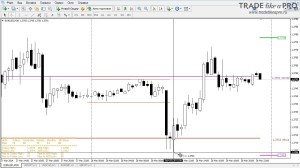
But, after such tails and also a pinbar, I would still close the trade. The price ran into the lower boundary of the range and into the auxiliary level week low, as well as a pinbar. And, it was quite possible to expect a pullback and try a rather risky entry on the breakout of this level.
Take-profit at the level of the upper ADR boundary with a small buffer, and then it would have been possible to count on about 40-45 points. A less risky entry would have been on the breakout of this resistance level.
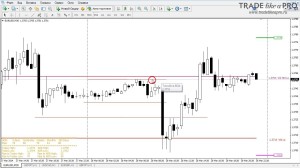
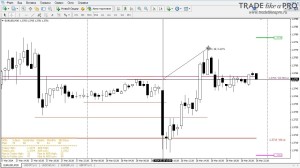
Then it would have been possible to count on approximately 20 points.
Let us consider a couple more entries using the example of the pair: US dollar/Canadian dollar. Here, the 5-day range is 78 points. Let us move to M-30. Since we all rest at night rather than trade, then in the morning, I would have entered on the breakout of this level.
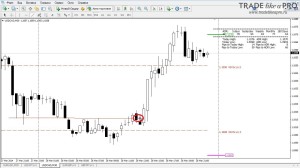
Take-profit at the level of the upper ADR boundary with a small buffer, and it would have been possible to take about 50 points. Which is very good for intraday trading. Also, it would have been possible to try entering on the breakout of such a support level, but this would not have been so successful. And, I still would not have entered, since here the price was already quite close to the lower ADR boundary.
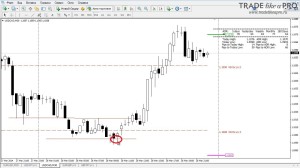
In general, it is extremely important not to buy at the upper and not to sell at the lower boundary of the range. It is also important to watch for news releases before making any decisions and to make an adjustment for the main trend. There are also such moments when the daily range of the 1-2 previous days lags significantly behind the average range. Then one can quite reasonably expect from the market that it will catch up to the normal ADR value.
The average daily range can be used with any intraday trading strategy as an auxiliary or main tool for finding a profit-taking point.
Description of the ADR indicator settings

Calculation option
Day_x - specify how many days will be taken into account for calculating the average daily range
Window location
Corner - specify the location of the auxiliary window (0-top left corner, 1-top right, 2-bottom left, 2-bottom right)
Color settings
ADR_color - text color in the auxiliary window
Daily_Hight_Color - color of the ADR High mark
Daily_Low_Color - color of the ADR Low mark
Display settings (enter "Yes" or "No" manually)
Show_Daily_Hight_Low_Lines - show the High and Low of the average daily range
Show_Weekly_Lines - show auxiliary weekly levels
Show_Mini_ADR - minimization of the auxiliary window
Font settings
Font_Size - set the font size (from 6 to 14)
Vertical_Spacing_Adjustment - sets the line spacing
Download the ADR forex indicator

Best regards, Andrey aka topepo241
TradeLikeaPro.ru