
CSS Indicator - the full power of currencies for your profit

Hello, trader friends! Today we will touch on the topic of currency strength. After all, there are always pairs that move sluggishly, while others show strong trends. What is the reason? It is simply that one of the currencies in the active pairs is strong, while the other is weak. And if we know which currency is the current "favorite," profit will not be far away) The advanced Currency Slope Strength indicator will help us with this.
The CSS indicator is designed to measure the relative strength of currencies. In the first versions of the indicator, only the strength of the two currencies on the chart was measured. But later, the author arrived at a different algorithm that made it possible to measure the strength of all currencies relative to each other. The main advantages of the indicator are ease of use and unambiguous signals. Any strong deviation from zero (in the positive or negative direction) indicates the advantage of one currency over another. Crossing the zero mark means a change in trend. Despite its simplicity, these signals contain great potential and the many years of experience of professional forex traders.
Characteristics of the CSS indicator
Platform: MetaTrader 4
Currency pairs: All
Timeframe: H4, D1
Trading time: Around the clock
Recommended Brokers: Alpari, Roboforex
How the Currency Slope Strength indicator works

The indicator compares the strength of each currency separately relative to all the others. In this regard, if you, for example, compare AUD with USD, EUR, GBP, JPY, CHF, and NZD, then by removing pairs with the Australian dollar from the list, you can get a radically different currency strength chart. For example, to measure the strength of the pound, the values of the slope angles of all pairs with the pound are added together: GBPAUD, GBPCAD, GBPCHF, GBPJPY, GBPUSD, GBPNZD, EURGBP. The resulting sum is divided by the number of pairs, and we obtain the average strength value for GBP. All the specified currencies undergo the same processing.
The calculation uses the algorithm of the TMA indicator. CSS determines the strength of the impulse by the slope angle of the TMA lines. A positive angle value means that prices are moving up, a negative one means down. Depending on the size of the angle, CSS determines the strength of the movement. That is, the steeper the angle, the stronger the price impulse. A zero slope angle means there is no pronounced movement. Since the indicator shows the strength of a currency, a reversal of the lines only means a decrease in the growth rate, not a reversal of the trend. That is, if the angle is greater than zero and is increasing, then the price growth rate is increasing. A reversal of the indicator and the start of movement back toward the zero mark, on the contrary, means a decrease in the growth rate. CSS does not use the slope angles of TMA channels directly, but converts them using its own algorithm, since the averaged TMA values greatly slow down the reaction of the indicator. Therefore, unlike the TMA indicator, CSS reacts faster to price changes.
Signals

Before using the indicator in practice, it is important to understand what exactly it measures. The indicator is primarily intended to measure the relative strength of currencies, that is, the advantage of one currency over another. The indicator does not predict volatility, and the actual price movement after a signal is received may be minimal, or it may provoke a prolonged trend. Currencies with a stronger slope have greater growth potential. Even if the angle value of the stronger currency begins to decline, the currency still has strong potential as long as the value of its slope angle remains greater.
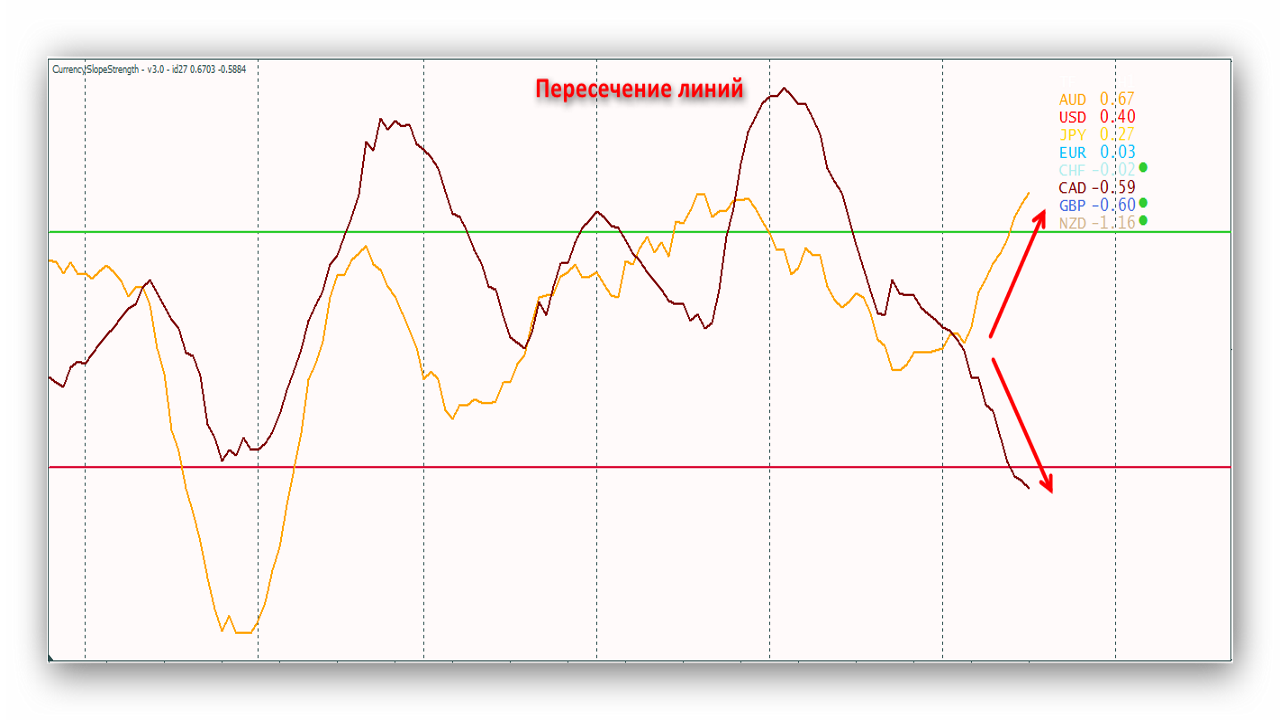
Line crossing
The crossing of two lines indicates a change in the trend direction. The indicator signals the crossing with a vertical line opposite the currency values. If the showCrossAlerts parameter is enabled, an additional sound alert is also given.
Crossings are divided into 4 types:
- Both lines are outside the channel. This indicates that one currency is starting to slow down, while the other, on the contrary, is accelerating. This signal may precede the birth of a strong movement in the market and may become a good moment to open a position.
- The crossing occurred near the zero mark, inside the channel. Since both currencies in this case do not have a clearly pronounced movement, you should not expect large profits from such a signal. This may serve as the beginning of the formation of an upward or downward trend. The best tactic will be to patiently wait for further developments.
- One currency is inside the channel, while the other goes beyond its boundaries. This is a medium-strength signal and indicates the formation of a new trend.
- One currency moves beyond the upper boundary of the channel when the other breaks through the opposite boundary. As a rule, this precedes the formation of a prolonged trending movement. It is not at all necessary for the crossing to happen at one moment; days or even weeks may pass between the crossings. In any case, this is an excellent signal for entering a position.
Parallel movement
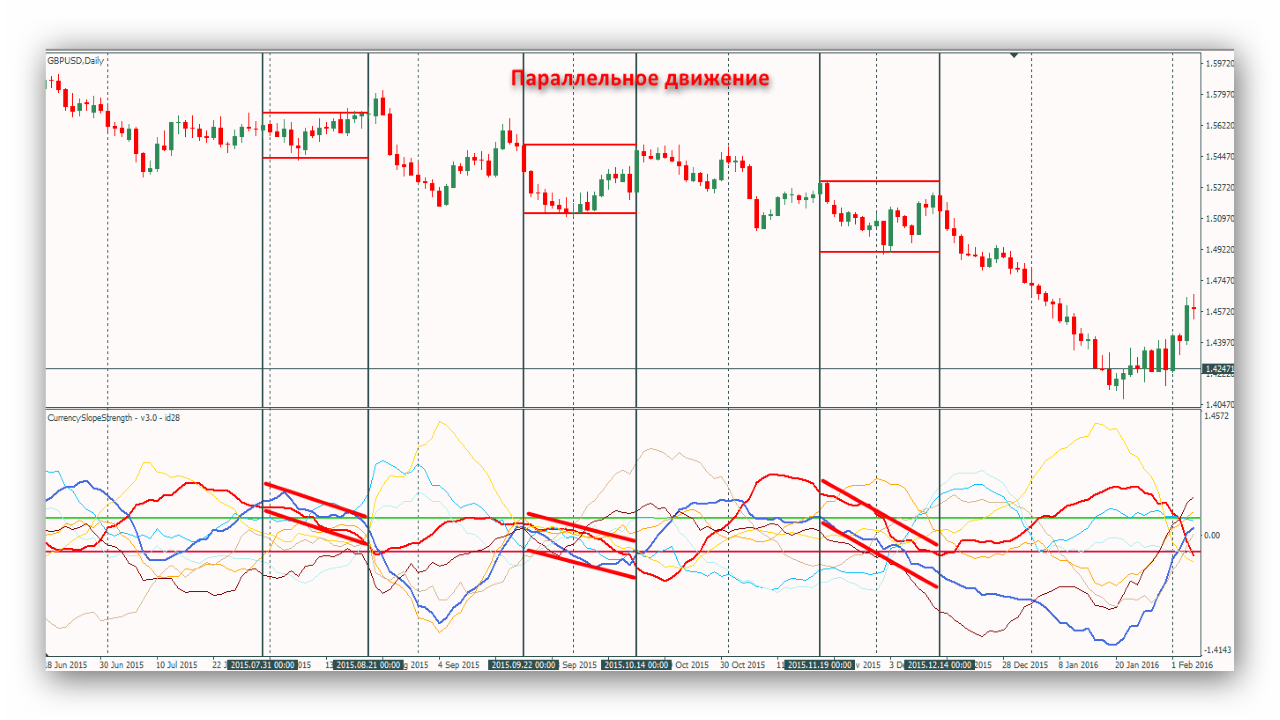
A currency pair is in a flat when two currencies begin moving parallel to each other. In this case, the direction of movement does not matter: the currencies may rise at the same time or fall at the same time. At the same time, the advantage remains with the stronger currency, the one that is higher on the chart (relative to zero).
Crossing the channel boundaries
One of the main signals is the crossing of the +20/-20 lines. The indicator signals the crossing with a green and a red dot, respectively.
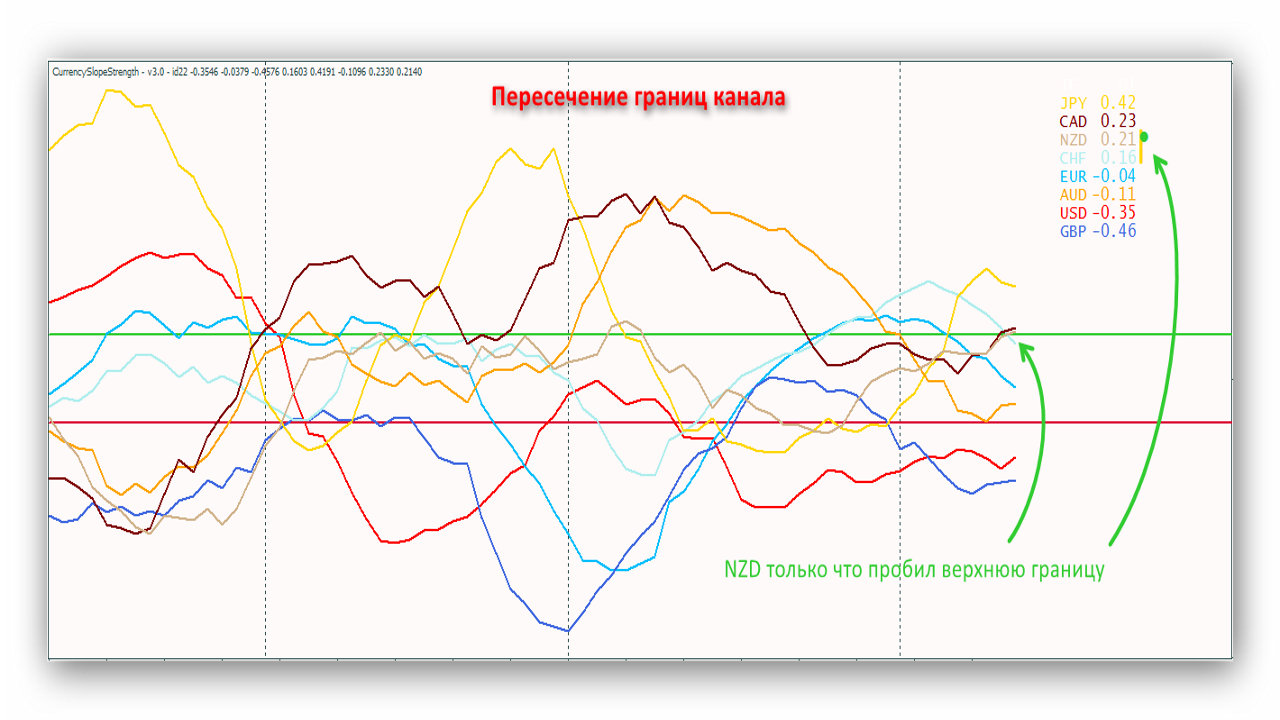
A channel breakout indicates the beginning of the formation of a trending movement. If you trade using a breakout strategy, moving beyond the channel boundaries will help you determine which currencies are preparing for a breakout and in which direction they will move.
Settings

- autoSymbols - when this parameter is enabled, the indicator automatically takes into account all symbols available from the Market Watch. It replaces the symbolsToWeigh parameter.
- symbolsToWeigh - the list of currency pairs for calculation (comma-separated).
- maxBars - the number of bars for calculation. 0 to disable limits.
- nonPropFont - selection of a monospaced font.
- addSundayToMonday - excludes Sunday from the calculation if the daily period is selected.
- showOnlySymbolOnChart - disables the display of all currencies except those that belong to the current symbol.
- autoTimeFrame - automatically selects the timeframe of the current chart. It replaces the timeFrame parameter.
- timeFrame - sets the working timeframe. Supported values: M1, M5, M15, M30, H1, H4, D1, W1, MN.
- extraTimeFrame - an additional timeframe for display on the chart.
- ignoreFuture - disables repainting.
- showCrossAlerts - enables the built-in alert when the lines cross.
- differenceTreshold - when the spread between the lines increases beyond the specified threshold and the showOnlySymbolOnChart parameter is enabled, it changes the color of the indicator background to red or blue, depending on which currency is higher.
- showLevelCross - displays the channel lines.
- levelCrossValue - the value of the channel lines.
- cur - enables the display of individual currencies.
- colour - changes the color of individual currencies.
Examples

Example 1.
As you can see, the yen and the New Zealand dollar often move in parallel, which is shown on the chart as short flat sections. After another consolidation, the yen sharply pulls ahead, after which it crosses the New Zealander and breaks through the upper boundary of the channel - a signal for the formation of a prolonged downward trend on NZDJPY.
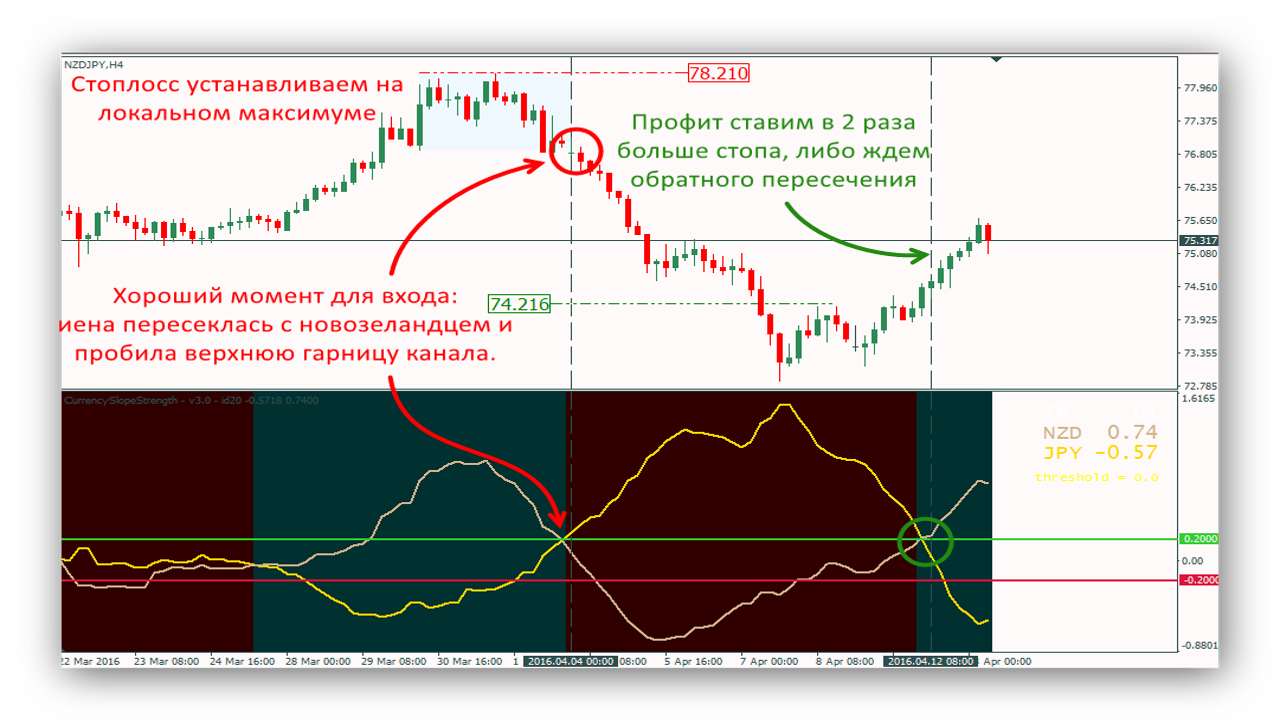
We enter at the crossing of the lines. We place the stop loss at the high of the previous movement. Since the signal is quite strong, the profit target can be set 2-3 times larger than the stop.
Example 2.
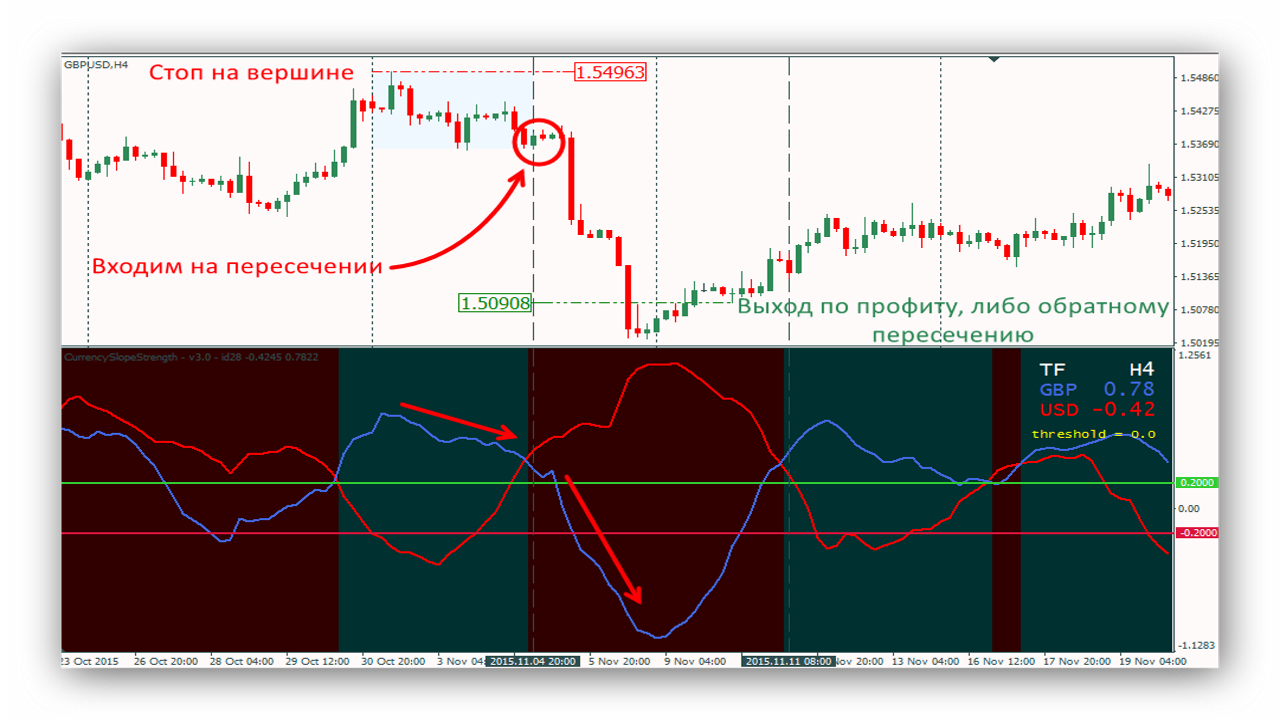
A similar example on GBPUSD. While the pound is gradually weakening, the dollar is gaining ground. The crossing occurs outside the +20/-20 channel, which indicates a clearly pronounced dollar trend - a good moment to enter a position, even without confirming signals. We place the stop at the top of the previous trend or at a local high. The profit target is 2 times larger than the stop.
Conclusion

Thanks to the fact that the indicator is based on a fundamental principle - measuring currency strength - it can be freely used together with almost any other trading strategy. Moreover, when used properly, CSS is quite suitable as a primary trading tool, since it allows you to assess the potential of a particular currency in a pair even at the stage when a trend movement is just emerging. The product went through a long evolutionary path to end up in the form in which it exists now. This development is a good example of close cooperation between true experts in their field - experienced programmers and professional Forex traders.
Download the CSS Indicator

Discussion on the forum
Respectfully, Alexey Vergunov TradeLikeaPro.ru
