
Cryptocurrency Market Capitalization - Understanding the Nuances
 We have all heard about the mind-stirring billions in cryptocurrency market capitalization. Also, many of you have surely noticed the screaming news headlines along the lines of "Bitcoin lost 10% of its capitalization in a day," and you have probably had the thought about the importance of this factor. But is it really so?
The secret is that cryptocurrency capitalization has its own peculiarities. What is different about it and how to use capitalization indicators properly in trading and investing - we will sort it out.
The Essence and Features of Cryptocurrency Market Capitalization

Formally, cryptocurrency capitalization is calculated by multiplying the total number of tokens by the price of one coin (for example, against the US dollar). Then the capitalization of a token that was issued in an amount of 1 billion and costs 1 dollar on the exchange will be 1 billion $. The capitalization of companies whose shares are traded on the stock market or other securities is calculated in a similar way. However, in practice these indicators differ, and this is due, to a considerable extent, to the specifics of the crypto market.
On the stock exchange, a specific number of shares is always traded. In addition, it is almost always known who owns the remaining shares. The asset is liquid and controlled, and the possibilities for manipulating it are limited. Therefore, the capitalization of a company calculated through shares can be considered as objective as possible. If the share price falls sharply, leading to a drop in capitalization, there are always reports on the assets owned by the company (real estate, means of production, etc.).
As soon as it becomes clear that a company's market capitalization is lower than the total estimated value of all the assets belonging to the company, the share price will immediately soar, because it will become obvious that they are "undervalued."
A similar strategy is not applicable to cryptocurrency. This is explained by the fact that most cryptocurrencies are not backed by any tangible additional value. Even in the case when a cryptocurrency is supported by a valuable and popular product (for example, smart contracts and the entire Ethereum system), it is impossible to give it an objective assessment. As a result, the only way to calculate market capitalization is to multiply the token price by their total number.
There are several reasons why such capitalization will not be objective enough, and building a trading strategy on it is illogical.
First, most companies "hold back" a certain share of tokens (sometimes more than 50%) for their own purposes, releasing only part of them for open sale. Of this amount, far from all tokens may be bought up, and some other part will be put away by position investors for the long term.
As a result, after the ICO only 5-10% of the tokens (or even less) will be traded on exchanges. Capitalization calculated on the basis of trading one twentieth of the tokens cannot be objective, because any large investor entering the market can easily collapse the rate several times over.
Second, the cryptocurrency mechanism itself assumes that most of the assets will not be traded on exchanges, but will remain "in the hands" of investors as a long-term investment. A similar situation exists with the STEEM cryptocurrency of the Steemit blogging service with financial support for content and the GOLOS token of the Russian-language analogue service. With these tokens, users vote for the best content, distributing rewards, and to withdraw these tokens to an exchange and sell them will require several months.
As a result, it turns out that relying on the standard cryptocurrency market capitalization figures on sites like coinmarketcap.com is not only meaningless, but can also be dangerous for your wallet. However, one can try to estimate capitalization in an alternative way.
Ways to Assess the Real Capitalization of a Cryptocurrency

In order to assess the real capitalization of a token, one can try to analyze additional factors. According to most analysts, the most objective are the number of network users and the number of transactions in the cryptocurrency. By tracking the dynamics of these indicators over a specific period of time, one can determine the growth or decline of the coin's liquidity and the interest in it. As a rule, the price moves proportionally as well.
Until the summer of 2017, the price of Bitcoin grew in direct proportion to the increase in the number of network users. Then a price jump upward occurred, and the dependence was interrupted. However, the rise in the cryptocurrency rate was accompanied by another objective factor - the growth of volumes.
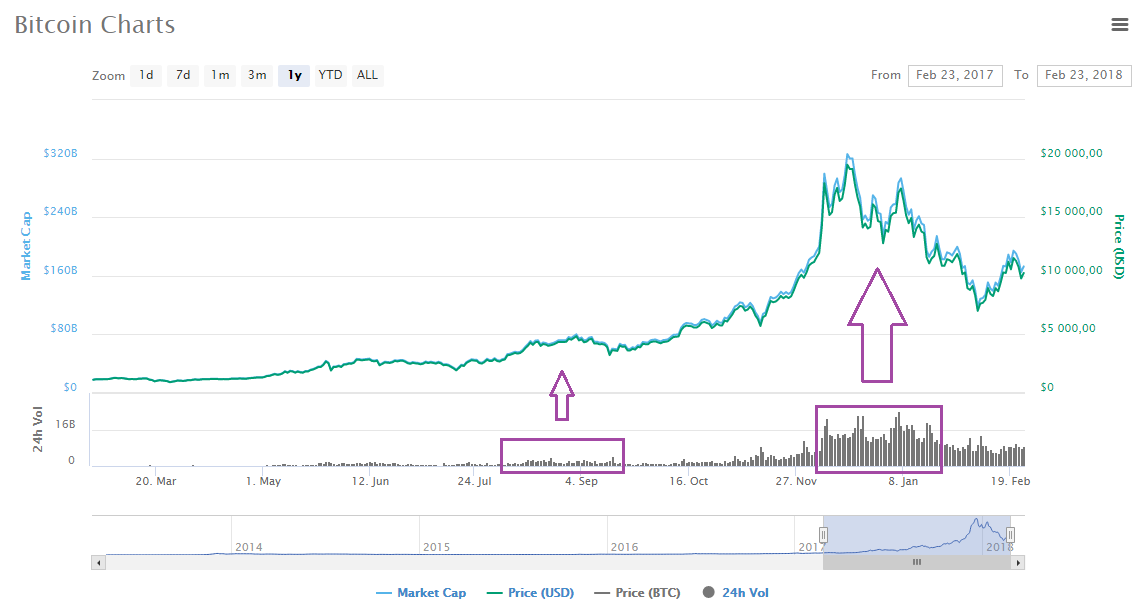 Trading volumes began to grow from July 2017, and at the end of the year they increased another 10 times - in proportion to the growth of the rate. In this situation, the price jump, no matter how phenomenal it was, can be called fair, because it was supported by liquidity. If the price had risen on low trading volumes, this would only indicate that some "whale" was pushing it upward, manipulating the market and taking advantage of the absence of other major players.
However, volume analysis itself is somewhat more complicated than it may seem. Growth in volumes does not always coincide with growth in price, and a sharp increase in trading volumes should not be perceived as a buy signal. Volumes indicate that the price change was supported by a large number of tokens, regardless of whether the price rose or fell.
If one builds a trading strategy on this, then it probably makes more sense to look for divergences between price and volumes and make trades in such situations.
Analysis of Capitalization, Price, and Volume Charts

Before drawing final conclusions, let us look at the charts of several altcoins according to coinmarketcap.com data.
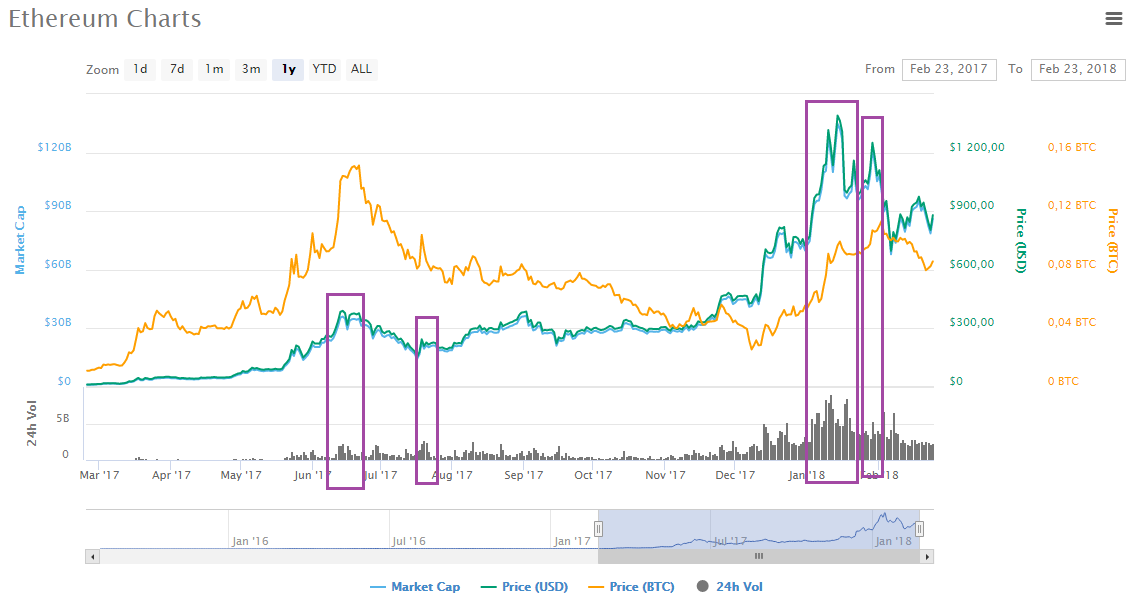 On the Ethereum chart it can be seen that the coin's capitalization chart moves almost identically to its price. On the other hand, price jumps were far from always accompanied by an increase in trading volumes. In the highlighted sections, both times some time after the price grew on high trading volumes, another jump occurred, but already without support from volumes.
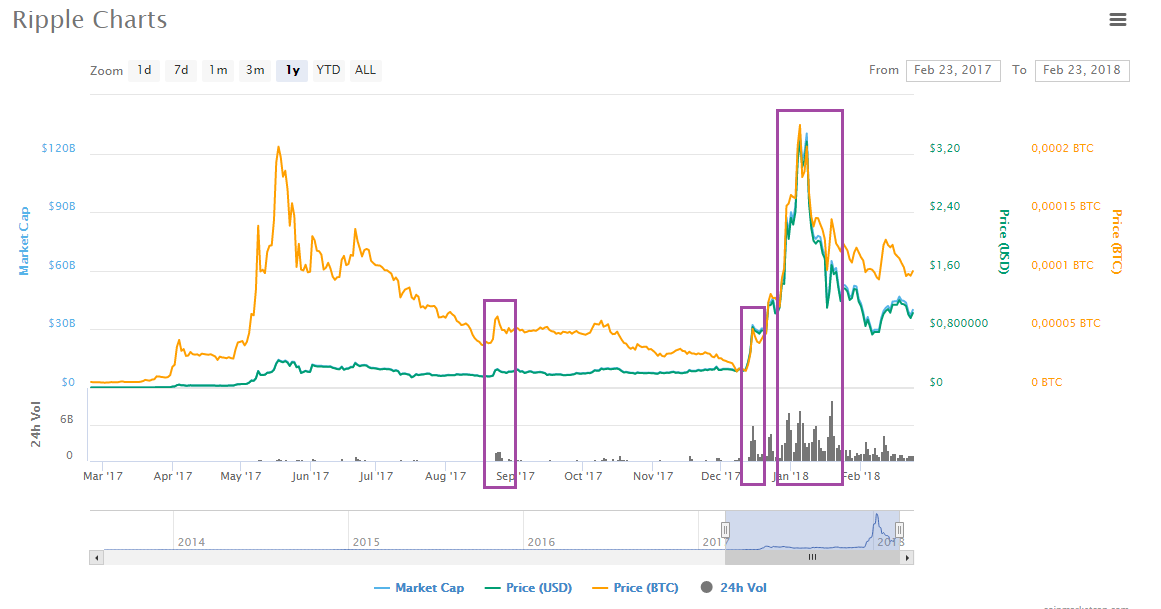 A similar situation is seen on the charts of Ripple, only here both the rise and the fall of the cryptocurrency were accompanied by volumes. Capitalization, just as in the case of Ethereum, correlates 100% with the price chart.
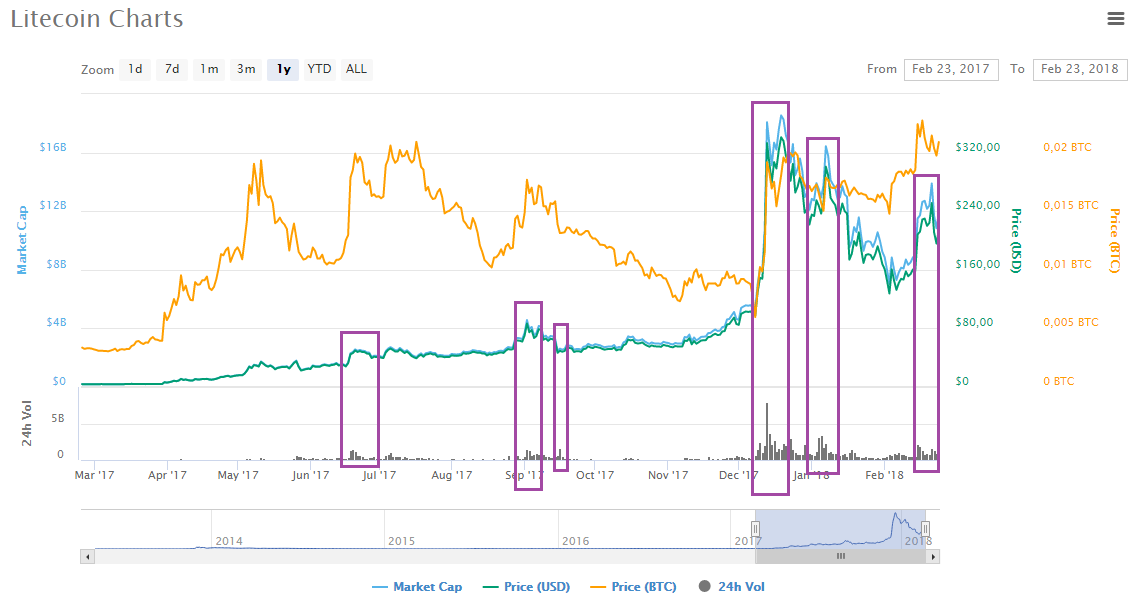 Litecoin was no exception - complete correlation of price and capitalization and chart jumps, sometimes supported by volumes, sometimes not.
Conclusion

The examples considered above confirm the fact that the market capitalization of cryptocurrencies is not only not always reliable, but is also completely useless in predicting further price movement. If its chart repeats price movement 1:1, then capitalization cannot in any way become a leading indicator.
Of the other indicators, the most promising for use in fundamental analysis are volumes. By comparing the dynamics of price and volumes, one can identify moments of divergence, for example, when the price suddenly surged upward without support from volumes. In such a situation, it makes sense to take a short position, because with the arrival of major players on the market, such "overbought" conditions will be quickly corrected, as could be seen in the screenshots above.
Respectfully, Alexey Vergunov TradeLikeaPro.ru
