
Cool Gann Indicators on TradingView
William Delbert Gann (1878-1955) is one of the most mysterious and successful traders in history. He earned millions on stocks, commodities, and futures using an unusual approach: a combination of geometry, time, price, and even astronomy.
Gann believed that markets do not move randomly, but according to strict mathematical laws similar to the laws of nature. Today, Gann indicators (angles, fan, grid, square) are built into all popular platforms: TradingView, MetaTrader 4/5, Thinkorswim.
In this article, we will talk about two truly interesting and popular custom Gann indicators available on TradingView: Gann Box (Zeiierman) and Gann-Fibonacci Swing Toolkit .
The first indicator is timeless classic with a fan, angles, and so on in a very powerful implementation, which immediately after release made it into the Editors' Pick selection. The second indicator is a tool for forecasting price movement that combines classical Gann geometry with Fibonacci ratios.
Both indicators have open code, which allows every user to make the necessary changes.
Gann Box Indicator

The author of the Gann Box (Zeiierman) indicator is Zeiierman, a well-known script developer (21 indicators) followed by 131.5 thousand TradingView users.
The Gann Box indicator was published on February 22, 2024. Despite its age, new users still install it, as shown by the dates of the latest comments. At the moment, the indicator page has gained more than 138 thousand views and 4.3 thousand positive ratings.
Gann Box does exactly what is needed for market analysis using Gann methods.
The indicator automatically identifies the high and low points in the visible chart range and builds a Gann square (or, as it is sometimes not quite correctly translated, a Gann box), the main tool of Gann analysis, between these points, after which the square is divided into segments by percentage levels.
The settings include options for displaying level labels, drawing angles, the Gann fan, and so on.
In addition to the above, there is a possibility of forecasting by extending the square's lines and changing its orientation to test different scenarios.
Ways to Use the Gann Box Indicator
Support and resistance levels.
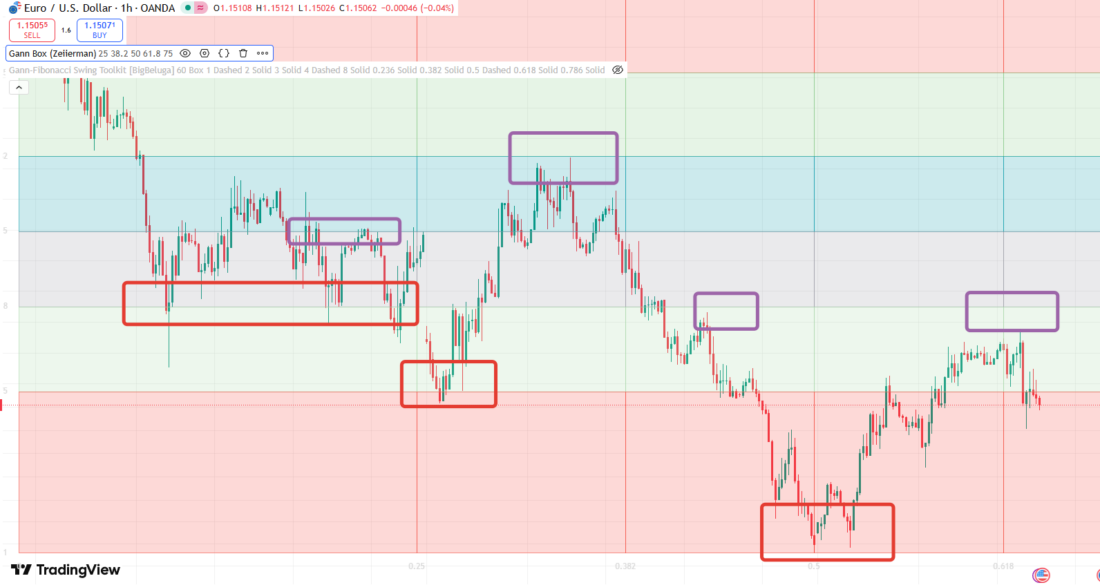
The most popular way to use Gann angles is forecasting support and resistance levels. The indicator forms market boundaries, allowing the analyst to track market movements within the boundaries.
The lines in the Gann square (Gann square / box), drawn at key percentage values, form a grid of potential support and resistance levels. During price fluctuations, these lines can act as barriers that limit price movements.
Empirical experience shows that at these levels the price often stops or even changes direction.
Forecasting using the "Extension" function.
The indicator's ability to extend lines and rectangles into the future gives traders a tool for forecasting potential changes in the market and preparing for them.
Gann Fan (Gann Fan).
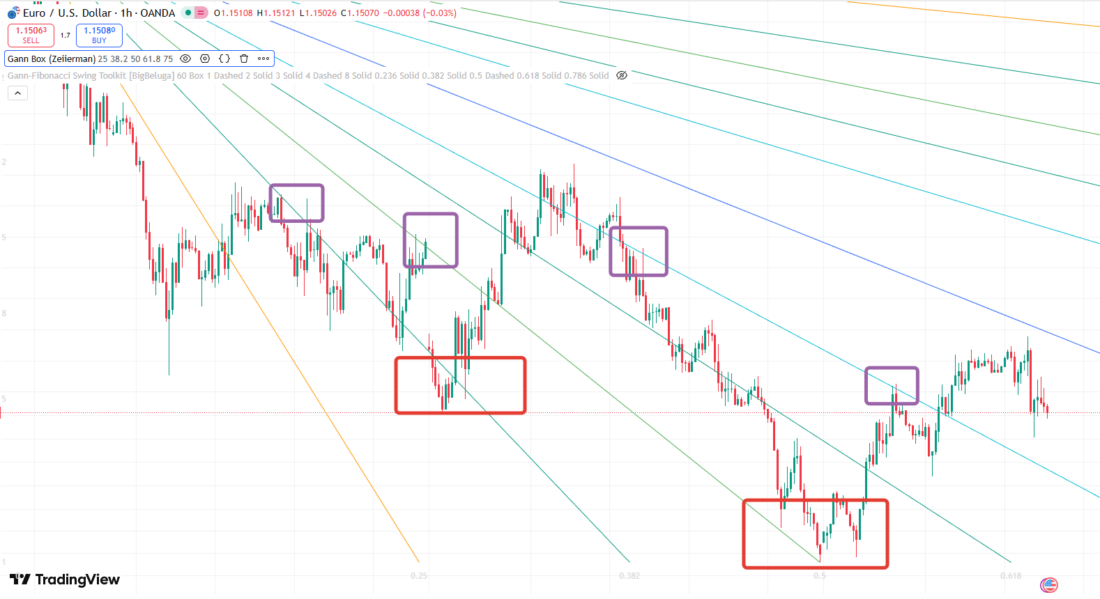
This function draws lines at a significant angle to price, helping traders identify potential support and resistance levels based on the theory that prices move along predictable trajectories.
Gann Curves.
Gann curves show dynamic support and resistance levels, helping to analyze momentum and trend strength.
Indicator Settings
General settings.
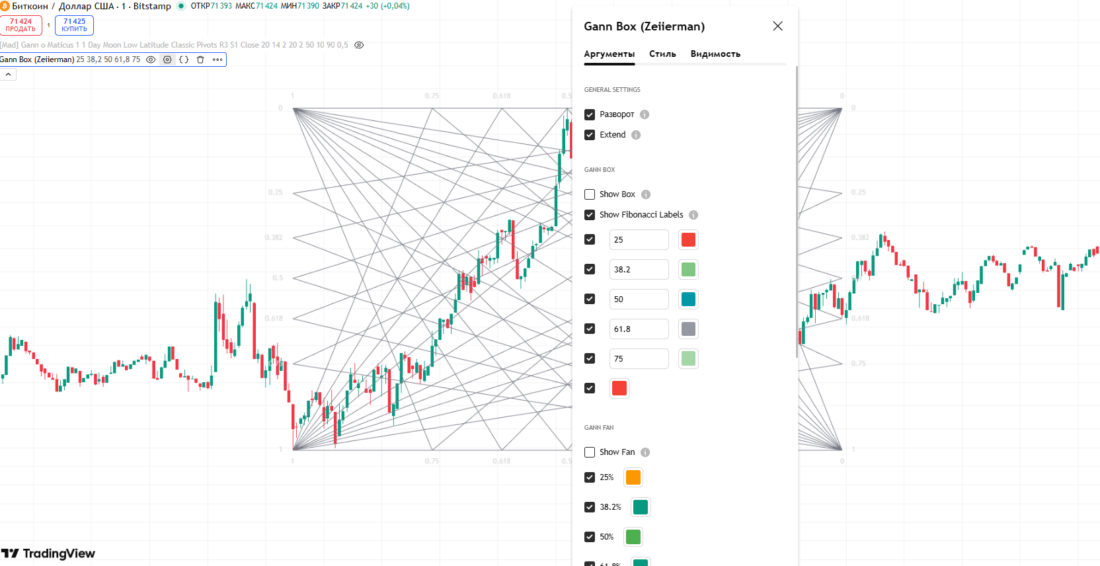
Reverse. This setting changes the orientation of labels and calculations in the Gann square, providing alternative analytical capabilities. Essentially, it reverses the direction of the Gann square, which can be useful in various market conditions or analysis scenarios.
Extend. This setting allows you to increase the length of the Gann square lines or frames into the future. This function is necessary for forecasting future price movements and identifying potential support or resistance levels that lie beyond the current price movement.
Gann Square (Gann Box).
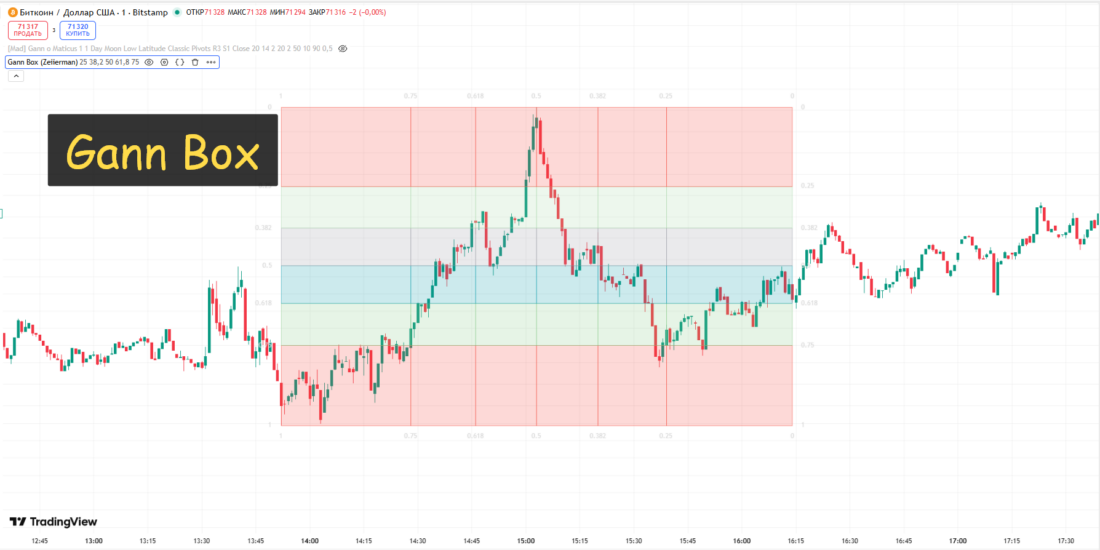
Show square. Enables the display of the Gann square on the chart.
Show Fibonacci levels. Controls the display of Fibonacci labels in the Gann square (enables or disables them in all Gann indicators).
Block visibility. Allows users to enable and disable individual blocks in the Gann Box, making it possible to focus on specific levels.
Percentage levels. Define the Fibonacci levels in the Gann square. Traders can customize these levels according to their analytical needs.
Gann Fan (Gunn fan).
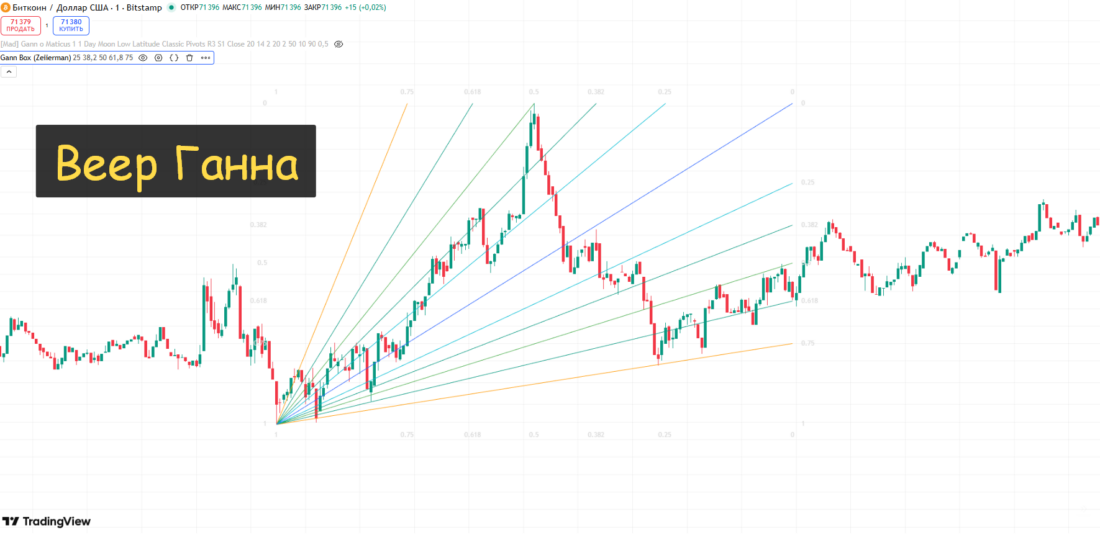
Show fan. Enables the Gann fan, which draws lines at significant Gann angles from a specific point on the chart, helping to identify potential support and resistance levels.
Gann Curves (Gann Curves).
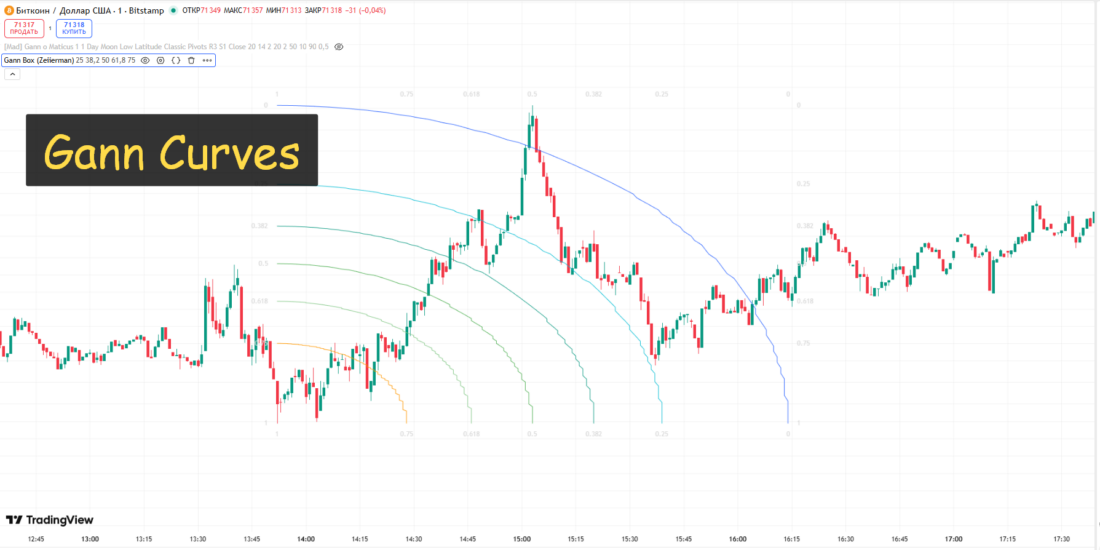
Show curves. If this parameter is enabled, Gann curves are displayed on the chart. These curves are based on Gann percentages and allow support and resistance levels to be tracked dynamically as they change depending on market conditions.
Gann Angles (Gann angles).
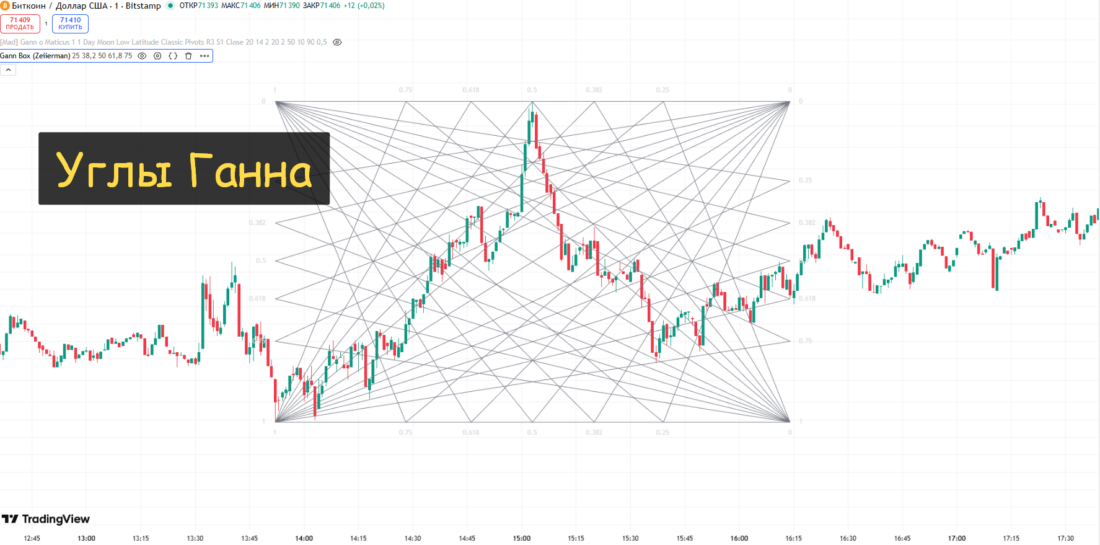
Show angles. Enables the display of Gann angles, which are crucial for understanding price and time dynamics in the market and make it possible to identify future support and resistance levels.
Gann-Fibonacci Swing Toolkit Indicator [BigBeluga]
The author of the Gann-Fibonacci Swing Toolkit indicator is BigBeluga. This author has 74.5 thousand followers and 157 scripts published since the beginning of February 2018.
The Gann-Fibonacci Swing Toolkit indicator was published on February 23, 2026. At the time of writing, the indicator page had gained more than 9.5 thousand views and 956 positive ratings.
According to the developer, they managed to successfully combine Gann ideas and Fibonacci numbers, creating tools for measuring distance (in price) and duration (in time), and creating an indicator in which all projections into the future are based on a real reversal structure rather than on static or manually drawn points.
All calculations begin with a search for confirmed highs and lows. The tool automatically determines a bullish or bearish structure and adjusts all forecasts accordingly. Gann logic is applied to forecast price movement relative to past bars, not just price distance.
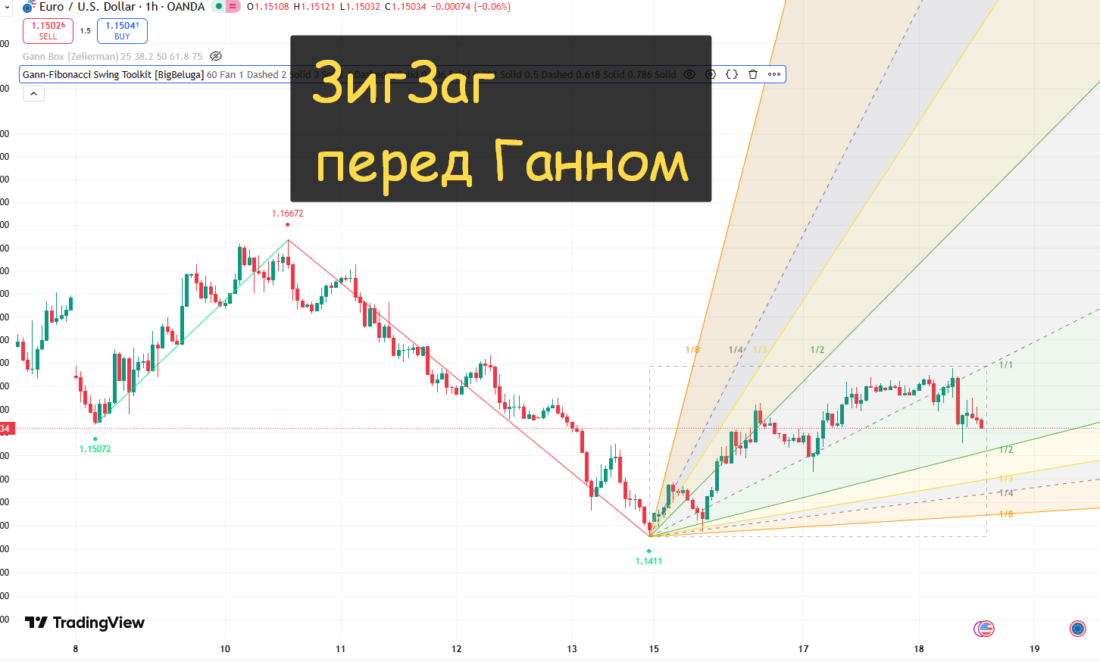
After finding the extremum points (high-low), the script selects the last extremum as the reference point for calculations using the Gann and Fibonacci method. Additionally, the script builds a zigzag, which makes it possible to visually connect the extremes for better clarity.
Gann Fan mode.
When the Fibonacci type = "Fan," the indicator displays dynamic Gann "fan" angles from the reversal point.
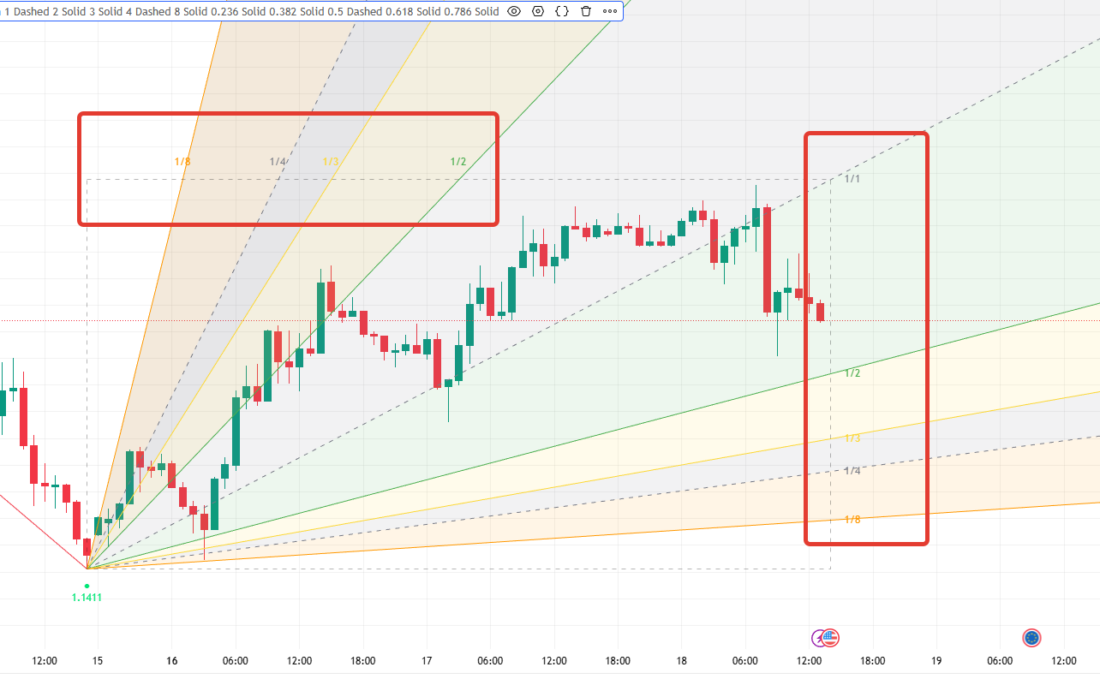
Fibonacci ratios: each Fibonacci line represents 1/x (1/1, 1/2, 1/3, etc.), defining how much price should change per unit of time.
Additional shaded areas between the fan levels indicate zones of price compression and expansion.
Gann Square mode.
When the Fibonacci type = "Square", the indicator then builds a "Gann Square" using Fibonacci retracement levels and time ratios.
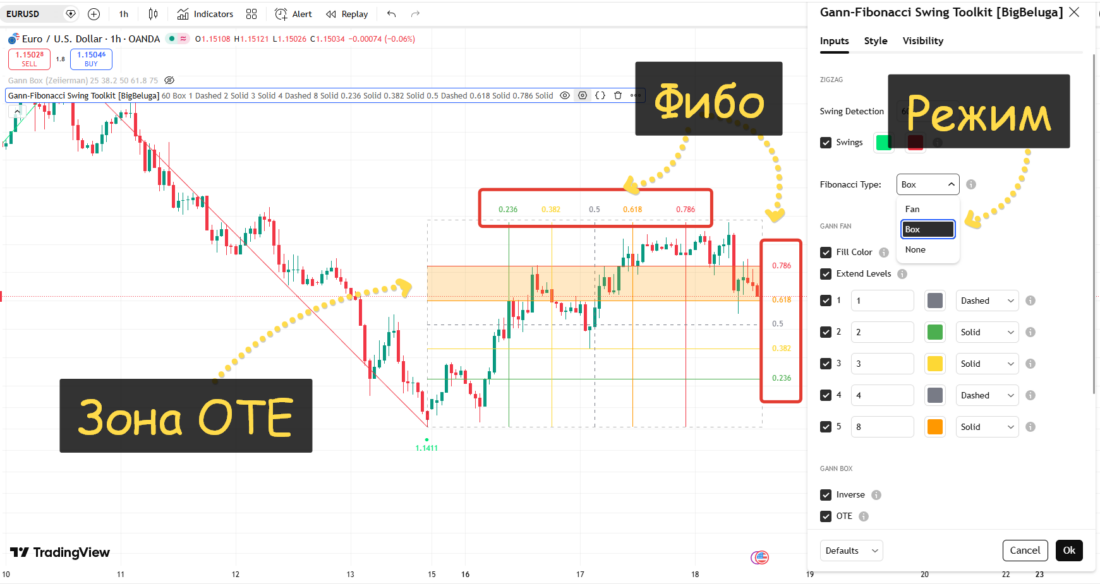
Horizontal levels are Fibonacci price retracement levels (0.236, 0.382, 0.5, 0.618, 0.786) projected onto the swing range.
Vertical levels are Fibonacci time levels applied to the swing duration to estimate reaction timing.
Reverse mode reverses the retracement logic to forecast inverted extensions instead of standard pullbacks.
OTE zone is an additional optimal trade-entry zone (in the developer's opinion) that highlights the premium/discount recovery area.
The dual-axis structure combines price and time into a single geometric structure instead of considering them separately.
Conclusion and Advice for Beginners
William Gann is a trading legend, and today his ideas live on in dozens of scripts on TradingView.
The Gann Box indicator does an excellent job of building all the tools: angles, fan, grid, and Gann square. Depending on the visible zone on the chart, the indicator is recalculated and rebuilt based on new inputs (high and low). I would especially note the importance of the reverse function, which makes it possible to change the prism when performing analysis using the Gann method.
The Gann-Fibonacci Swing toolset helps analyze market structure by combining the Gann square with Fibonacci proportions and tying everything to the real swing structure.
Both indicators are free, open, and work on any timeframe. When studying quotes, it is definitely worth using other methods of analysis as well.
Can They Be Combined on One Chart?
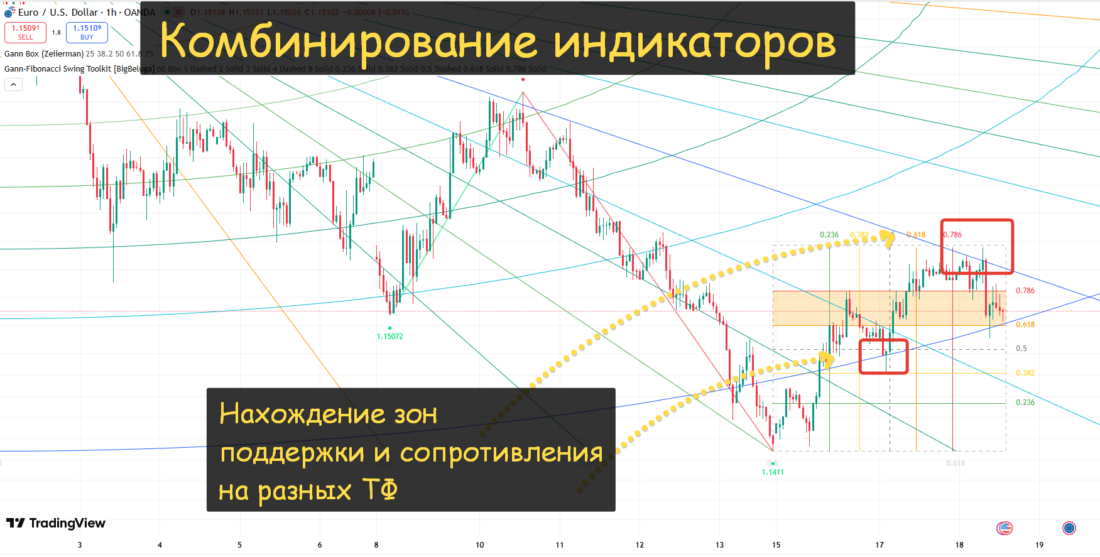
Yes, they can and should. The second indicator is more practical and works only with the latest price reversal on the working timeframe. The first indicator, in turn, builds squares, curves, and so on within the visible area.
Thus, the combination of the indicators allows you to see the structure of different timeframes on a single chart.