
Cluster Analysis in Forex, or How to Spot the Market Maker

Good day.
Forex traders, as a rule, use the classic display of charts in the form of candles or bars. Thanks to this type of data, we can view general information about a candle (bar), such as, for example, the opening and closing prices, as well as the high and the low. But is this information complete? How can we find out what was happening inside the candle and what triggered its formation? How many contracts were sold and bought at each of the price quotes? After all, these data can significantly help us understand price movement and forecast its further movement. Such a method of graphical display and analysis exists, and it is called Cluster Analysis. That is what we will talk about today.
What Is Cluster Analysis

Cluster analysis is a relatively young field of chart and price analysis. As is known, before 2004 information about volumes at horizontal price levels was unavailable to traders. With the emergence of this possibility, specialized computer programs were developed that allow a trader to evaluate the formation of trading volumes, as well as the difference between buy and sell orders inside bars, and to use this information in trading. To perform cluster analysis of volume over a certain period of time means to look inside a candle of a certain time interval and see how volume was formed in it. That is, by looking inside the candle, we can determine what amount of volume was bought or sold at a specific price.
The chart displays detailed information about buyers and sellers. There are always buyers and sellers in the market, and the trading process is a clash of opposite interests: the seller wants to sell at a higher price, and the buyer wants to buy as cheaply as possible. And when they meet at a certain price level that suits both sides, they make a deal at the current price, in other words, they create the tick that we are used to seeing on the chart. A cluster is a price bar, just not in the format familiar to the trader. It shows the price levels at which the volume of trades is visible.
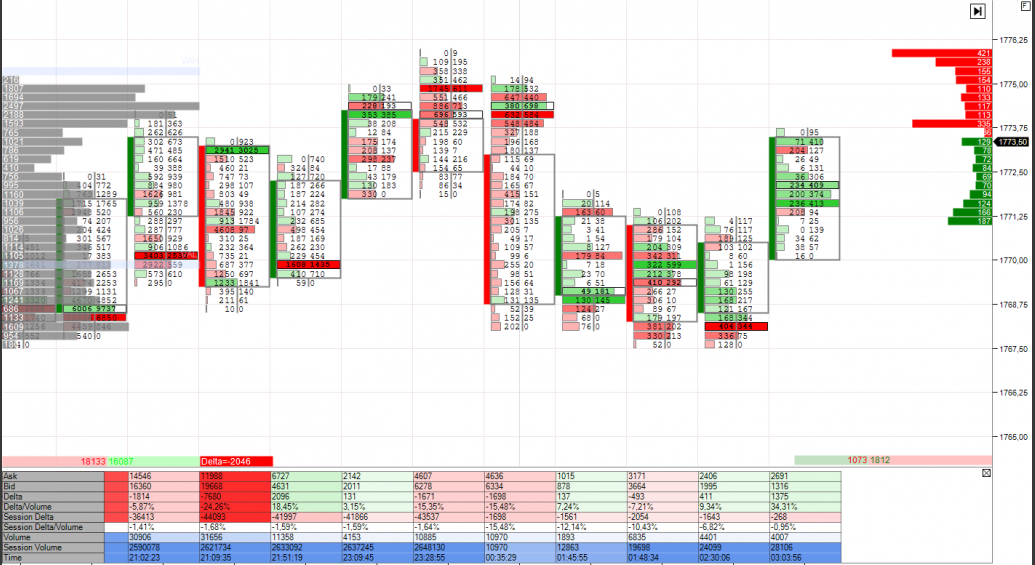
We can observe the following information on the cluster chart:
- the candle's price range (for example 1.2217-1.2225)
- the volume in the number of contracts traded at a specific price
- the volume that passed at the ask price
- the volume that passed at the bid price
- the delta (volume that passed at the ask price minus volume that passed at the bid price)
- the total candle volume (displayed below, as we are used to in MT4)
- the volume profile with the number of contracts traded at each price.
Where to View the Data?
Unlike Forex, all data for instruments traded on the exchange can come only from one source, and accordingly these data (price/volume) cannot differ regardless of how and where they were obtained, provided of course that they were obtained from the exchange and were not filtered.
There are many different platforms in which a chart can be presented in the form of clusters. Today we will look at one of the most popular platforms, and also a free one, called Ninja Trader.
Installation and Settings

http://ninjatrader.com/ru/ - here you can register and download the platform. To do this, you should enter your email, last name and first name, and phone number (in Latin characters). I provide my real data, they do not call or spam the mobile number. The email contains the login and password required to configure the connection.
You can also speed up the registration process using the site http://getanyplatform.com/
The instruction for setting up the Ninja Trader 7 connection is here
You can download the required additional indicators for the program at the end of this post.
Add the indicators via Control Center->File->Utilities->Import Ninja Script
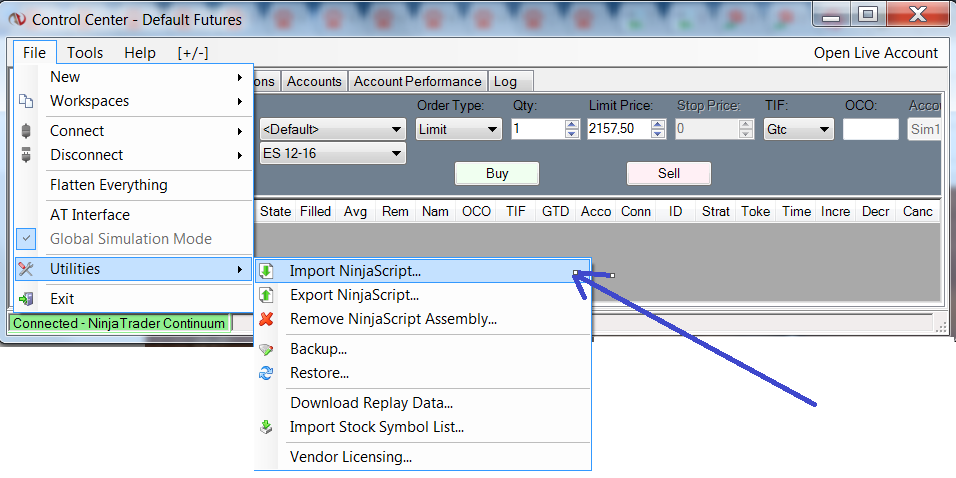
Next, click Yes in the pop-up window and add the downloaded indicators as an archive.
The template needs to be copied with the XML extension into the folder Libraries->Documents->Ninja Trader 7->templates->Chart.
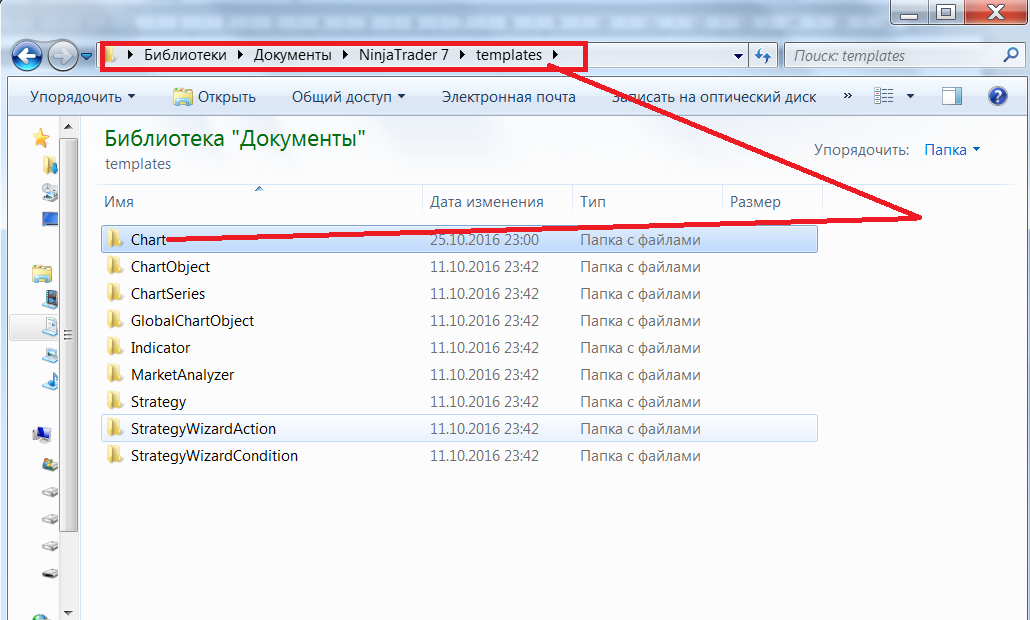
Download the working chart template from the link at the end of the post.
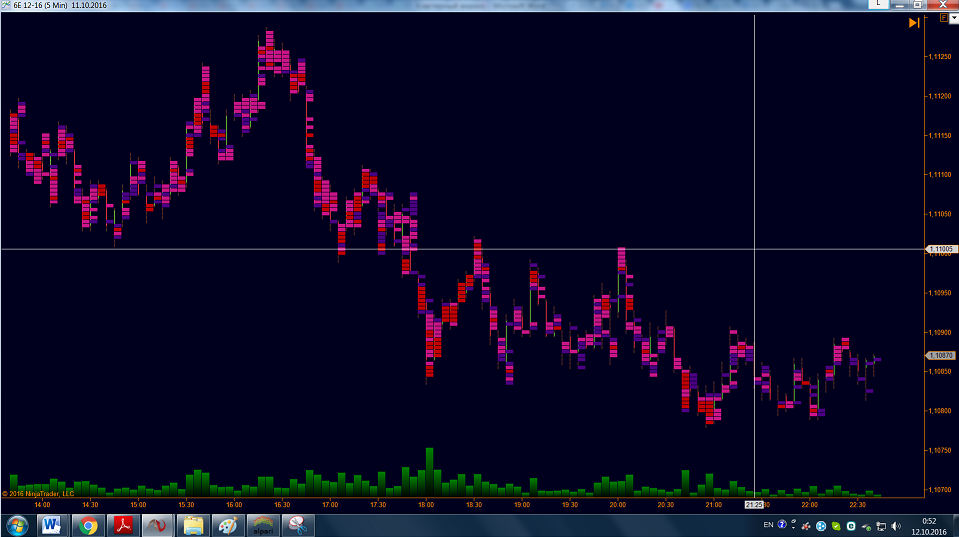
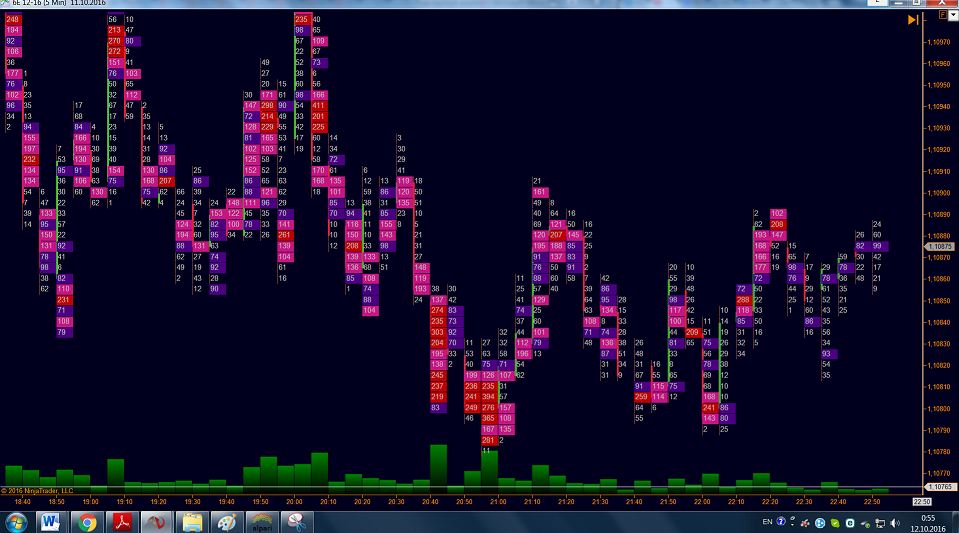
There are various chart and indicator settings here; there will be a separate topic on them. As for the cluster chart in Ninja Trader, it also has a number of settings; mine looks like in the screenshot below. This is the overall picture, and if you zoom in, you will see clusters at each price.
Cell highlights are set separately, that is, for example, >200 contracts is red, >100 contracts is pink, and so on. This is done for clarity, so as not to keep the chart zoomed in and monitor clusters; by color alone, you can immediately determine that the volumes there are above the specified amount, and if you need more detail, then you zoom in and see exactly how many contracts passed in this cluster. For each timeframe, you need to choose which cluster value will be highlighted in color; if you look at M5 values on M60, the chart will simply be one solid color.
Application in Trading
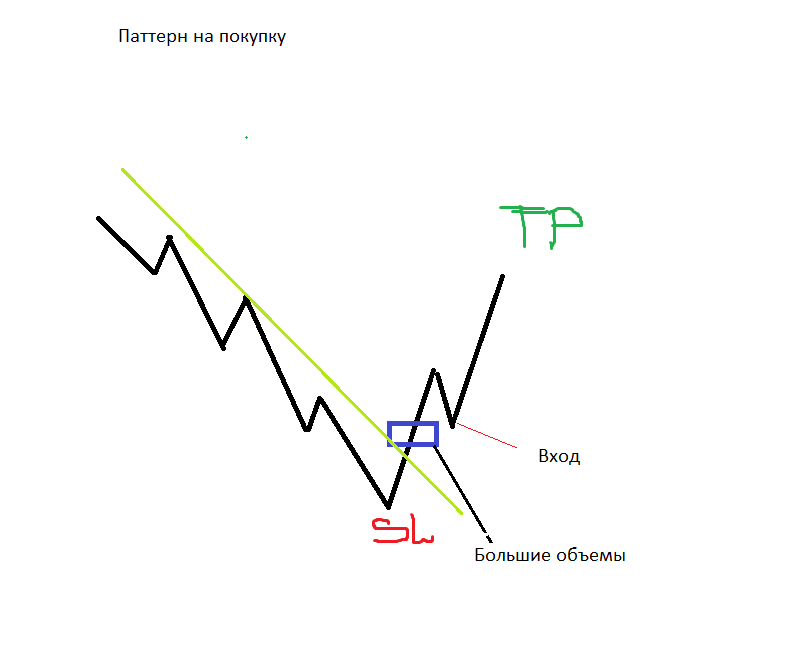
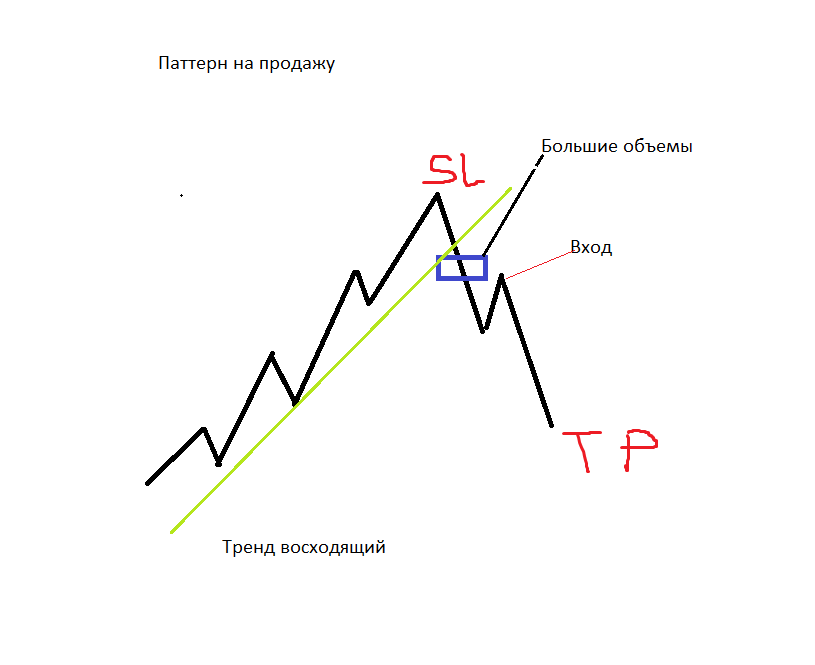
Let us consider a very good, classic working chart pattern: a trend break and an entry on a correction, during a test that takes into account large breakout volumes (large clusters). Schematically, it looks like this:
On Which Currencies Is It Possible to Use Cluster Analysis?

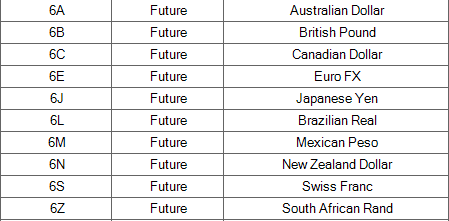
I want to note right away that not all currencies have futures for analysis, so those who like to trade exotics will not be able to find all the required quotes. Below is a list and the codes of futures contracts for currencies available in Ninja:
It is also worth noting that in futures, all currencies are base currencies in the quote, and in this case the dollar is considered in relation to other currencies. Therefore, when analyzing currency futures, this should be taken into account. Here is an example:
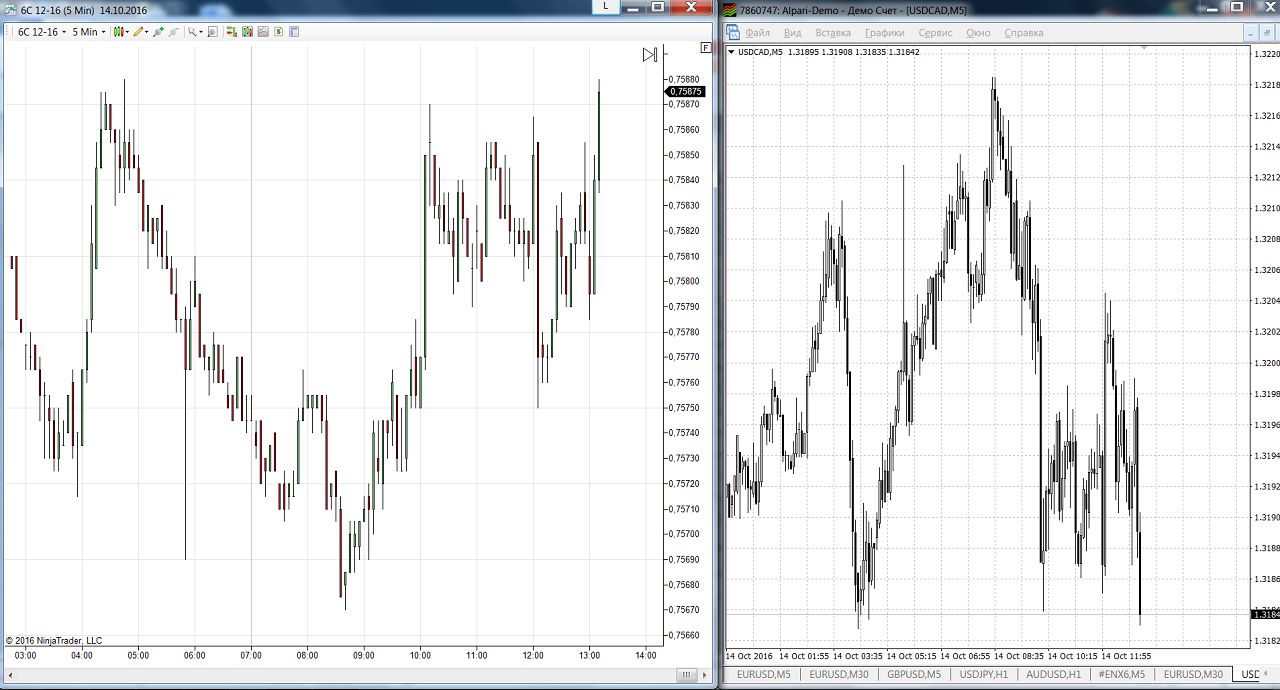
This is dollar/Canadian on Forex and Canadian/dollar in futures. A similar phenomenon occurs with the Japanese yen as well.
Trading Examples

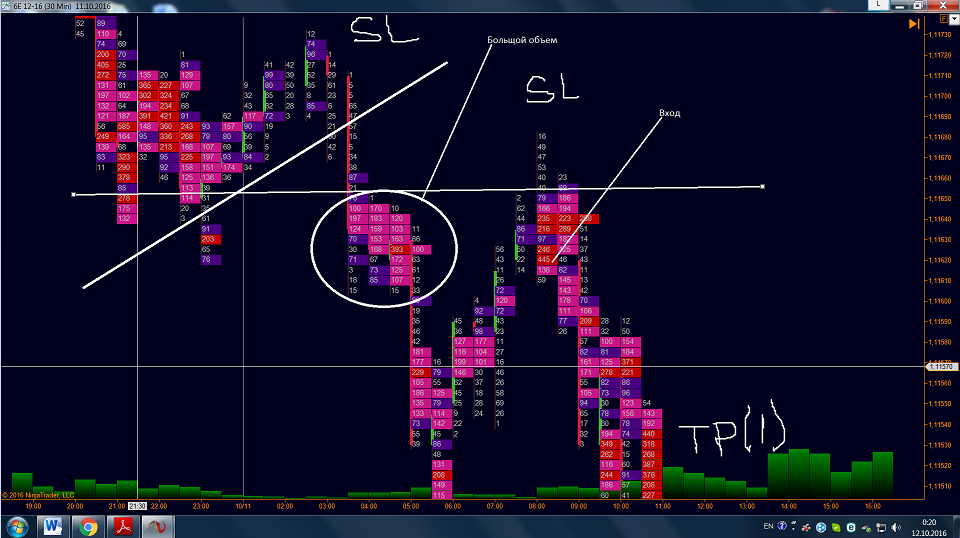
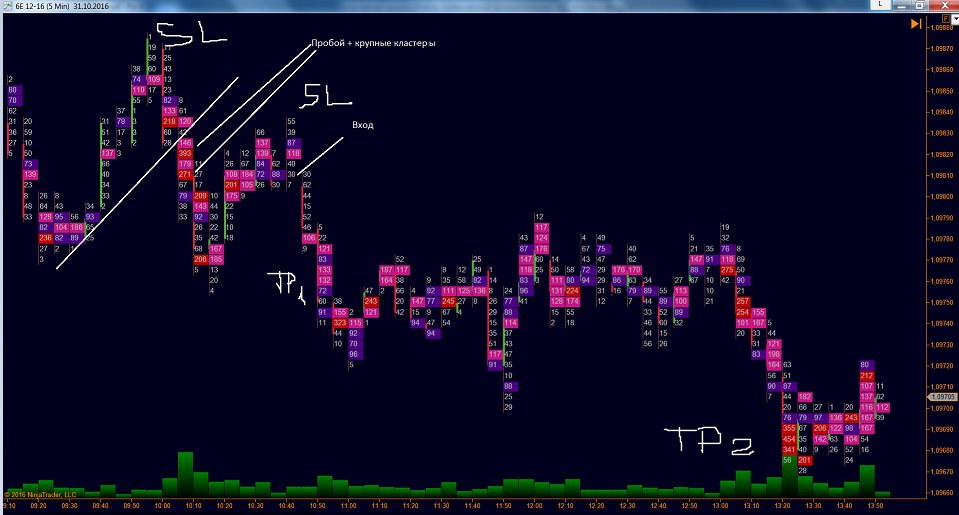
As we can see in the screenshot below (the 6E euro futures), there was a trend break with the formation of volume accumulation after the breakout; then the move down follows and the subsequent return to the volume zone, where large clusters begin to appear. Here we look for an entry with a fairly small stop-loss. Of course, you need to use partial position closing at the nearest level and move the rest of the position to break-even. After that, it is worth watching the further development of the trade.
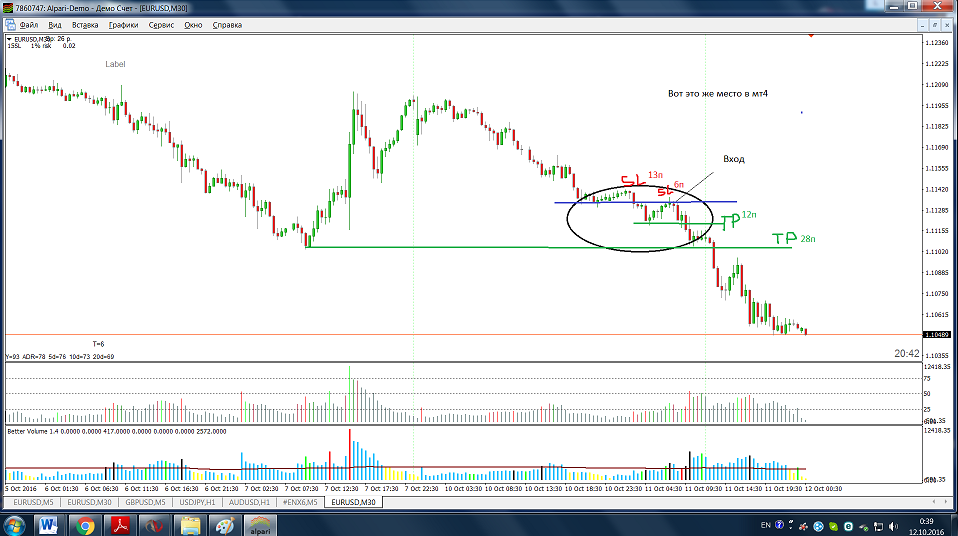
Below is the same place in MT4. We can see that this entry is justified by the existing volumes, and the stop is not placed just anywhere, but hidden behind the volume zones, and if there is an active seller there, then they will defend the zone of their entry, which gives us a statistical advantage of more than 50/50.
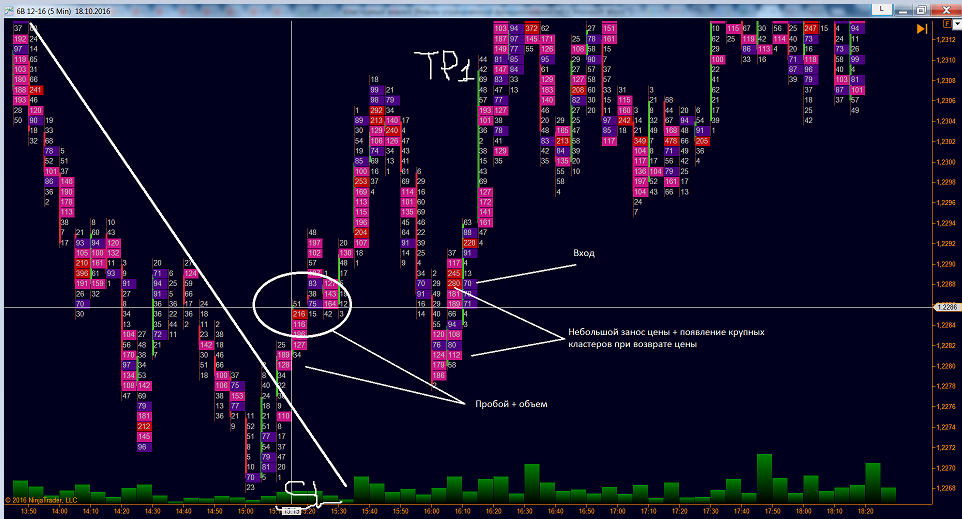
Here is a buying pattern:
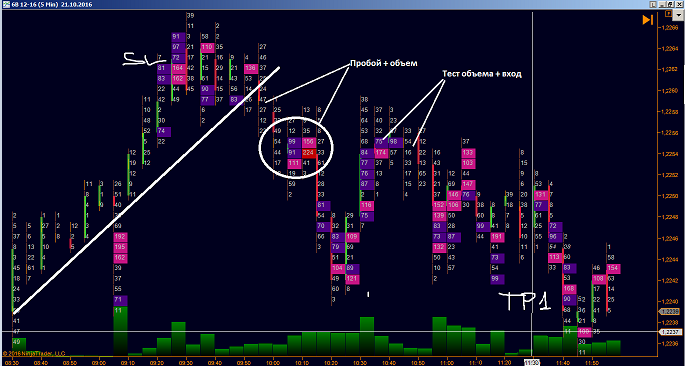
Another example of a sell signal playing out:
Additional Information
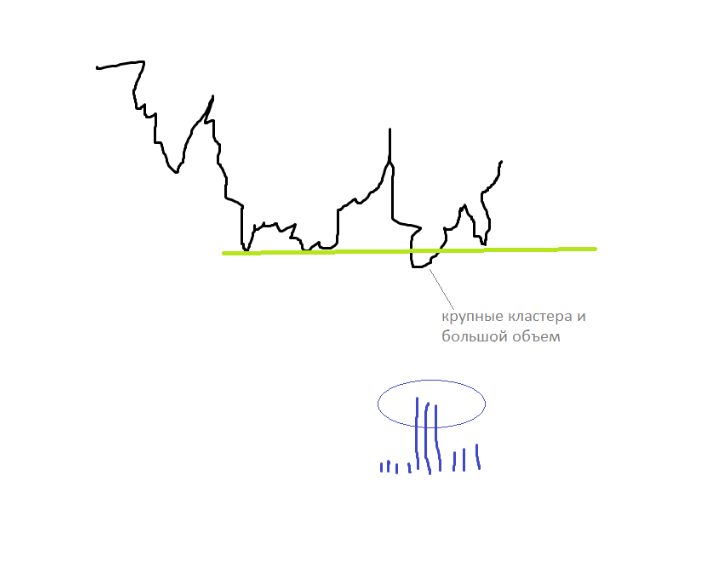
I also want to point out that if, when the price returns to the breakout area where there were large clusters, there is no required reaction, no volumes appear, and the price passes through this area quite easily, then most likely it was a false pushout to collect stops and obtain the necessary liquidity.
On the diagram it looks like this; usually this can appear at significant and historical levels and near good volume accumulation zones:
Here is an example from Ninja:
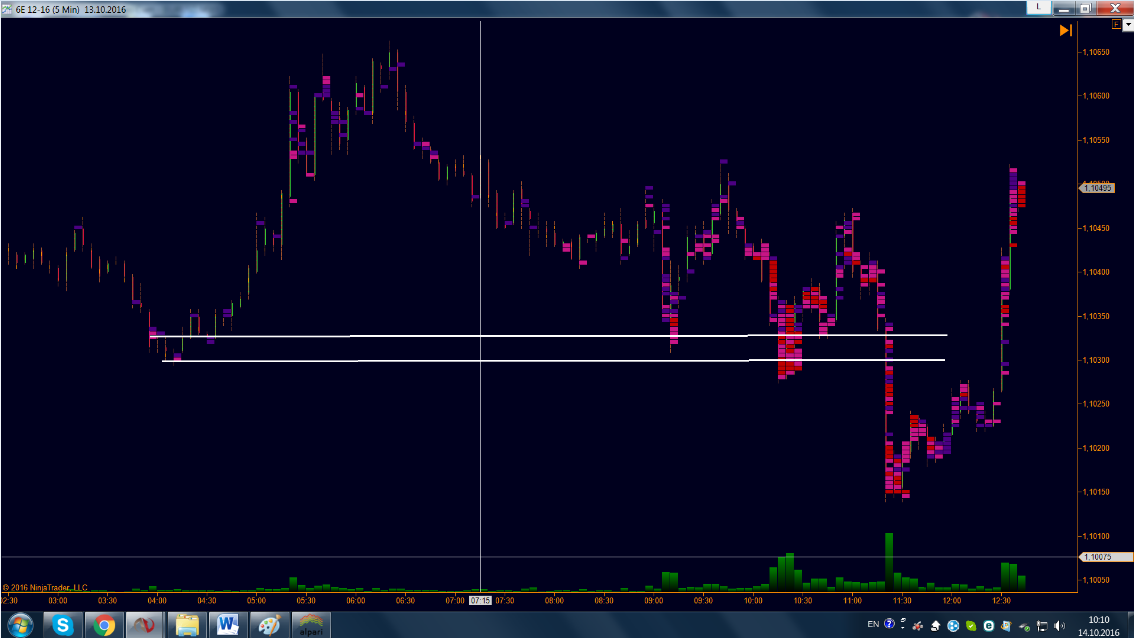
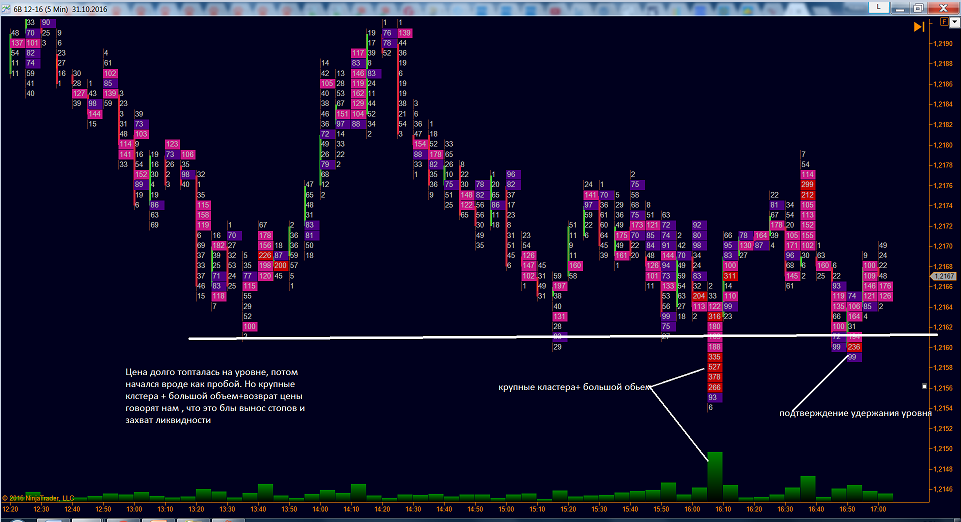
Below we see that it is possible to draw levels confirmed by volume and get a resistance zone that was later broken. When the price returns, there are neither large clusters nor any price stop at the breakout point. Therefore, it can be assumed that a liquidity grab occurred on the stops of buyers and those who entered on the breakout of the level.
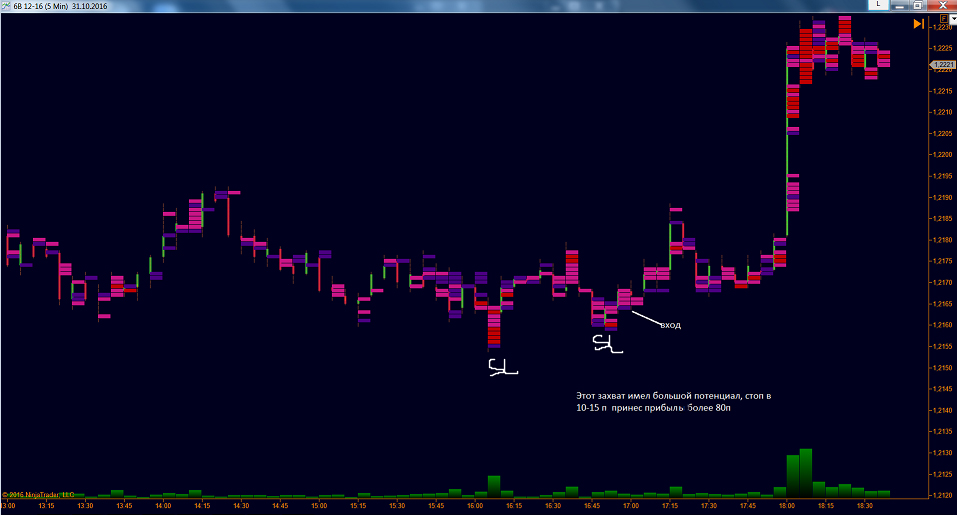
Here is another example where the grab occurred literally in a single candle:
After this false movement, we could observe a very good intraday movement with a good sl/tp ratio.
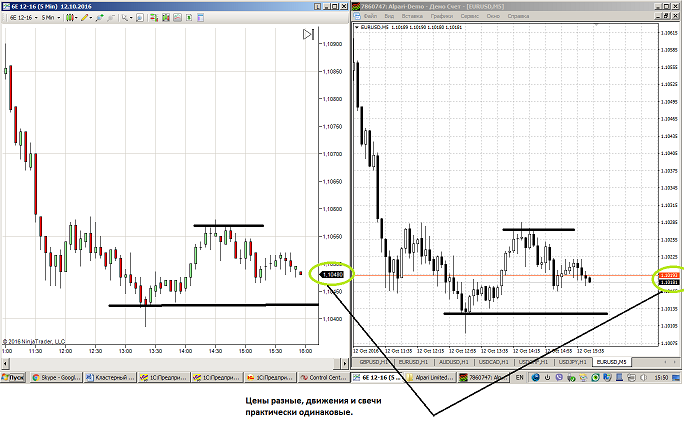
It should not be forgotten that in this case the entry analysis is done on the euro futures (6E), and futures are a derivative financial instrument, a standard fixed-term exchange-traded contract for the purchase and sale of the underlying asset, when concluding which the parties (seller and buyer) agree only on the price level and the delivery date. The remaining parameters of the asset (quantity, quality, packaging, labeling, etc.) are specified in advance in the exchange contract specification. The parties bear obligations to the exchange until the futures contract is fulfilled. Euro contracts have cash-settled status, with deliveries in March, June, September, and December. Futures and Forex spot quotes always differ. Especially when a transition to a new contract is taking place, the difference in quotes can amount to as much as 50 points; over time it decreases to 10-15 points. I want to point out that when analyzing an entry, one should pay attention not to a specific price level, but to the structure of the instrument's movement as a whole, because it usually repeats.
Conclusion

As can be seen from the examples given, cluster analysis gives us the opportunity to enter more meaningfully from support and resistance levels, since these are not just mythical lines that everyone can draw a little differently, but zones that are confirmed by volume.
Of course, cluster market analysis is quite complex; there are many subtleties in it that a trader should learn to notice and take into account, so to speak, with the naked eye. However, with the right approach, cluster analysis can become an excellent tool that allows one to understand the market situation and make balanced and most correct trading decisions.
Download Indicators and Template for Ninja Trader

Respectfully, Alexander Volkov TradeLikeaPro.ru
