
The "Cayman" Indicator - Alone Against the Crowd

Hello, fellow forex traders!
We all know that, in general, the market crowd is usually wrong. All technical indicators, ultimately, try to express crowd sentiment through various metrics in order to understand where the market will go. As a rule, the main reference point for this in the currency market is price, since it is impossible to obtain precise information, for example, about the number of buy and sell transactions carried out in forex due to the absence of a single center for processing information.
But dealing centers do have such data. And today we will examine the "Cayman" indicator, which gives you the opportunity to peek behind the curtain of one of the brokers.
Sentiment indicators are graphical or digital indicators that help determine the opinion of a group of people regarding the state of the market. Speaking of sentiment indicators as applied to financial markets, it should be noted that they show the general mood or, as is often said, the positioning of market participants regarding the future behavior of the price of the instrument being analyzed.
Trading Against the Crowd

The most important question is: what practical benefit can be gained from being able to assess market sentiment? If you learn to correctly evaluate the level of market optimism and pessimism, you can make very good money from it.
For example, when bullish sentiment prevails in the market, it means that most participants are in long positions because they believe the price will continue to rise. Accordingly, when bearish sentiment prevails, it means that most market participants are in short positions because they believe the price will continue to fall. However, as you understand, everything has its limit, so a situation in which all players are buyers or sellers, or everyone is making money, is impossible in the market.
At the first signs of an extremely bullish or extremely bearish mood, a trader should think about protecting unrealized profit and, possibly, opening a position in anticipation of a change in the trend. Key market reversals, as a rule, occur at moments when most market participants (60% or more) are bullish or bearish. In other words, at the very moment when the overwhelming majority of traders begin to believe in the strength of the trend and join it, that is exactly when the treacherous reversal occurs. On the other hand, most of the time the market is in a state of consolidation or a weakly expressed bullish or bearish trend. In such market situations, it is better to refrain from trading altogether.
Determining the Overall Market Mood

Thus, in order to understand what influence the market can have on the financial instrument you are trading, it is necessary to determine the overall market mood. In technical trading, the main principle is studying what market participants do, not what they say and think. So by what means can market sentiment be measured?
First of all, it should be noted that the forex market is a decentralized market, so it is impossible to create a universal indicator that reflects the sentiments and opinions of all forex market participants, since precise and reliable information about the total number and volumes of transactions in this market is absent. However, a large broker whose services are used by several tens of thousands of traders has the opportunity to offer an indicator based on information about the state of open positions and pending orders within the company. A great example is AMarkets, whose number of traders is quite sufficient to determine as objectively as possible the situation that has developed in the market.
AMarkets offers traders a unique development, the Cayman indicator, whose purpose is to identify potential market extremes that foreshadow the beginning of a break in the trend movement. It looks as follows:
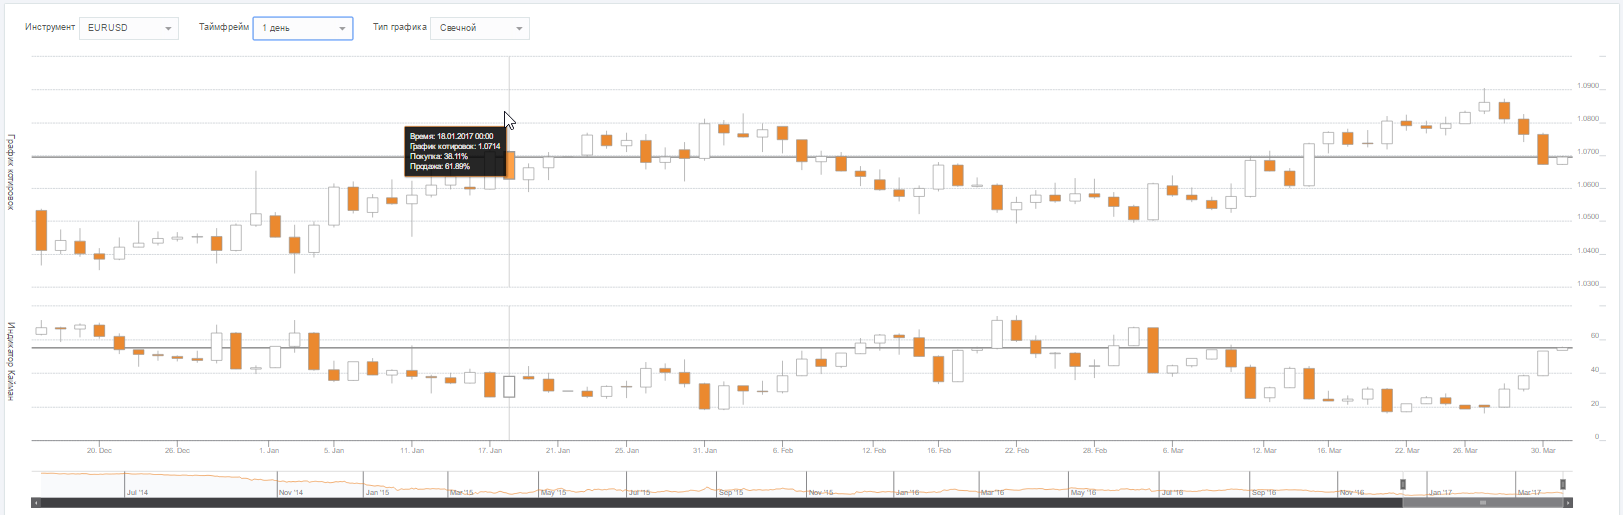 The lower chart is the indicator itself, the upper one is the price chart.
How to Use the Cayman Indicator?

The sentiment indicator shows what percentage of traders are buying and selling a currency, that is, who dominates the market. Cayman allows you to remain on the opposite side of the market crowd, because no one has yet repealed the rule: if you want to trade profitably, remain in the minority.
Cayman has a fixed value range from 0 to 100. If the volume of purchases for a specific currency pair increases, this means that most market participants are buying up the currency. If selling volumes grow, the bet is placed on a correction. It is noteworthy that the extreme values of the range, 0 and 100, are almost never reached.
The market sentiment indicator has its own critical values, the so-called extremes. It is very important to remember that the critical levels differ for various currency pairs. If a currency pair reversed in the past when the number of long positions reached 65%, most likely this value is its critical level, and it is necessary to monitor signals of a possible reversal when it is reached. If another currency pair reversed only when the number of long positions reached 90%, then reversal signals should be monitored precisely when this value is reached.
Let us give an example: for the EURUSD pair, the critical levels are Cayman levels 30 and 70. If the percentage of orders opened in one direction reaches critical values, this can be regarded as a powerful signal not only of a slowdown of the trend and a brewing correction, but also of the probability of a trend change.
Levels 30 and 70 show that the market is overbought or oversold. If Cayman enters the zone from 0 to 30, it is implied that the currency pair has entered the oversold zone, and we wait for the pair to reverse upward. If Cayman is in the zone from 70 to 100, then the currency pair is in the overbought zone, and it is time to prepare for downward movement.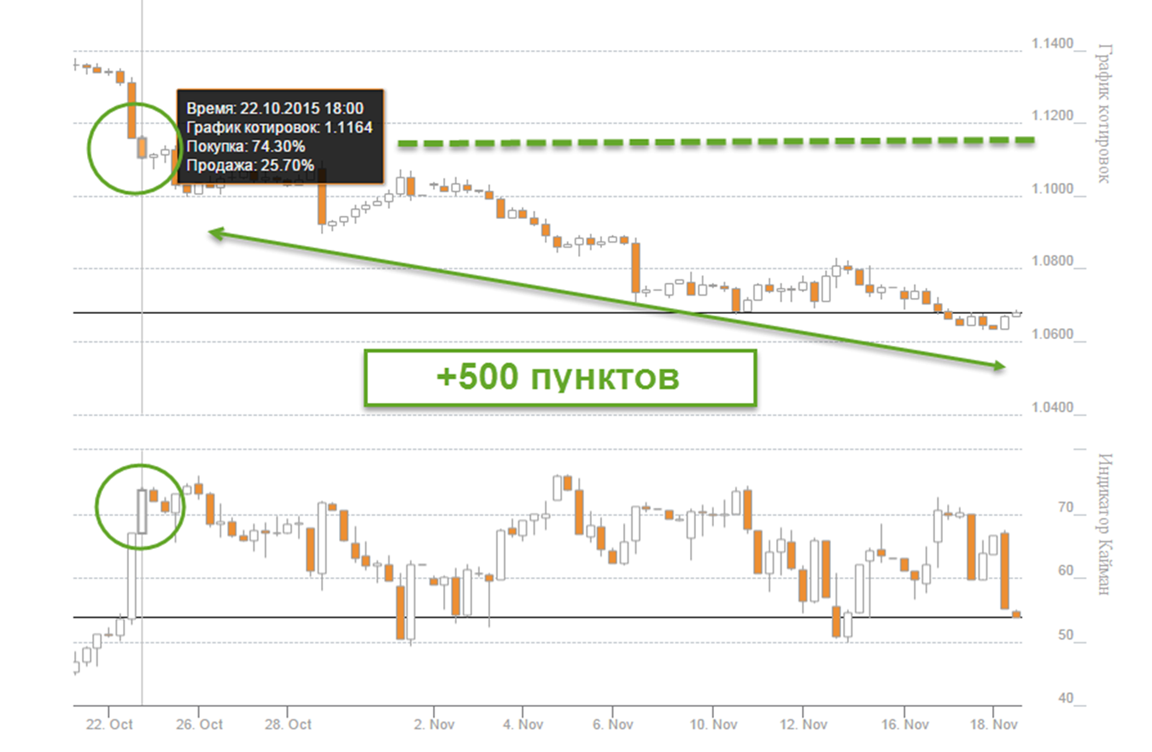 In the screenshot above, you can see how the Cayman indicator for the EURUSD pair reaches the overbought zone at least five times over a fairly short period of time, signaling a high probability of a collapse in euro quotes. This is exactly what happened: throughout the entire month when Cayman remained in the zone from 70 to 100, demonstrating the opinion of the majority that the European currency would rise, the quotes steadily declined. As a result, those who used this indicator's signals were able to earn 500 points of profit.
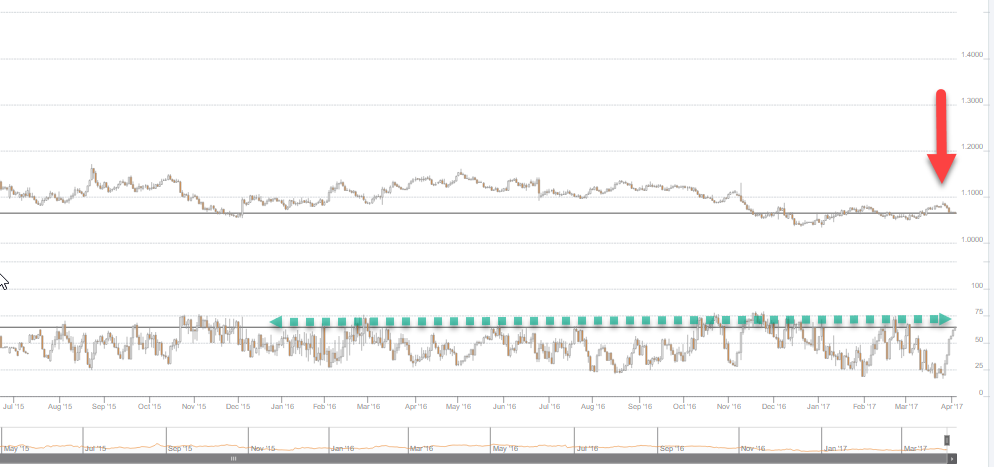 The Cayman chart over a longer period of time also proves that at moments of extremes in bullish and bearish sentiment (levels 70 and 30 for the EURUSD pair), in most cases a break in the trend movement is observed.
For clients of AMarkets, the Cayman market sentiment indicator is available not only in the personal account, but also in the MetaTrader 4 platform, where it is possible to choose any display variant: indicator or widget. This significantly expands the boundaries of analysis and creates enormous opportunities for building trading advisors based on crowd sentiment.
How to Install the Market Sentiment Indicator in the MT4 Platform?

To do this, you need to:
- Download the CaymanIndicator.mq4 indicator file;
- Launch the AMarkets MT4 terminal;
- Select the "File" menu, then "Open Data Folder";
- Go to the "MQL4Indicators" subdirectory and copy the "CaymanIndicator.mq4" file there;
- Restart the AMarkets MT4 terminal;
- Find the "Navigator" area in the terminal; then in this window click the plus sign next to the "Indicators" section. Next, from the drop-down list, drag the Cayman indicator with the mouse onto a previously opened chart with the required currency pair and timeframe.
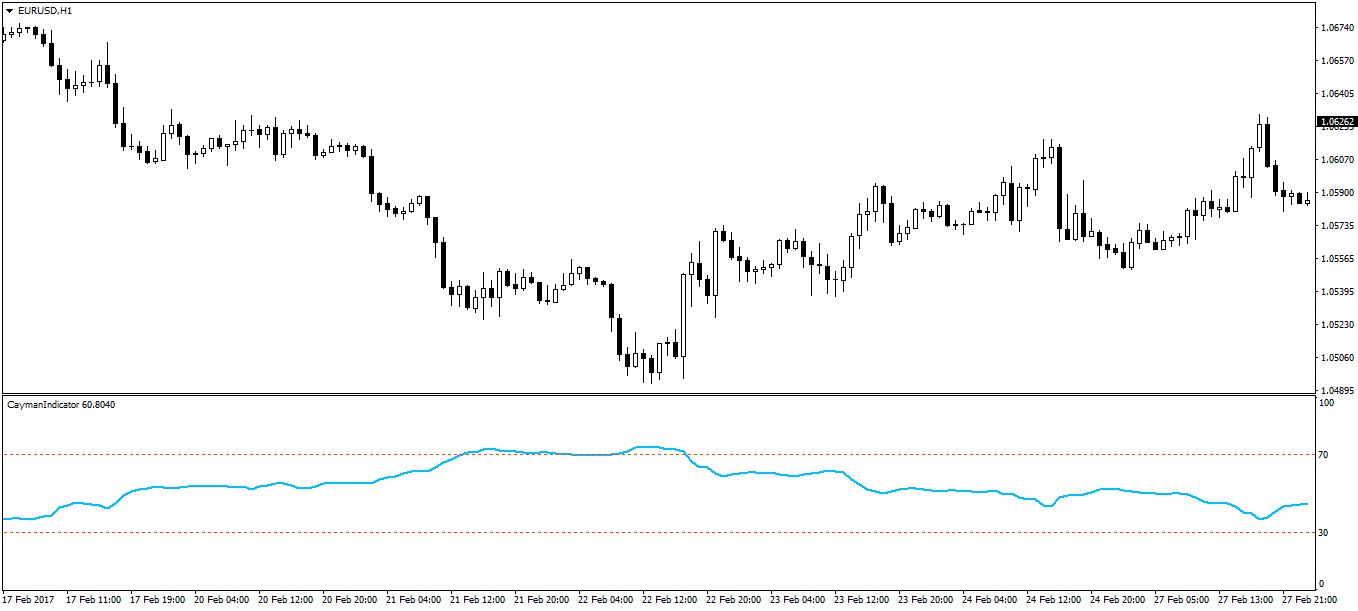 At the moment, the Cayman indicator can work with the following instruments: EURUSD, GBPUSD, USDJPY, AUDUSD, NZDUSD, USDCAD, USDCHF, EURJPY, EURGBP.
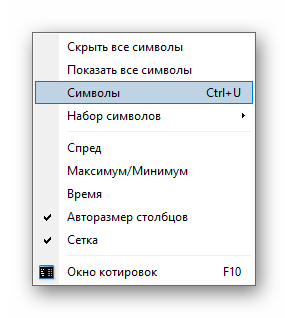
The data is taken from the symbols preinstalled in the terminal, access to the charts of which you can get from the "Market Watch" menu. To do this, right-click in the Market Watch window and select "Symbols".
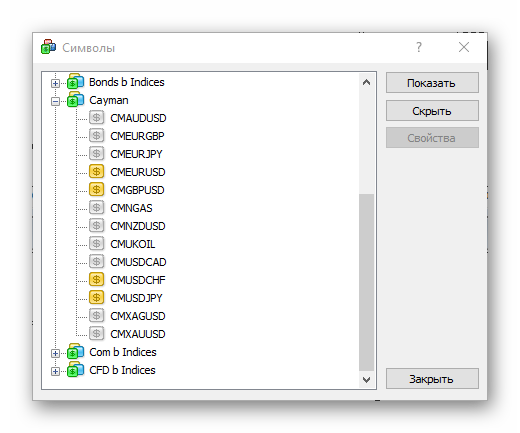
 All instruments available for analysis are located in the "Cayman" section. Double-click the desired symbol so that it appears in Market Watch.
 Now you can open the sentiment chart in the form of candles directly in the MetaTrader4 terminal.
How to install the widget - the current value of the Cayman indicator in the MT4 platform?

The indicator shows the ratio of buys to the total trading volume in percent. For example, a Cayman value equal to 50% means an equal number of buys/sells; 70% means buys prevail;
Widget installation:
- Download the archive with the CaymanVidget.zip widget indicator, unpack it;
- Launch MT4 AMarkets (important: the indicator does not work in the MT4 terminal of other brokers);
- Select the "File" menu, then - "Open Data Folder";
- Go to the "MQL4Experts" subdirectory and copy the "CaymanMarker.mq4" file there;
- Restart the MT4 AMarkets terminal;
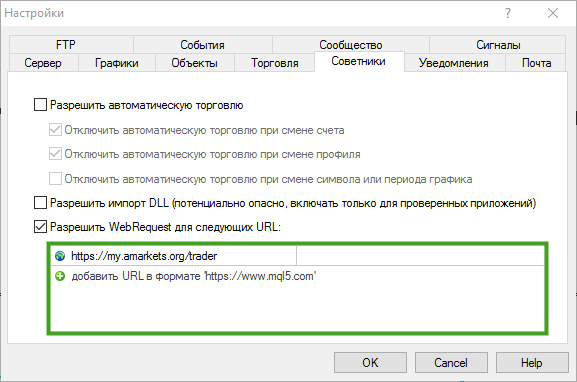
- Select the "Tools" menu, then - "Options", then - the "Expert Advisors" tab. Check "Allow WebRequest for listed URL" and add the URL: https://my.amarkets.org/trader
- Drag the CaymanMarker expert advisor into the chart window.
Those who do not want to constantly monitor changes in market sentiment while waiting for the next extreme to be reached can use the Cayman expert advisor, which is an automated trading system generating trading signals based on crowd sentiment, as well as the oversold or overbought condition of the analyzed pair. You can download the expert advisor in your personal cabinet in the services section - Cayman sentiment indicator. Installation is similar to the installation of any other expert advisor.
Comparison with Myfxbook Community Outlook
Let us try to compare how accurate the data is with an independent source.
A similar service displaying current market sentiment is available on the myfxbook website. The service simultaneously shows the number of long and short positions. In addition, you can choose between displaying the number of positions and the volume involved.
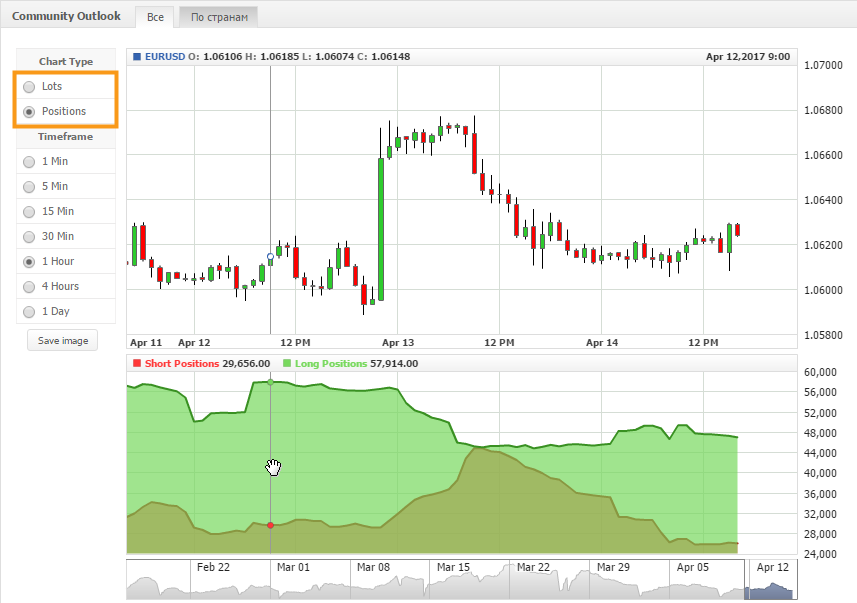 At the top of the page, the exact values of the absolute and relative number of trades are displayed.
 The feature of the service is the display of volumes by country. On the interactive map, you can determine who is trading, in which direction, and with what volume.
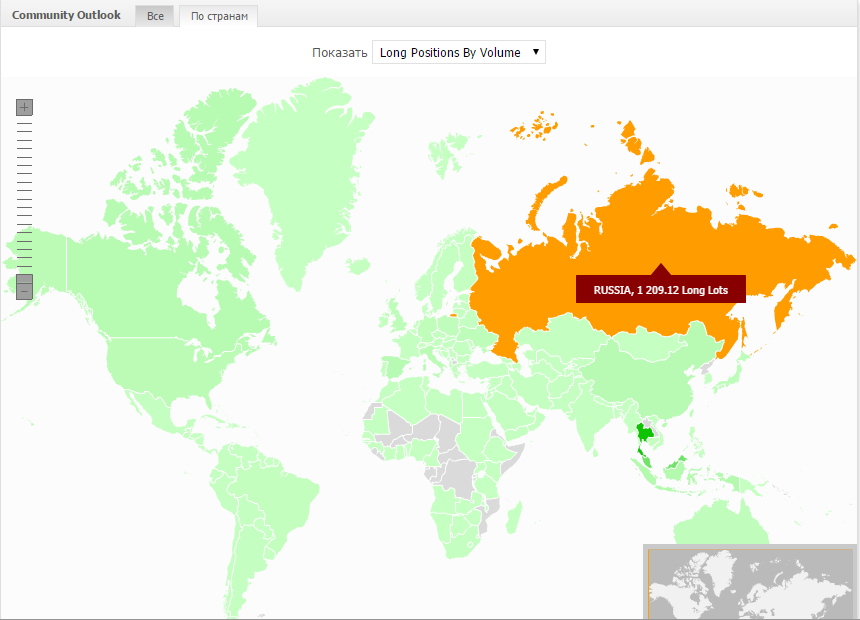 Despite slight discrepancies, the readings generally coincide with the AMarkets sentiment indicator. The difference is that the indicator shows local volumes within the broker, while the myfxbook service makes a comprehensive assessment.
As a result, such spikes of the indicator are not reflected in the myfxbook data at all, but in the end the number of sellers and buyers evens out. In the example on the left are data on the share of long positions in AMarkets, on the right - data from the myfxbook service on the absolute number of long/short positions over the same period.
Conclusion

Of course, the fact that the sentiment indicator reaches its extreme value does not at all mean that the trader should immediately start looking for opportunities to buy or sell. Cayman should be considered as an auxiliary tool indicating the preferable direction of the trade. It is also important to remember that indicators/measures of market sentiment are most effective on daily charts and larger timeframes.
And once again we draw your attention to the fact that since this indicator is an exclusive development of Amarkets, it can be downloaded from the personal cabinet on the website of this broker.
Respectfully, Alexey Vergunov TradeLikeaPro.ru