
Candle Temperature Indicator – Clear Levels for Scalping
 Greetings, ladies and gentlemen forex traders!
As is known, the market is subject to the same physical laws as the rest of the world around us. When “cooling down,” price stops forming natural barriers, as a result of which the rate does not feel strong resistance when moving in either direction. When “heating up,” price forms a solid support that is much harder to overcome.
Some time ago, the idea matured to create, on the basis of these assumptions, a special indicator that would display cold and hot price flows in real time. Especially for tradelikeapro.ru readers, we present a working concept of an indicator for displaying the “temperature” of a candle.
Indicator Characteristics
Platform: MetaTrader4
Currency pairs: any
Timeframe: any, preferably M1
Trading time: European and American sessions
Indicator type: tick volumes
Recommended brokers: Alpari, Roboforex, Exness
Main Idea
It is no secret that horizontal levels play a major role in market analysis. One way or another, practically any trading system takes levels into account, even if the main signal is given by some technical indicator or by a fundamental component.
The indicator itself shows on the chart at which levels the highest tick volume was observed. In the preset spectrums, yellow indicates the highest temperature. That is, the closer to yellow the color is, the greater the tick volume value at a specific price level.
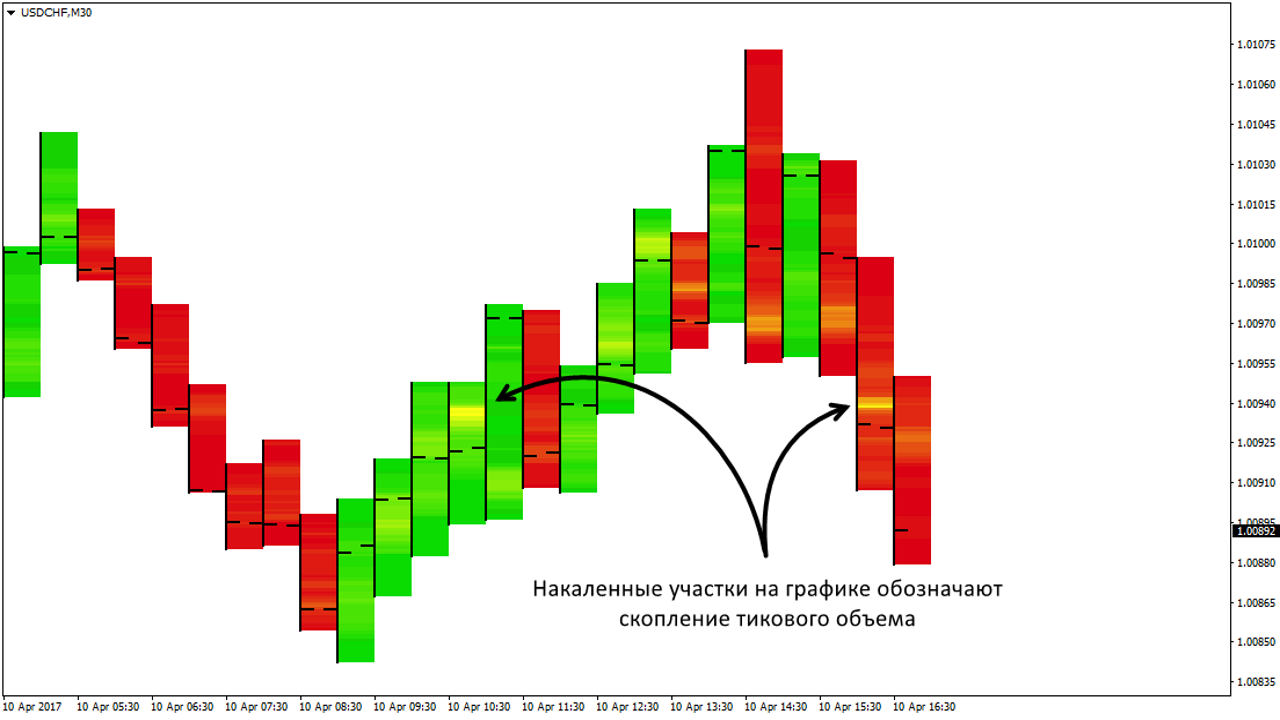 The indicator is ideal for scalping strategies, where traditional “wide” levels are not so appropriate. A short-term key level can form within a single candle. At the same time, repeated confirmation of the level only strengthens the signal.
By default, tick volume is taken from the minute timeframe, but you can specify any other TF. The indicator also has several display settings for more convenient perception of information.
Indicator Settings
In general, the indicator does not require configuration as such, since the calculation algorithm is fundamentally very simple. Nevertheless, there are several parameters that can affect the visual display of temperature.
- MaxMinVolume_AllCandles – this parameter affects the way the maximum volume is calculated. “true” – the maximum volume values are calculated based on all candles involved in drawing (SumBars). Keep in mind that this parameter is suitable only for analyzing historical volumes, since when a new bar appears the old values will be recalculated. “false” – the maximum volume value is calculated based on a separate bar. Past indicator values are not redrawn;
- CandleShadow – display of temperature only on candle shadows. Useful for analyzing rebounds from levels;
- CandleBody – display of temperature only on candle bodies. Useful for analyzing level breakouts;
- BullSpectrum – choice of spectrum for bullish candles;
- BearSpectrum – choice of spectrum for bearish candles (you can choose one spectrum for candles of any type);
- DrawSize – size of the candle cell (in pips);
- VolumeTf – source timeframe for calculations. To obtain a more accurate result, it is desirable to leave the smallest possible TF (minute);
- SumBars – number of candles to display on the chart.
Usage Tips

In fact, you can decide for yourself how to interpret the signals given by the indicator. The main thing is to understand what is special about the analysis of tick volumes. With the help of the indicator, you can determine at which levels trading was most active. Naturally, it will not be possible to determine what volume of currency was actually traded.
First of all, pay attention to the accumulation of volumes at specific price levels. The more repetitions, the stronger the level under consideration.
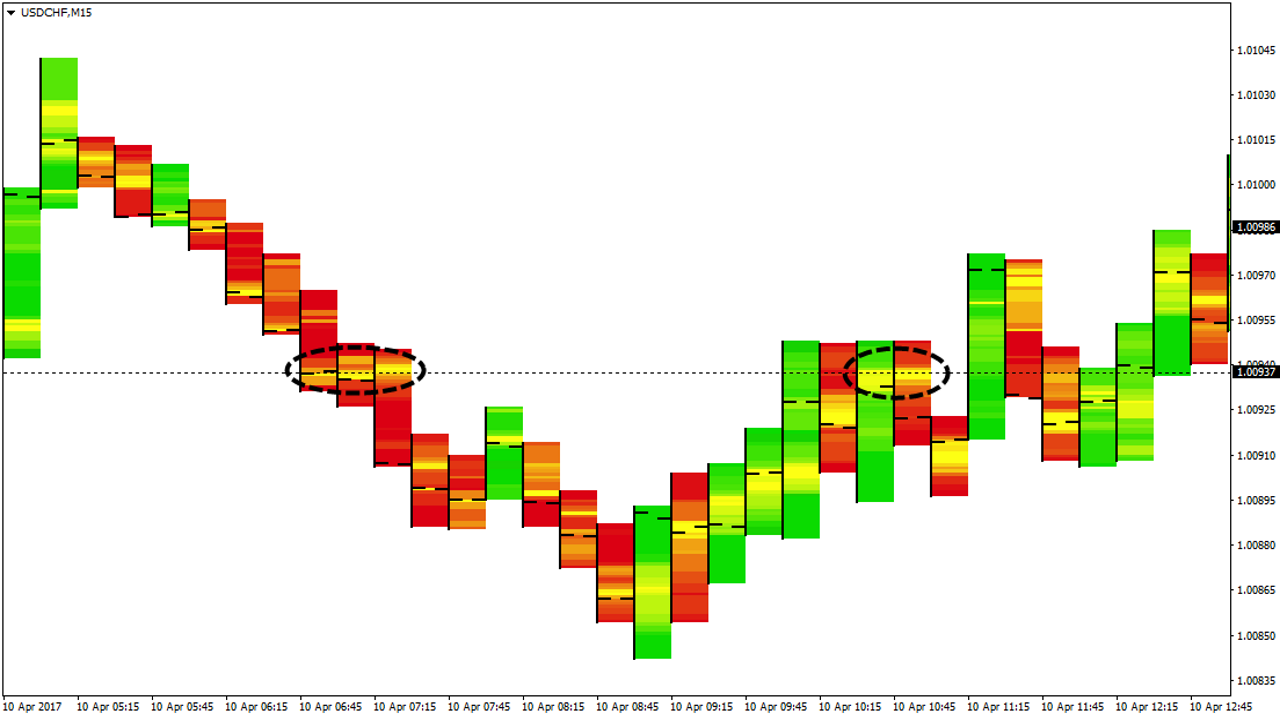 Also, try not to overthink things by focusing only on the yellow shade of the candle. At times, the price moves evenly, as a result of which no accumulation of volumes at a specific level occurs.
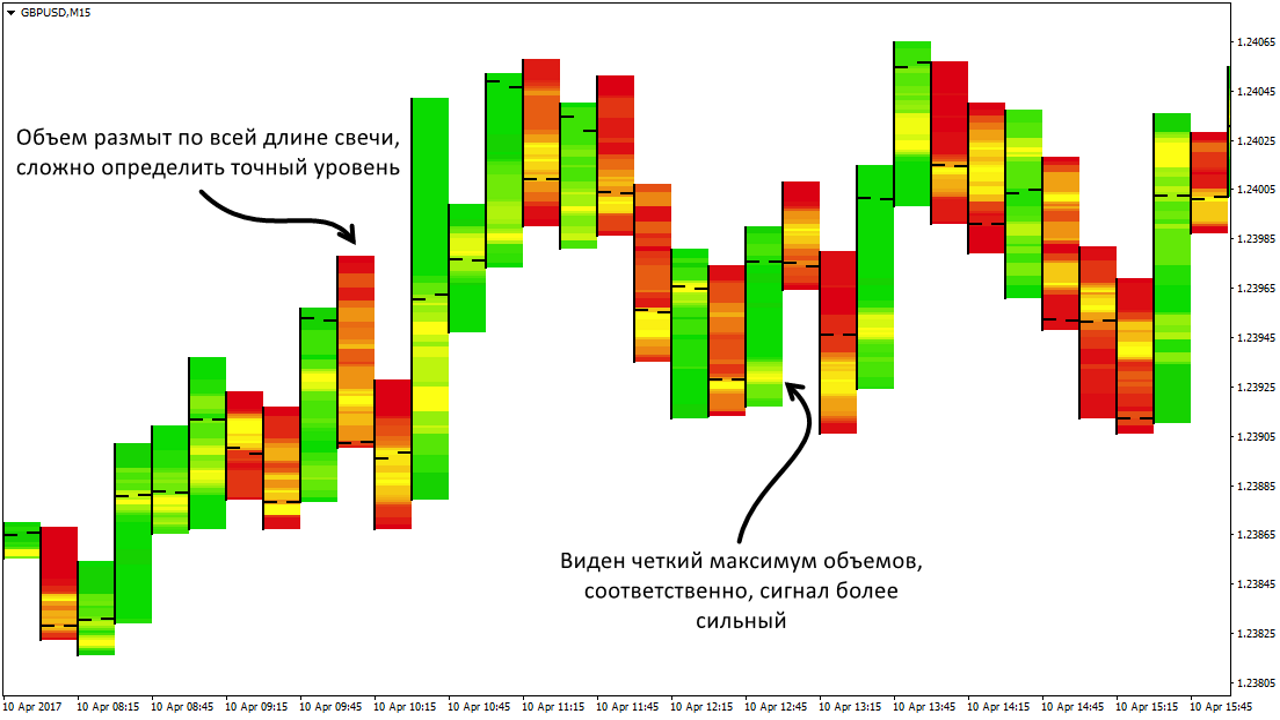 The main advantage of the indicator is its versatility and clear short-term signals. In essence, the signals can be used both to identify new levels and to confirm the breakout of old ones. In the example below, we see how the price “warms up” under the resistance level for some time, after which it overcomes it without delay.
Conclusion

In conclusion, I would like to clarify one point: indicator values should not be taken as an exact signal to act. The indicator can become a wonderful assistant in everyday trading, specifically for simplifying the identification of key levels and, especially, for scalping. Nevertheless, entry into a trade should be supported by other signals.
Download the Candle Temperature Indicator
 Respectfully, Alexey Vergunov
TradeLikeaPro.ru
Respectfully, Alexey Vergunov
TradeLikeaPro.ru
