
Bitcoin Near $80,000 Again: ETF Demand Meets the Macro Test

Intro

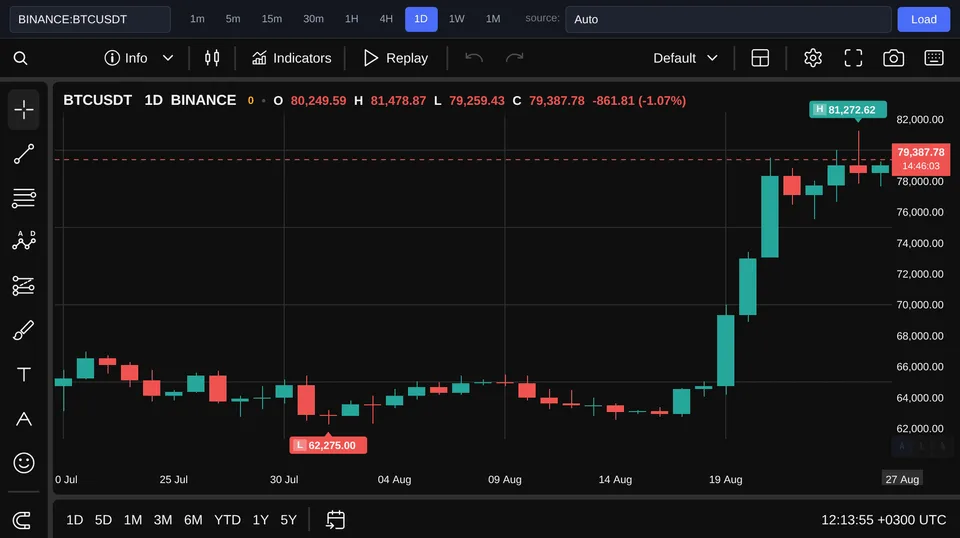
Bitcoin is back within sight of the psychologically important $80,000 line, supported by a renewed wave of institutional buying through spot exchange-traded funds. Yet the market has not turned that round number into a secure floor: Bitcoin was trading at $79,444, down 1.00% for the day, while Ether stood at $2,492, down 0.75%. The combination tells a more nuanced story than a triumphant headline would suggest. Demand has improved, but the next leg higher still depends on whether ETF flows can overpower macroeconomic pressure from bond yields and Federal Reserve policy.
💰 ETF inflows rebuild the demand base
Around $2.5 billion entered spot Bitcoin ETFs over seven trading sessions, the largest comparable inflow since October. That matters because ETFs provide institutions and traditional brokerage clients with a regulated route into Bitcoin without requiring them to manage wallets, private keys, or direct custody. When purchases arrive persistently through these products, authorized participants must accommodate the demand, creating a steadier source of spot-market support than a brief burst of leveraged speculation. The seven-day inflow is evidence that institutional appetite has returned, but it is not a guarantee of an immediate price breakout. Bitcoin’s daily decline of 1.00% to $79,444 shows that sellers remain active near the round-number threshold. ETF demand can absorb supply and make pullbacks shallower, but price may still stall if existing holders take profits or traders reduce risk ahead of macroeconomic signals. The distinction between support and acceleration is important. Strong inflows improve the market’s foundation, while a durable rally requires those flows to persist as Bitcoin challenges heavier selling interest. Institutional money may be patient, but the chart is still asking it to show up for more than one impressive week.
🛡️ Why the debasement trade is returning
The ETF revival has renewed discussion of the debasement trade: buying scarce or hard-to-expand assets as protection against the long-term erosion of a currency’s purchasing power. Bitcoin appeals to this thesis because its issuance path is predetermined and its maximum supply is limited. Investors concerned about large fiscal deficits, rising public debt, or future monetary easing can therefore treat it as a portfolio hedge alongside more established stores of value. That argument does not mean Bitcoin rises whenever the dollar weakens, nor does it make the asset immune to liquidity shocks. In the short run, Bitcoin often trades like a high-volatility risk asset, responding to real yields, dollar liquidity, positioning, and broader appetite for speculation. The debasement narrative can attract strategic capital, while day-to-day pricing remains governed by financial conditions. This tension explains why a substantial ETF inflow can coexist with a negative session. Long-horizon buyers may be building exposure while short-term traders react to yields and policy expectations. The market is effectively wearing a scarcity badge while still checking the Federal Reserve’s calendar—a respectable thesis with a very practical nervous habit.
📊 The $80,000–$83,000 zone is the immediate test
The area from $80,000 to $83,000 is the nearest technical magnet and likely resistance zone. The lower boundary is psychologically powerful because round numbers attract orders, headlines, options positioning, and profit-taking. Above it, the rest of the zone may contain supply from traders who bought earlier advances and are waiting for a liquid opportunity to reduce exposure. A brief move through $80,000 would therefore be less informative than repeated closes above the wider band. Traders will want to see price hold after the initial excitement, accompanied by continued ETF subscriptions and healthy spot volume rather than an outsized contribution from leverage. A sustained break above $83,000 would offer stronger confirmation that fresh demand has absorbed nearby supply. Failure to hold the zone would not automatically invalidate the bullish case. If ETF inflows remain positive, consolidation below resistance could represent accumulation rather than outright rejection. Conversely, weakening flows combined with repeated failed attempts would suggest that the institutional impulse has lost momentum and that the market needs either lower prices or a friendlier macro catalyst.
🏦 Treasury yields and the Fed still hold the keys
Bond yields are central to the next move because they determine the opportunity cost of holding an asset that produces no contractual income. Rising real yields make Treasury securities more competitive and generally tighten financial conditions, which can pressure Bitcoin even when the long-term scarcity argument remains intact. Falling yields have the opposite effect: they reduce that opportunity cost, improve liquidity expectations, and can reinforce demand for alternative stores of value. Federal Reserve communication will shape how investors interpret the yield path.
Conclusion
The return of roughly $2.5 billion to spot Bitcoin ETFs over seven trading days has materially improved the demand backdrop and revived Bitcoin’s role in the debasement trade. Still, the current readings—Bitcoin at $79,444, down 1.00%, and Ether at $2,492, down 0.75%—show that institutional buying has not yet produced an unquestioned breakout. Confirmation would require Bitcoin to establish itself above the $80,000–$83,000 resistance area, supported by continuing ETF inflows, stable or declining yields, and Federal Reserve signals that do not tighten financial conditions. Until then, the setup is constructive but conditional.