
The Best Way to Calculate a Stop-Loss


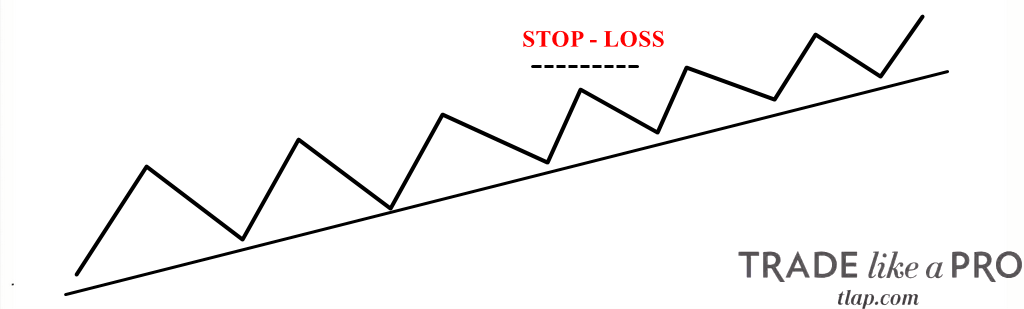
This uniform tactic leads to the formation of a cluster zone of pending orders. Market makers often use these levels to:
Taking profit is the most common reason stops are triggered, after which quotes return to the previous trend, while the trader who correctly predicted the move is left with a loss and without a position.
Practice in determining Stop-Loss (SL) levels using the indicator of volatility ATR (Average True Range) will help avoid such an outcome.
ATR indicator and its settings

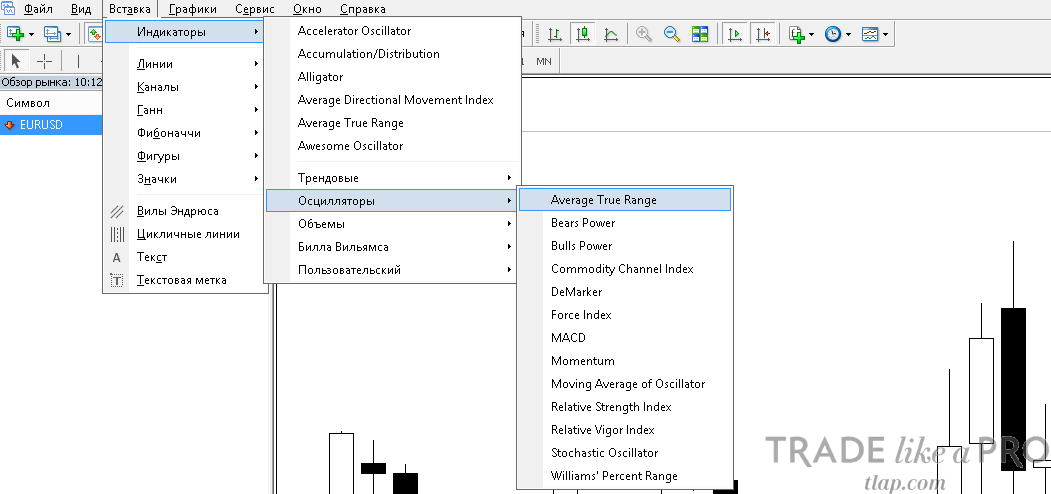
Average True Range is included in the standard package of indicators in common trading platforms. In the Metatrader 4/5 terminal, this tool is located in the top menu "Insert," the "Indicators" option, the "Oscillators" section:
A description, history, and examples of using ATR are covered in detail in a separate article on the site. In this lesson, we will focus specifically on setting stops with ATR.
The essence of the indicator is reflected in its name: Average True Range translates as the "average true range" of market fluctuations. The indicator formula dynamically calculates the amplitude of fluctuations in the quotes of currency pairs over the period set in the settings.
The data obtained allow a trader to calculate a stop-loss level that will be above the current market volatility and will differ from the pending orders (stops) of other traders.
The indicator has a minimal number of settings: besides the color display option and the choice of line thickness, a trader can set the period, that is, the number of candles of the timeframe over which the true fluctuation range is determined.
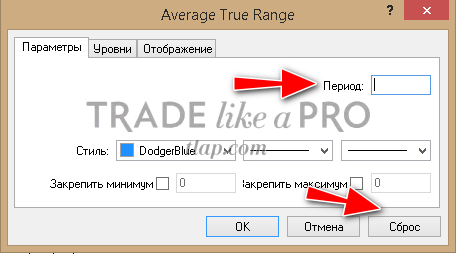
By default, ATR is calculated over a span of 14 candles, but for intraday trading on the H1 timeframe it is better to use a value of 24, which equals the number of hours in a day. On D1, a period of 20 trading days will be optimal. In all other cases, the standard value of 14 can be used; it is set by default after pressing the "Reset" button.
How to set stop-loss using the ATR indicator

ATR indicator values are the amplitude of market fluctuations expressed in old points of four-digit quotes. It is determined at the moment a trade is made at the extreme point of the curve. The readings must correspond to the candle on which the order was placed.
The algorithm as a whole is as follows:
The ATR indicator values are the amplitude of market fluctuations specified inold pointsfour-digit quotes. It is determined at the time of commissiondealsat the extreme point of the curve. The readings must correspond to the candle on which it was displayed.order.
- We look at the current value of Value ATR;
- We translate it into points;
- Multiply by a suitable coefficient;
- Add/subtract from the transaction price;
- If the resulting stop loss coincides with obvious places where crowd stop losses accumulate, we adjust it.
Let us consider an example of setting a stop-loss on the USDCAD pair in intraday trading. Basic conditions: H1 timeframe, ATR period 24, short position.
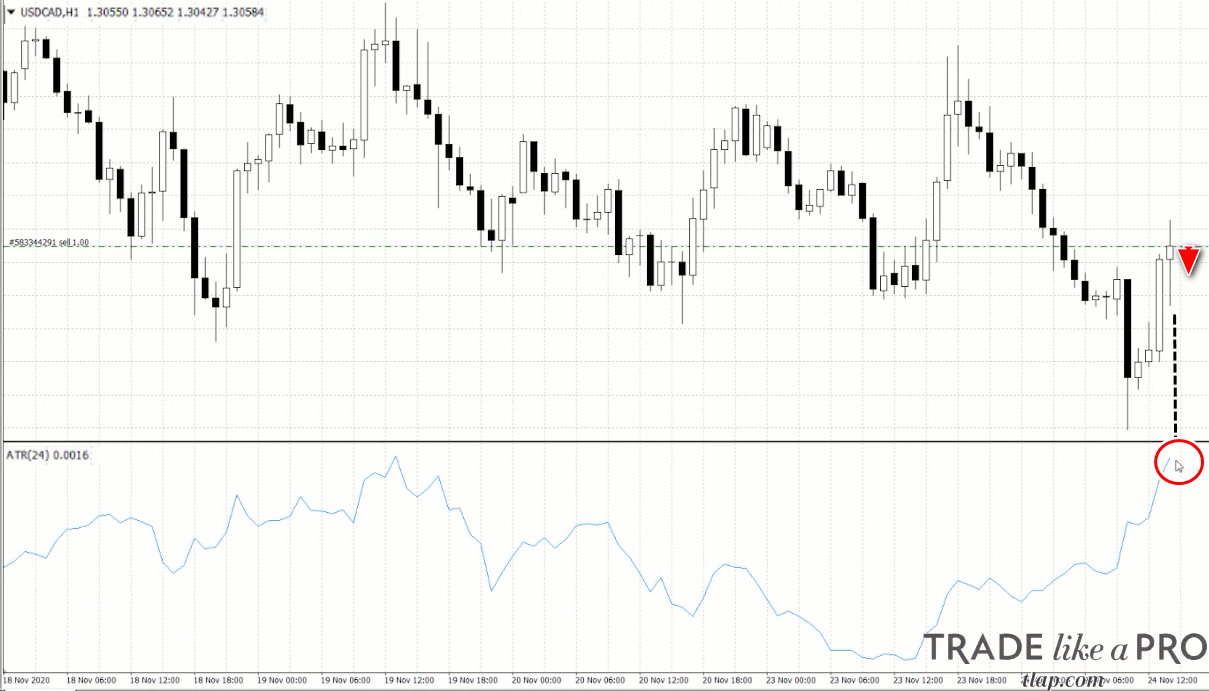
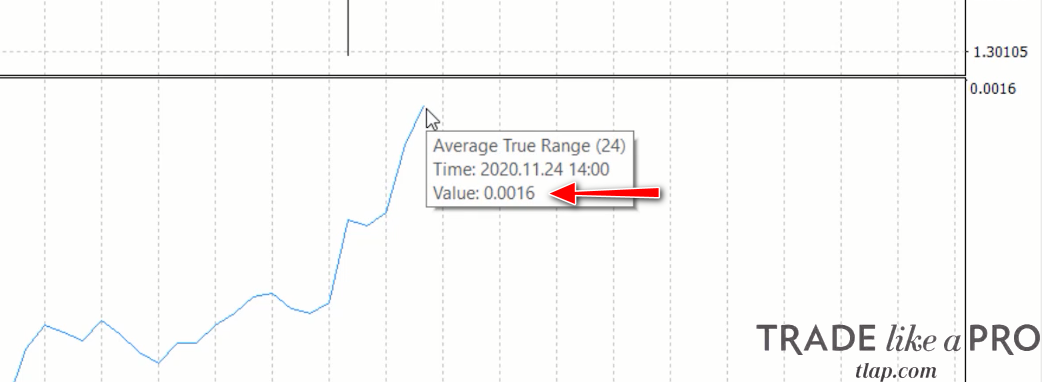
By hovering the cursor over the edge of ATR, you can see the Value of 0,0016. This figure is given in the four-digit quote format, which means fluctuation volatility of 16 (old) points on average per candle.
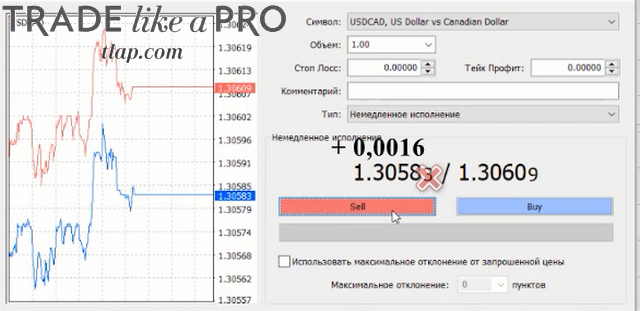
The indicator value must be added to the USDCAD sell trade price to get the stop-loss value. As can be seen from the order in the screenshot below, five-digit quotes are used in the example. This means the last digit should not be taken into account in the calculation. Add 0,0016 to the SELL entry 1,3058 and we get 1,3074.
It is important to understand that ATR figures are an indicator of market volatility over a given period, allowing the trade to be protected from an accidental stop trigger at the current moment. Whether such a stop will be enough for you, or on the contrary, whether it will turn out too large, depends on the strategy being traded.
That is why the ATR reading is multiplied by a coefficient when calculating the stop.
A coefficient is the value by which we multiply the Value ATR.
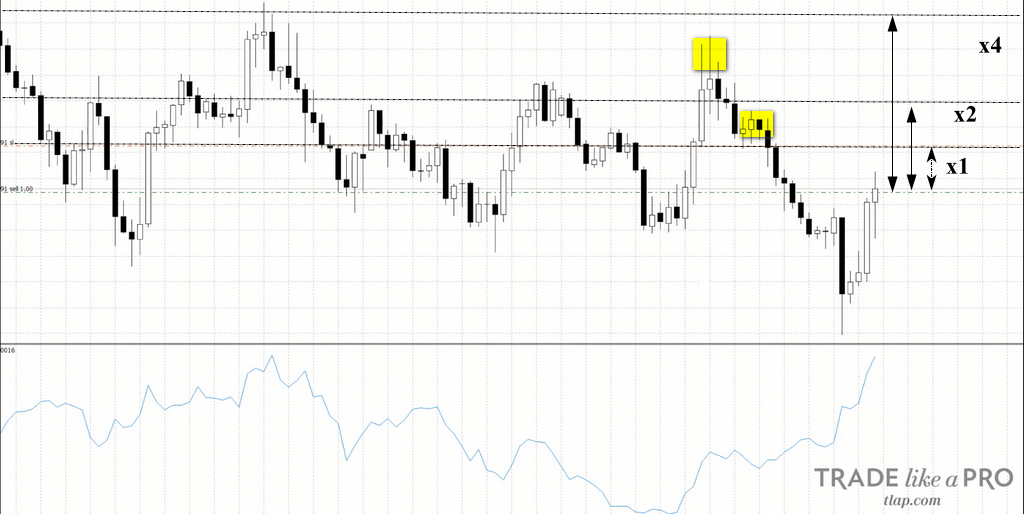
In scalping trades with a minimal take-profit fixed, a trader can limit themselves to 0.5 ATR (8 points in our case). Medium-term and long-term holding of a trade will require a volatility reserve 2 or 4 times larger.
The choice of stop-loss size by ATR is examined on the site in a separate article devoted to the effectiveness of Price Action patterns, where the optimal coefficient size for Average True Range was established empirically.
On trading timeframes from H1 to D1, a coefficient from 2 to 4 is optimal.
As can be seen in the picture above, a multiplier of 4 places the stop-loss beyond the local maximum into the crowd stop cluster zone. Double ATR allows the likely loss to be reduced while preserving the earning potential. In addition, it is located just above the last correction peak on USDCAD.
Assumptions about where most traders' stop-losses are located can be checked using a special indicator on the site in the "Tools" section.
By adding the levels to the chart, you can see that retail traders placed pending orders around the 4x ATR multiplier or very close to the current USDCAD rate. The SL set at the twofold ATR level turned out to be in the "blind zone" of market makers.
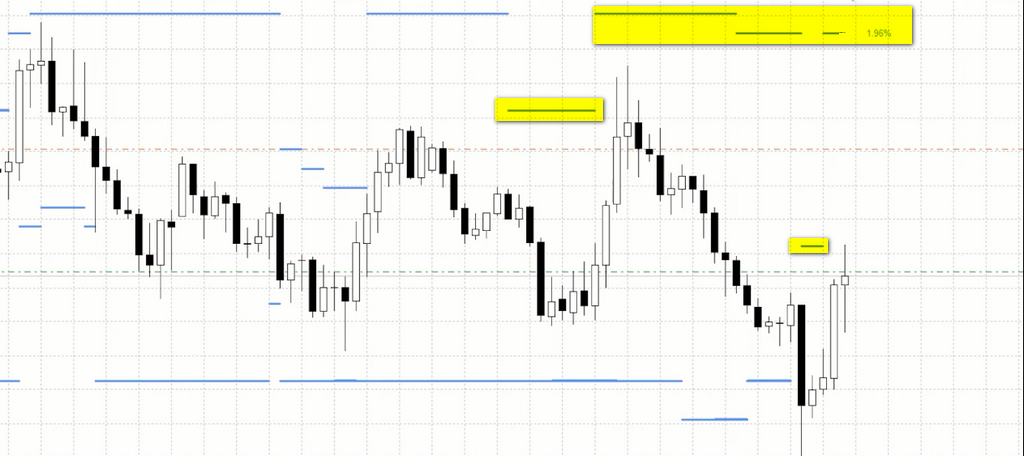
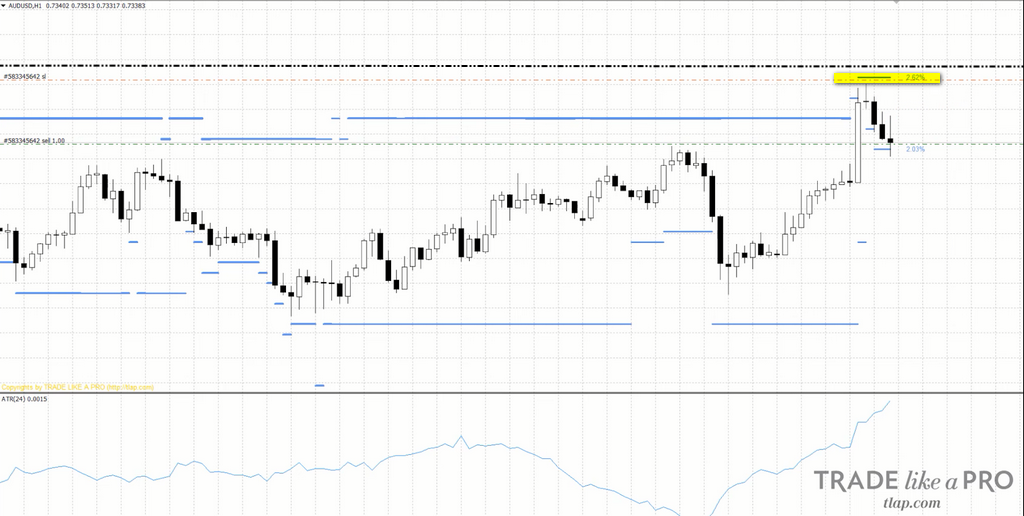
Placing a stop-loss in unique zones is the main task of the tactic described. The figure below shows an example of a short on AUDUSD. A double ATR multiplier on the H1 timeframe gave a level that coincided with the readings of the stop-loss indicator.
In this case, the SL should be increased by several points in order to move it above the bulk of the crowd's stops.
On the daily timeframe, the calculation and placement of the SL are carried out according to the same scheme. When switching to D1, only the ATR period in the settings changes from 14 to 20 (the number of trading days in a month).
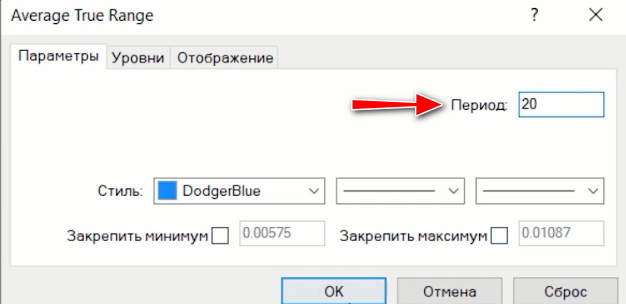
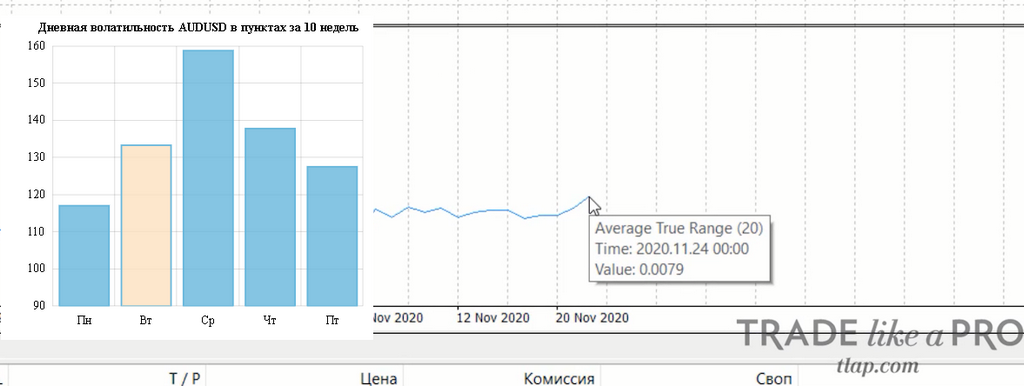
Let us consider an example of a long trade on the AUDUSD pair. In this case, the stop-loss size is indicated by the latest ATR (20) value corresponding to the current candle of entry into the position, equal to 0,0079 or 79 points. Such an SL size without multipliers is too small for "calm" trading on daily candles. If ATR is multiplied by two, the resulting 158 points will be enough for medium-term holding of the position for a week. This value fits within the average daily volatility, which can be checked for reference in the "Forex Volatility Indicator" service.
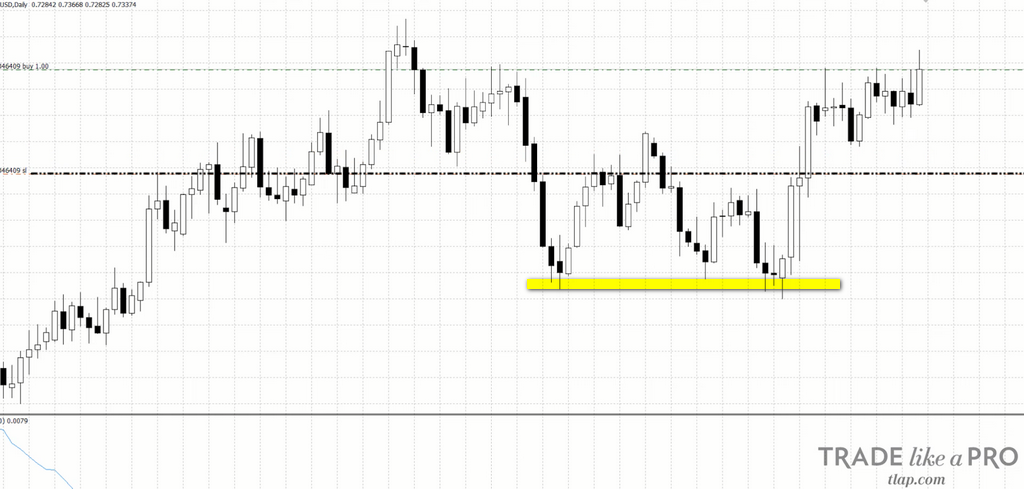
Add 0,0158 to the BUY trade value, ignoring the fifth digit, and we obtain the required SL figure of 0.7178. From the placement of the pending order on the chart, it is clearly visible that it does not intersect with any significant support levels or price lows, where the pending orders of the crowd usually accumulate.
What to do with non-standard instrument quotes?

A number of major currency pairs, exotics, gold, or other commodity instruments have non-standard ATR indicator values. For example, the true range of inverse daily quotes of USDJPY will show a value of 0,7148.
The volatility indicator of Forex shows that over the last 10 weeks the average candle range did not go beyond 120 points. It is logical to assume that ATR shows 71,48 points, which we round to 71 points.
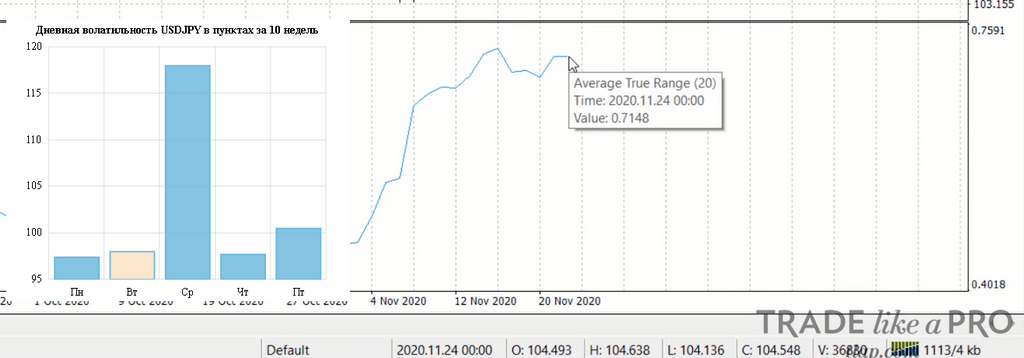
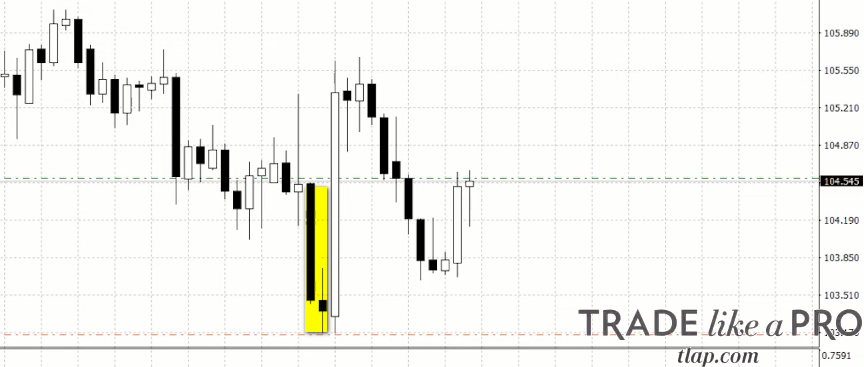
For a long (buy) trade, to determine the stop size we use a double multiplier and subtract 142 points from the opening price of the Buy order, obtaining an SL value of 103,15.
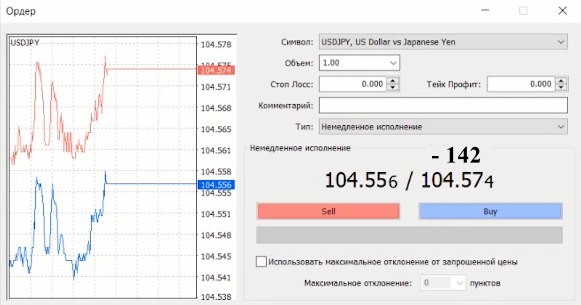
As can be seen from the picture below, the size of the resulting stop-loss is quite logical when compared with the range of daily candles, which means the ATR values were interpreted correctly. At the same time, one should not forget about obvious places where pending orders cluster. In this example, the stop-loss falls on a local minimum, and the trader will have to move the order a few points lower.
If we consider trading Bitcoin, now widespread in the Forex market, it is logical to assume that the ATR indicator reading on daily candles corresponds to 1000 points.
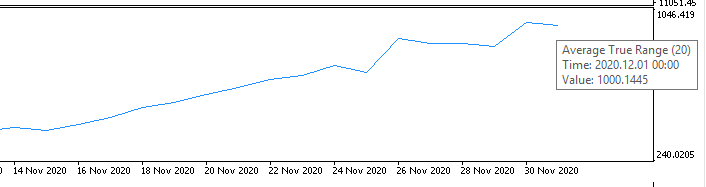
A trader will have to use logic when choosing an ATR multiplier for cryptocurrency. Given the high volatility of Bitcoin, it is better to take a multiplier of 4.
Conclusion
The ATR indicator allows a trader to objectively assess the size of a relatively safe stop-loss by placing the order beyond market volatility. The tactic will help reduce losses and avoid becoming a victim of market makers hunting for the crowd's stops.
Sometimes the calculated ATR levels coincide with the zone where the crowd's stop-loss pending orders cluster; in this case, it is enough simply to increase the size of the SL. The choice of multiplier can be entrusted to the strategy tester, but according to the results of the research conducted, on timeframes from H1 to D1 the coefficient should be sought in the range from 2 to 4.
Respectfully, Pavel Vlasov
Tlap.io