
The Best Pin Bar Indicator
 Great wisdom says: everything that can be automated should be automated. Oddly enough, this is especially relevant for manual trading. Think about it: the more tasks are handed off to a program, the more time remains for manual analysis. All the more so when we are talking about potential trading opportunities such as candlestick patterns. So, today we will talk about a useful tool for finding pin bars on the chart: the Pin Bar Dashboard indicator.
What Is a Pin Bar
In technical analysis across various markets, including Forex, Japanese candlesticks play an important role. Researchers long ago identified certain candle combinations characteristic of different types of price behavior. These combinations are called candlestick models or patterns. One such pattern is the Pin Bar.
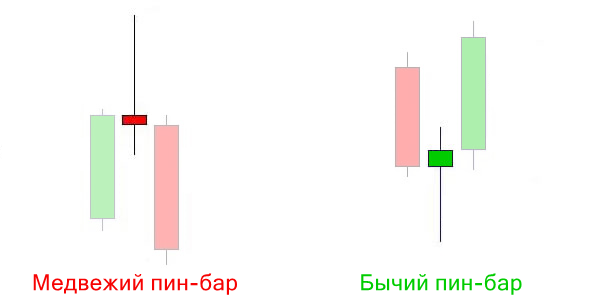 A pin bar is defined as the middle candle in a three-bar pattern. This candle is characterized by a long tail in one direction and a short body, or no body at all. It usually suggests a trend reversal, and sometimes a continuation of the move. This pattern works most correctly on time periods from one hour to one month.
This term first appeared in the book by analyst Martin Pring, "On Price Patterns." Four varieties of pin bars are distinguished. The first is a bullish pin bar indicating a trend reversal, the second is a bearish pin bar indicating a reversal, the third is a bullish pin bar signaling trend continuation, and the fourth is a bearish pin bar signaling trend continuation.
For more detail on the varieties of pin bars and ways to trade pin bars, read the separate article.
Installation and Setup
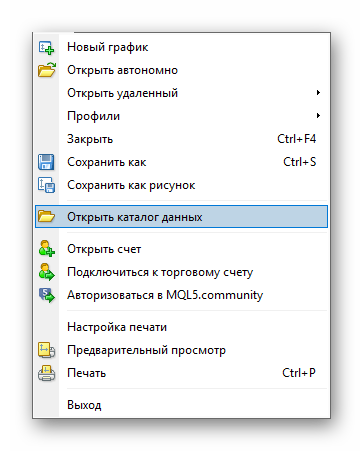
The indicator installation process follows the usual instructions. First, open the terminal data directory via File - Open Data Folder.
 Next, go to the MQL4 - Indicators folder, where you copy or drag the indicator file "Pin Bar Dashboard.ex4." For the changes to take effect, restart the terminal.
After that, the indicator will appear in the navigator window. To launch it, simply drag the indicator onto the chart. A settings window will appear.
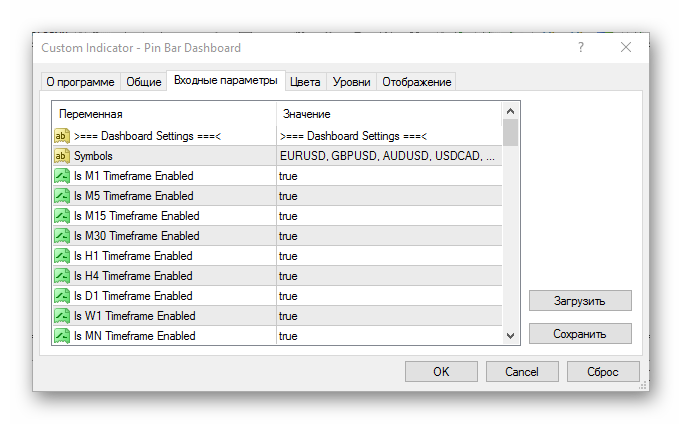 The "Symbols" parameter controls the list of instruments on which pattern searching will be performed. Next comes the list of timeframes. If, for example, you want to receive signals only from the hourly timeframe, leave true in the "Is H1 Timeframe Enabled" field and switch all the others to false. Here you can also configure the indicator's color scheme, fonts, sounds, and notification method.
Interface Description
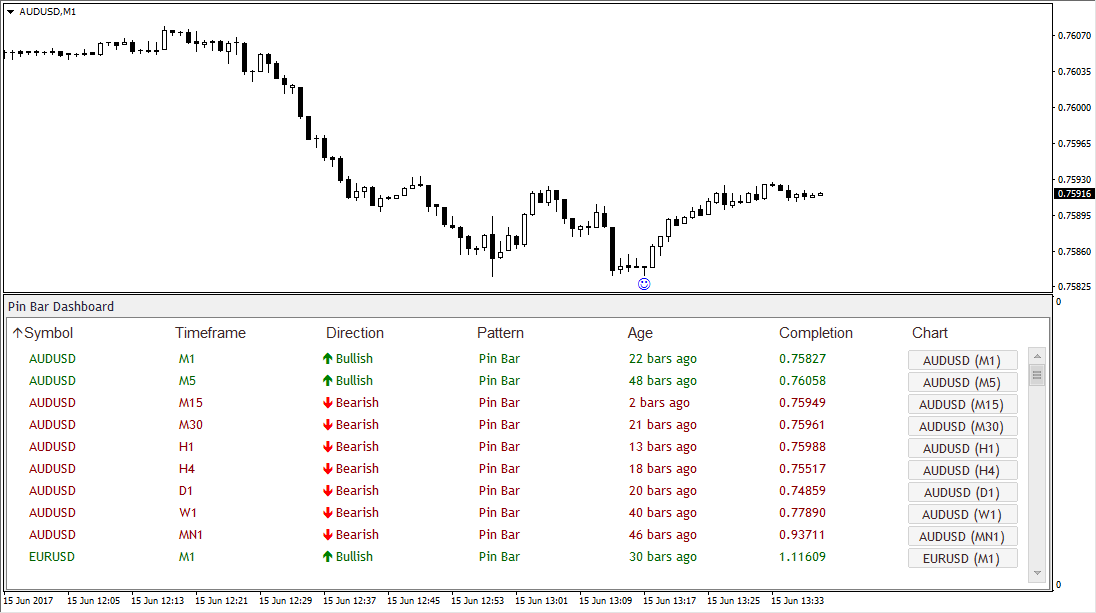 The indicator panel is a table with the ability to sort values in ascending and descending order. Each row corresponds to a specific setup with the following characteristics:
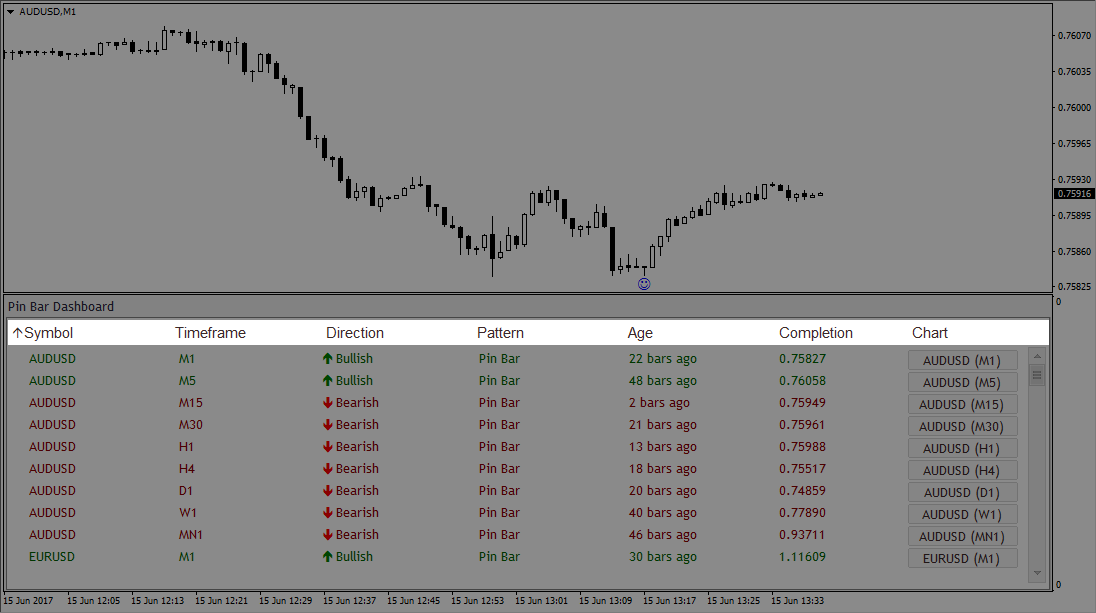
- Instrument name;
- Chart period;
- Direction: Bearish or Bullish;
- Pattern name;
- Pattern age (number of bars ago);
- Price at the completion of formation;
- Link to the chart.
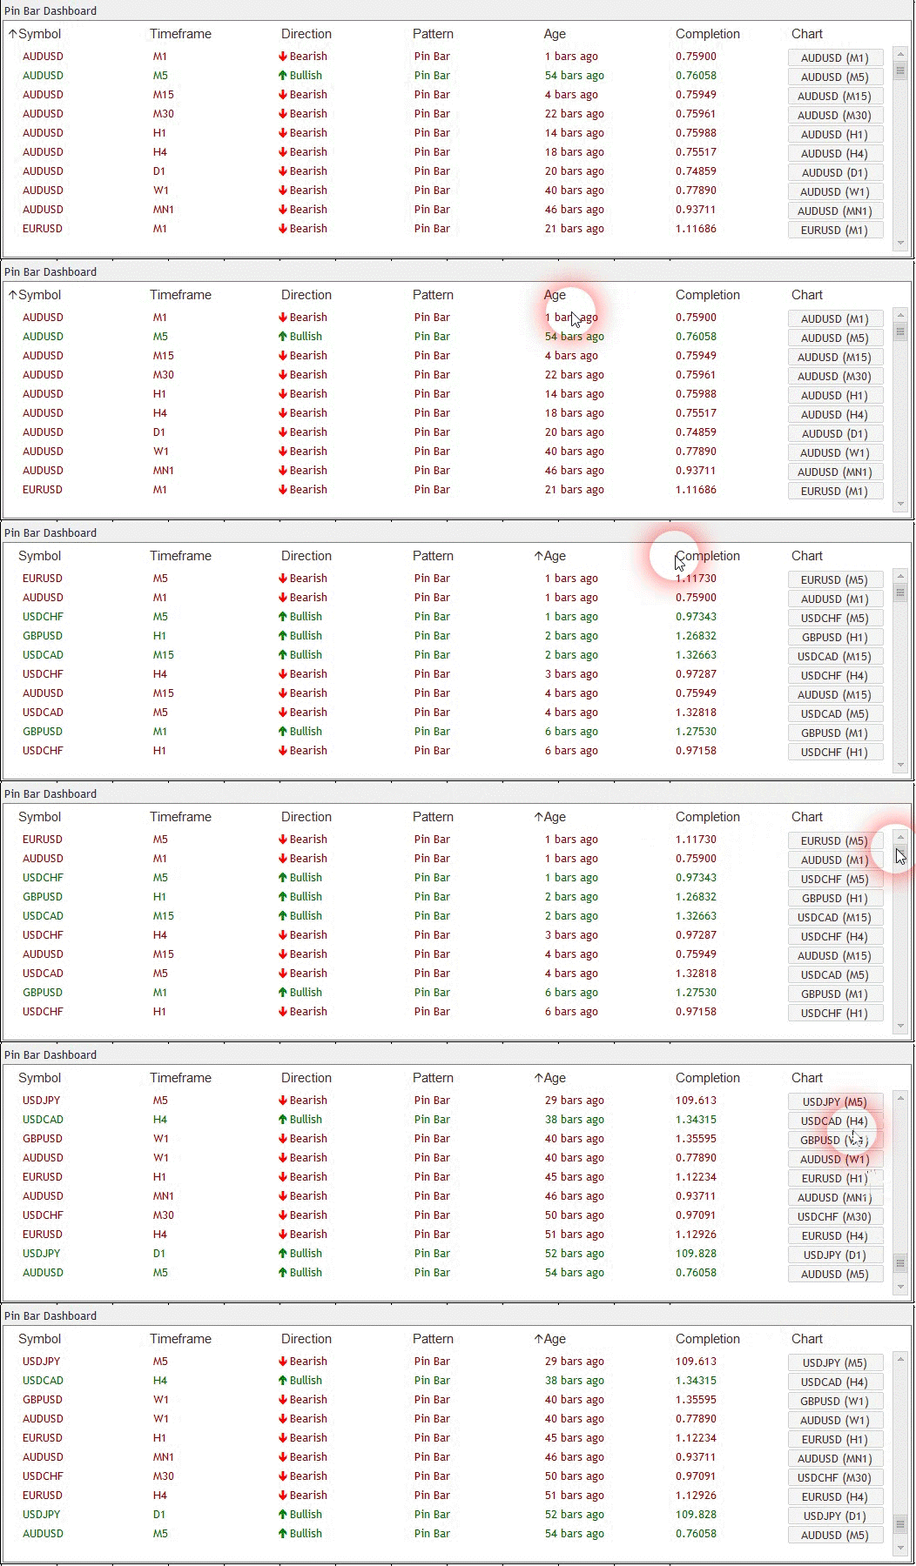
For example, you can sort setups by age, leaving the newest signals at the top of the list.
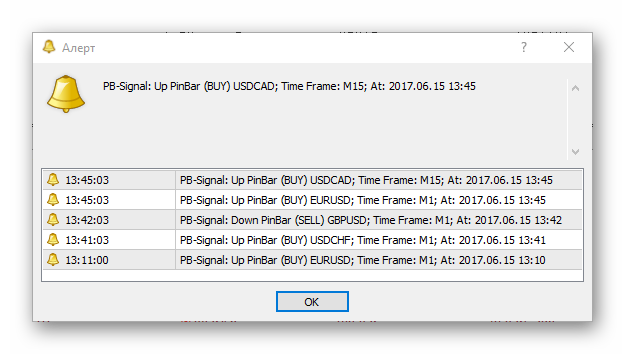
 By default, the indicator signals the appearance of a new signal using the standard MT4 alert.
 For quick access to the chart, click the button with the pair name and timeframe opposite the signal that has appeared, in the last column of the table. On the chart, the found pin bar will be marked with a blue or red smiley face.
Usage Tips
Before using the indicator in trading, you need to understand its main purpose. The most important thing is not to interpret the indicator's signals as an immediate call to action. Rather, it is a hint at a potentially profitable setup, but nothing more. The indicator in no way excludes comprehensive analysis; that must be done by the trader.
The most basic filter we can apply is to use support/resistance levels to confirm the entry. As is well known, a pin bar formed near a strong support or resistance level is a fairly good trading setup.
For example, after receiving a signal that a bullish pin bar is forming, we draw a horizontal line near its tail.
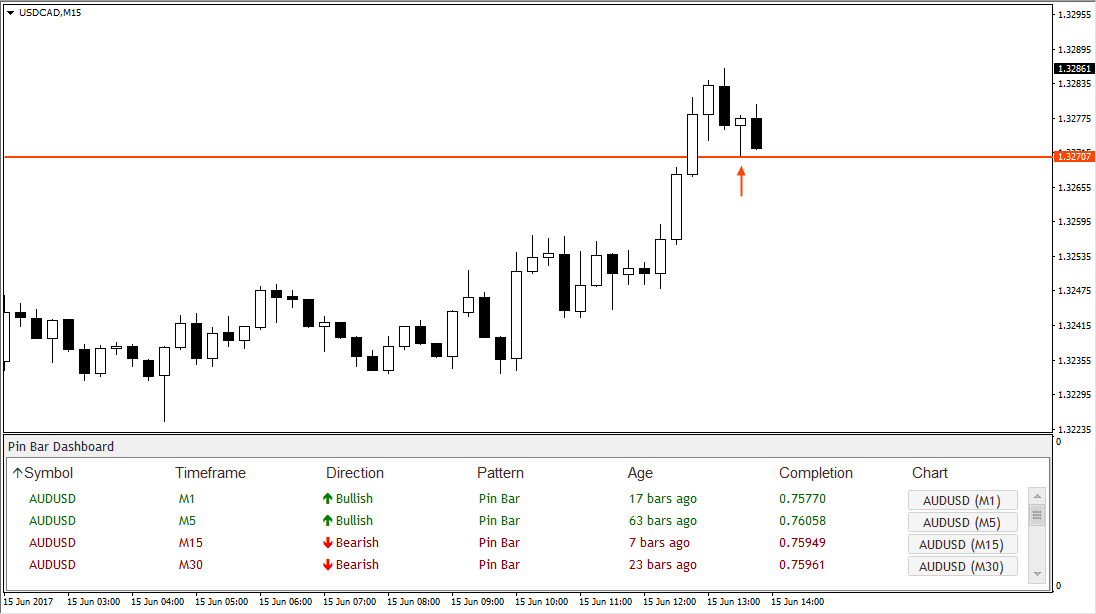 After that, zoom out the chart and see whether this level is really strong support. In this case, the price tested the level at least 3 times over the previous two days. This can be considered good confirmation for a bullish pin bar pattern.
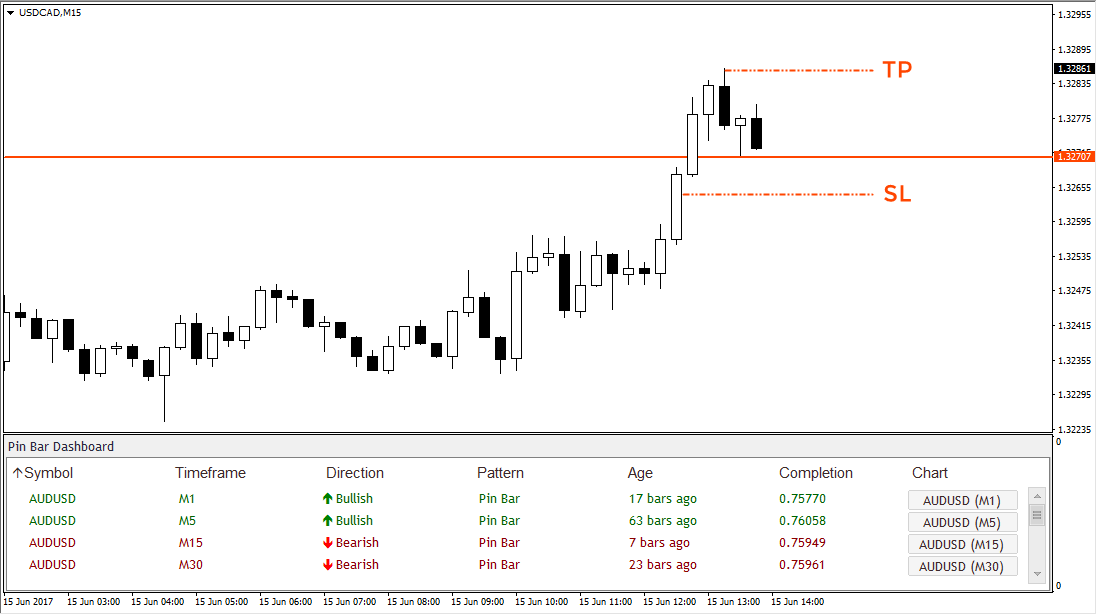 We enter the trade with a market buy order. Take profit should be set at the nearest resistance level. In this case, the nearest extremum is 10 points from the entry point. We place the stop loss slightly below the support level, but no greater than the take profit.
Conclusion

The indicator's main advantage is simultaneous monitoring of many instruments and timeframes. Performing such analysis manually is extremely inefficient. Your task, after receiving a new signal, is to analyze it and then make the final decision about entering the trade. This way, you will be able to process far more potential setups that you might have missed with manual analysis alone.
Download the Pin Bar Indicator

Best regards, Pavel Vlasov TradeLikeaPro.ru