
Oscillators in Forex - which one is the best?

Hello, fellow Forex traders!
Almost each of us at the stage of our first currency speculations watches the exchange rate changes of currency pairs in Forex with bias. Beginners cannot get rid of the notions of "too expensive" or "too cheap." As is known, the market does not accept such wording, trends can last for years, constantly forming new highs or lows.
In such difficult conditions, a trader needs a tool that can help in market analysis, providing a certain edge when opening trades. One of such tools became oscillators, which probably everyone has heard of. Today we will examine what kinds of oscillators there are, how to interpret their signals during trading, and also look at the strengths and weaknesses of this type of indicator.
Overbought and oversold or what Oscillators show

For example, no one could have foreseen that the British currency, traded at 2:1 against the US dollar, would someday come close to parity. As a well-known postulate says, "You cannot guess the bottom and the top of the market." Nevertheless, in technical analysis there are the concepts of overbought and oversold.
They appeared thanks to a special class of indicators called "Oscillators." Unlike other technical analysis tools, their curves do not endlessly follow the trend, but fluctuate within the strictly limited boundaries of the 0-1 or 0-100 range. Reaching the ceiling is the overbought zone, and if it declines to zero, market oversoldness arises.
The oscillation of the curve in a rigid range is set by the indicator formula, where the current price is divided by the maximum value of the range in the selected period. In most cases, the instrument curve indicates the position of the forming candle relative to highs and lows.
Historical extremes are the most likely zone where corrections arise, capable of becoming the beginning of a trend reversal. Overbought and oversold zones do not answer the question of whether the pullback will grow into an opposite trend. Moreover, the indicator gives a fairly large number of false signals during strong directional movements of quotes.
An oscillator will not save you from a falling price "knife" and will force you to sell endlessly in a rising trend, therefore they never use only one indicator. In a trading system it filters entries at highs, not allowing the trader to enter just before the market correction so as not to take a loss.
The oscillator formula principle described above is a general concept; indicators were created and improved over half a century, which led to the creation of nonlinear principles of market analysis. The latest achievement is the use of neural networks when using an oscillator or interpreting the signals of its curve.
New methods did not lead to the emergence of grails; artificial intelligence provides profitability comparable to trading robots created 30 years ago. This review article aims to highlight the features of some oscillators. They are capable of scaling the profitability of trading systems when properly combined with the trading style of the trader.
Characteristics of oscillators
Trading platform: Any
Currency pairs: any
Timeframe: any
Trading time: around the clock
Recommended brokers: Alpari, RoboForex, Tickmill
The practical value of oscillators

Oscillators are the only technical tools whose formulas work perfectly during periods of flat. The remaining indicators are created to determine trends, therefore they give many false signals in sideways market movement, literally "sawing up" the deposit. Some types of oscillators (for example, MACD, OBV) are able to work both during flat periods and in a trending market.
Thanks to the use of value smoothing in the formulas, some types of oscillators combine leading and lagging signals on one chart, which greatly simplifies technical analysis. It is difficult for trend-following trading systems to do without oscillators acting as a filter, whereas MACD or a combination of several similar indicators are capable of providing a full-fledged standalone trading system.
Oscillator signals are simple to interpret and visually analyze for beginners and convenient for professionals, who easily combine them with complex trading systems.
Oscillators in the Metatrader platform

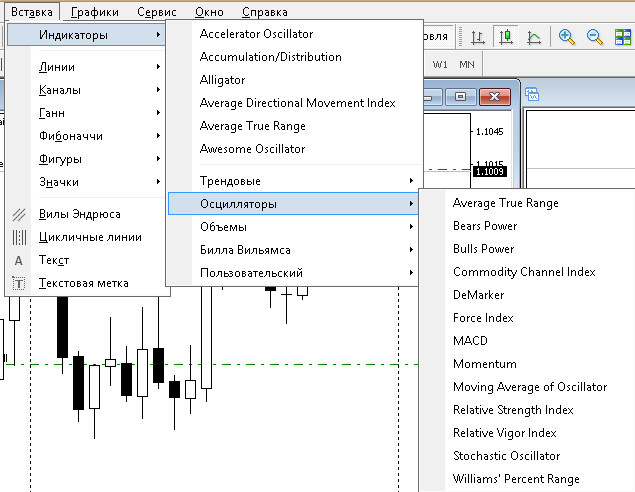
Indicators have their own section in the most widespread trading platform Metatrader (versions 4 and 5). Open the "Insert" menu in the upper left corner, where you can find 12 types of oscillators standard for many Forex terminals under the "Indicators" option.
As soon as the instrument selected by the trader is attached to the chart, a "Settings Window" will appear with a suggestion to choose your own parameters for technical analysis.
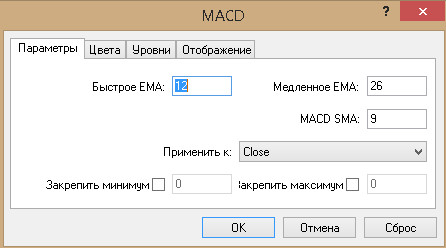
The default values are set in the fields of any oscillator; you can use these figures if the trader has no ready-made presets. The only thing that can be changed is the overbought/oversold levels: the narrower their range (30-70%, 40-60%), the higher the intensity of the signals.
Standard indicator signals

As already noted above, the purpose of the appearance of oscillators in the 70s was to determine the zones of possible reversals of quotes during a fall or rise. That time saw the heyday of speculation in commodity futures; intraday traders sought to increase their earnings by catching bounces and corrections.
The authors of oscillators - Chaikin, Wilder, Bill Williams, Elder, and others - made a name for themselves and earned money in the futures markets. Due to the fact that each developer of this type of tool followed the same plan - to catch corrections or reversals - it is easy to identify the standard types of signals.
The meaning of the terms becomes clear with one glance at the chart and the position of the indicator lines. As soon as they reach the upper or lower zone, the trader can predict a correction of the current trend in 80% of cases.
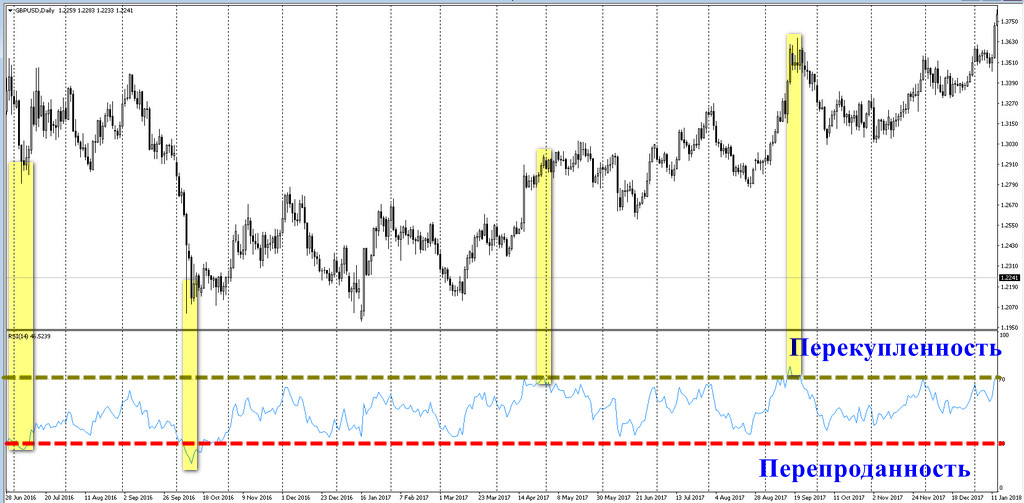
Despite the frequent coincidence of peaks and troughs of the oscillator curve, when applying the strategy the signals lag, since the trader must wait for the indicator to cross back out of the overbought/oversold zones, and this may turn out to be a false signal in prolonged trends.
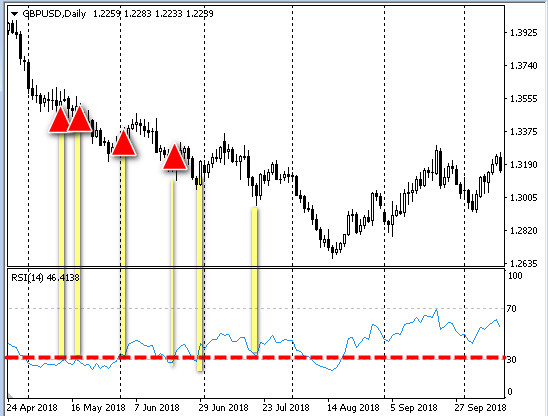
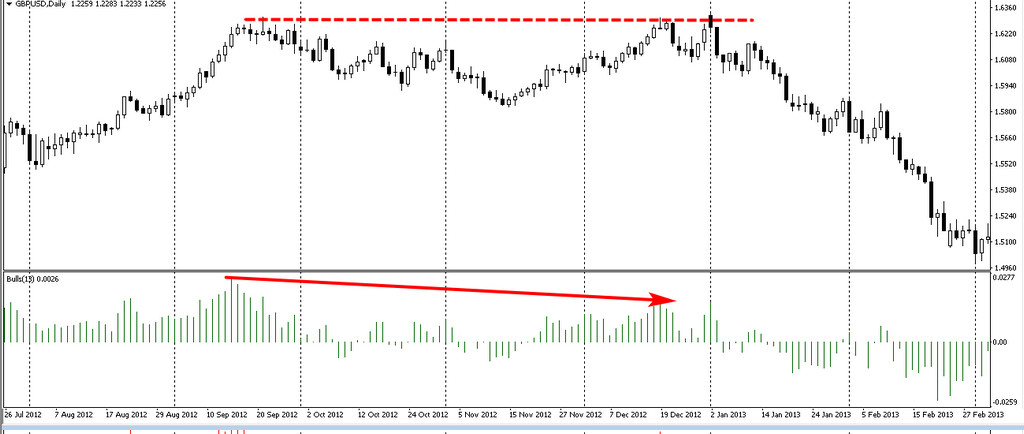
Oscillator curves follow the rate of the currency pair, repeating the peaks and troughs of the trend, but sometimes divergences arise. Pay attention to the figure below: the bulls proved unable to reach a new high, confirming the reversal signal of a "double top," after which a strong downward trend began.
Divergences are often called "golden signals." This does not mean at all that they have high accuracy, but their appearance definitely leads to a temporary pause in the trend. The figure below shows a powerful wave of GBPUSD decline, but as soon as the bears show rising lows, sideways movement begins after the next market bottom.
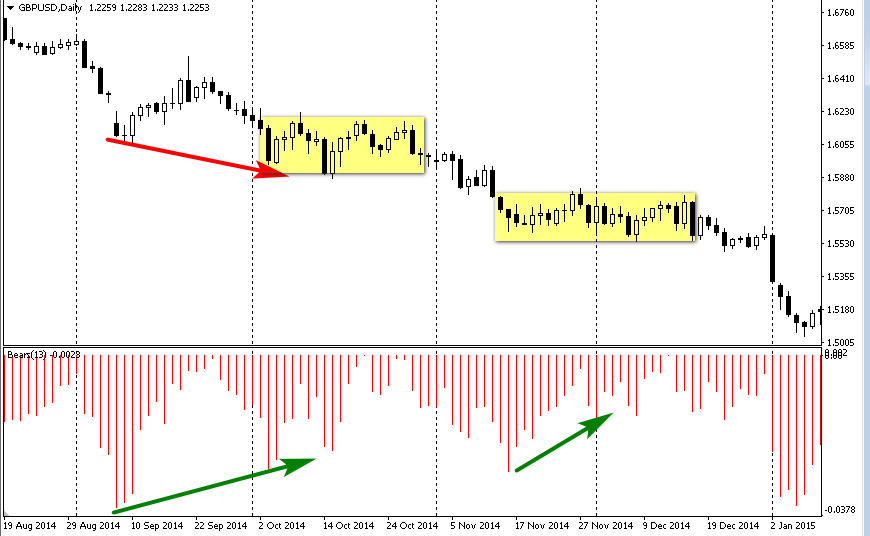
This gives the trader an opportunity to "tighten" the stop loss and exit with minimal losses if he is not inclined to sit through a drawdown.
The middle line of oscillators is an additional confirmation that market overbought or oversold conditions led to a reversal in the opposite direction. By choosing the right type of indicator, a trader can hold a position for quite a long time while the curve or histogram remains in one of the zones.
On the GBPUSD daily chart below, it is shown how MACD with the standard Metatrader 4 settings allowed a half-year long position to be held with one re-entry. The indicator removed the need for a trailing stop and selecting its size. This protected the trader from prematurely losing the position because of unpredictable jumps in volatility or during a flat market.
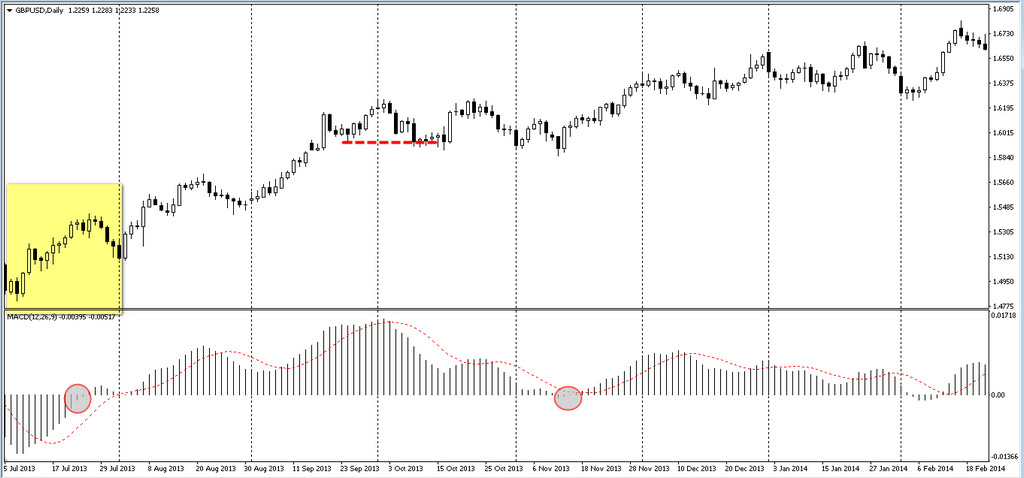
Oscillator formulas, as will be shown below, smooth price flows, modify the "chaotic" fluctuations of the rate into the form of cycles, thereby simplifying the graphical analysis of these indicators.
The effectiveness of using sloping trend lines has already been shown in the "Divergences" section. If all analysis tools are applied to oscillators, then reversals and corrections of currency pairs can be predicted not only in the rare moments of divergence between the graph curve and the indicator.
The example below of analyzing the trend oscillator On Balance Volume (OBV) clearly shows the simplicity of drawing horizontal and sloping support / resistance lines. Thanks to the clearly drawn sawtooth peaks and troughs, even a beginner can cope with the analysis task.
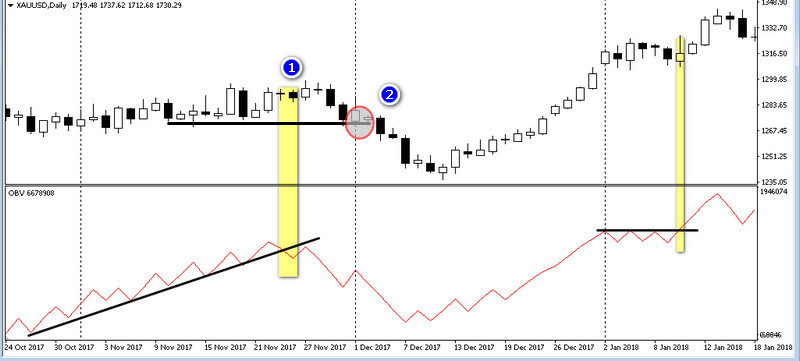
Comparing the chart and the dynamics of the curve helps determine at point (1) that the upward trend will continue until the reversal at point 2.
Oscillator signals significantly outpace the results of technical analysis on the chart in almost all areas where a clear sawtooth movement of OBV develops. A novice trader can concentrate only on these cases while simultaneously improving chart analysis skills with the help of more complex patterns.
Features of applying specific types of oscillators in Forex

Despite the commonality of oscillator signals and the principle of their operation, each indicator was created by its author to solve certain narrowly focused tasks. By understanding this application algorithm, it will be easier for a trader to assemble a trading system or understand the principle of signal formation in complex strategies created by others.
The Metatrader trading platform contains an optimal set of oscillators needed to create basic trading algorithms.
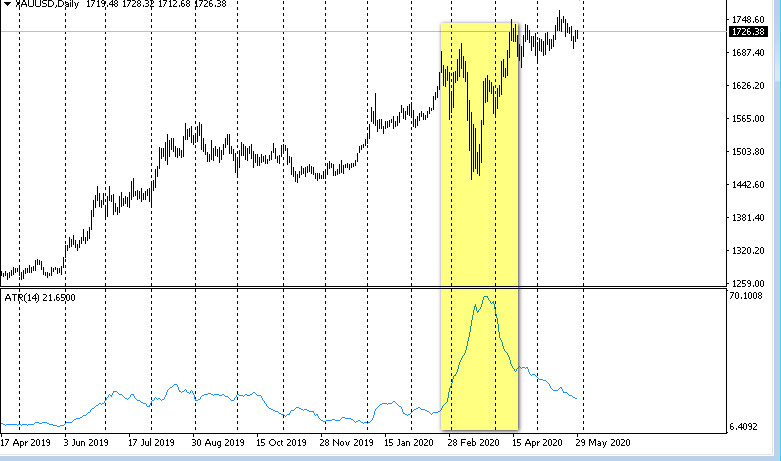
The ATR formula first determines the largest trading range by comparing the difference between yesterday's high and low with the analogous value on the current candle. The selected largest values (TR) are smoothed by a moving average:

The figure shows that in the zone marked by the marker, the trader's stop loss size will grow, which is justified given the threefold increase in intraday fluctuations during the economic crisis.
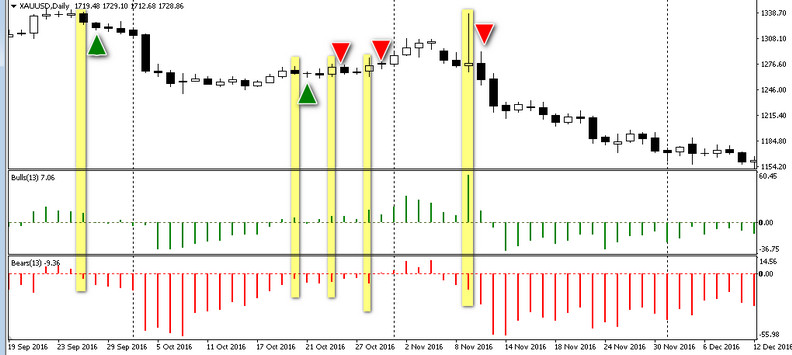
The histogram bar of the Bear/Bull Power oscillator is equal to the difference or distance of the candle's high/low from the moving average EMA with a period of 13 candles. A large distance indicates overbought/oversold conditions, which are intensified by an unexpected price spike. In this case, the Bear and Bull histograms diverge in opposite directions. The greater the spread, the higher the probability of a correction.
The figure shows the abnormal movement during the US presidential election in 2016. The spread shows that the rise is deceptive and the decline will continue. The divergence signals marked nearby show that the smaller size of the bars reduces their accuracy.
The typical price (TP) is the sum of High, Low and Close divided by three. The calculated difference between TP and the moving average of TP is compared with the absolute maximum deviation value over the specified period, which is taken as 100%.
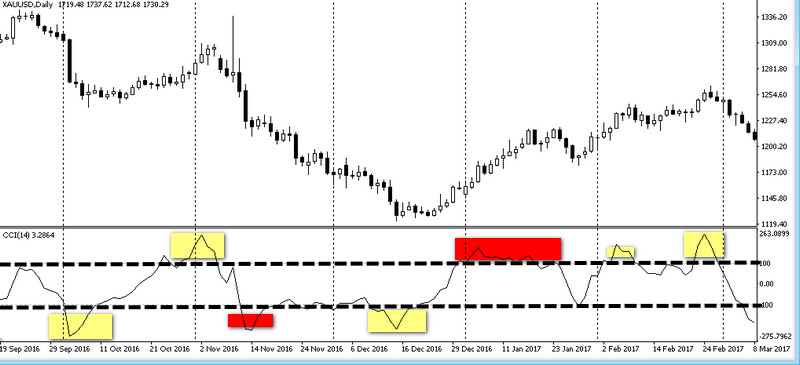
It is believed that the indicator moving beyond the level of extreme deviation means a trend reversal, although this does not happen every time. However, the CCI oscillator is indispensable in breakout strategies. If a trader sees a peak or trough marked in the 100% zone, then pending orders Buy/Sell Stop placed above or below this mark can bring short-term profit in 70% of cases.
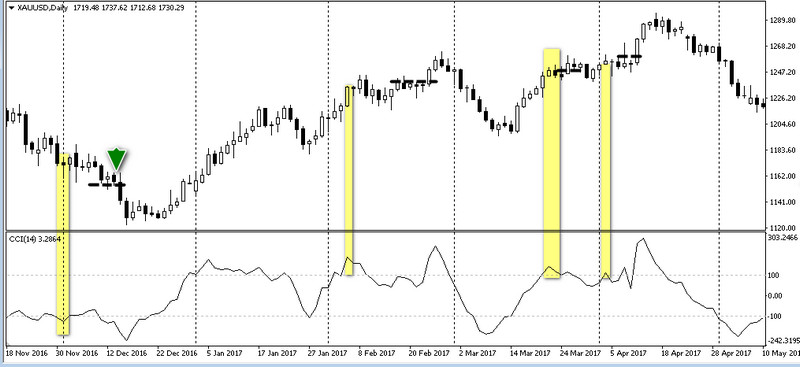
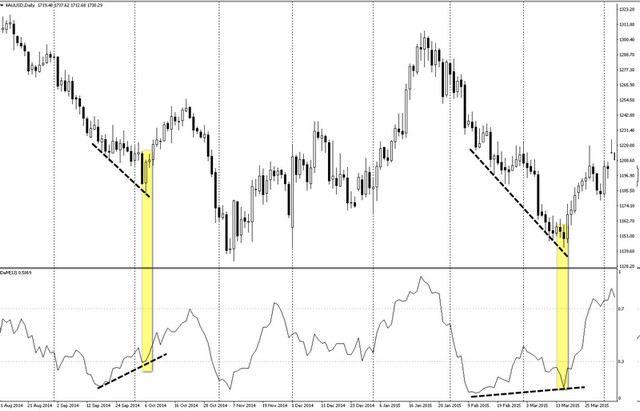
The author of the tool, the well-known analyst Thomas DeMark, does not take into account local highs and lows of the chart in the formula if they do not update previous extremes. This forces the indicator curve to return below overbought/oversold conditions and gives traders a valuable tool for searching for divergences.
They appear when the oscillator curve, having set a new maximum or minimum beyond the zone, pulls back and returns again, but is no longer able to renew the extreme, while the market continues to fall or rise. The reverse variant is also possible: highs and lows on the oscillator that are not confirmed by the currency pair.
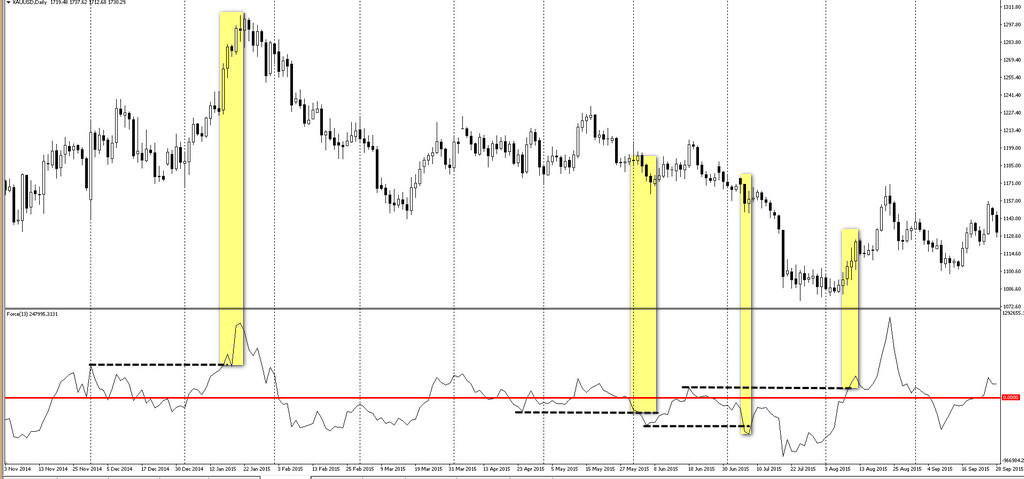
The indicator formula multiplies the difference in average bar prices by the current trading volume, showing the entry of large players into the market. The indicator is ideal for breakout strategies when its readings exceed its own lows or highs of the previous month. This means a strong short-term movement with a mandatory renewal of local extremes by the currency pair.
Widely used oscillators in the Forex market

In the Forex market, there is no ranking of indicators because of the difficulty of such an assessment. As has already been repeatedly noted, a trading system of several instruments can bring profit. It is difficult to determine the separate contribution of each indicator, but it is necessary to note the most common ones included in many strategies.
Among them, Stochastic Oscillator ranks first, and the secrets of its use are described in our article on the site. MACD can be placed in second position: this oscillator provides a whole range of trading signals, and different ways to use them are also described on our site.
Traders give third place to RSI as the easiest indicator for interpreting overbought and oversold zones. This oscillator is often combined with trend systems, and our site has an improved version of this tool. Fourth place can be given to Momentum - a gauge of price impulse and a kind of trend direction indicator.
Conclusion

The Forex market differs from securities and commodity trading instruments by having more technical price movement and more stable volatility. It rises sharply only during periods of severe economic crises, which occur once every few years.
During periods of stability, currencies correct and change trends much more often than stock indices or commodity instruments, which opens more opportunities for intraday and medium-term speculation. In this case, oscillators are indispensable, but the specific choice of instrument will largely depend on the trader's trading style.
If you can accurately identify reliable resistance and support levels, then divergences will complement the strategy. In breakout tactics, you can use CCI, while the MACD indicator will help in holding positions and when building a pyramid of orders.
Despite the common list of oscillators listed in the article, a trader should remember that the same strategy never produces the same results. This axiom is a reason to choose exactly the oscillator that is convenient and understandable.
Tools that work on similar principles for determining overbought/oversold conditions can always be replaced if this does not affect profitability. It can be checked in the Metatrader tester before launching live trading.
Traders can familiarize themselves with classic oscillators and dozens of their various modifications in the corresponding section of our forum.
Respectfully, Ivan Petrov
Tlap.io