
Bears/Bulls Power: Studying Alexander Elder's Oscillators

The Bears/Bulls Power indicator is an original development by psychiatrist Alexander Elder, which forms the basis of the "Market X-Ray" strategy described in the book "Trading for a Living." Having become a trader, Elder managed to apply professional medical skills in market trading, concentrating on finding methods for analyzing "crowd behavior."
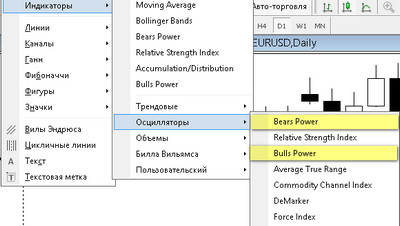
Bears/Bulls Power oscillators are standard in MetaTrader 4/5. In today's material, we will get thoroughly acquainted with them. For modern traders, this Elder development may be interesting because one of the strongest technical signals is used in trading: divergence.

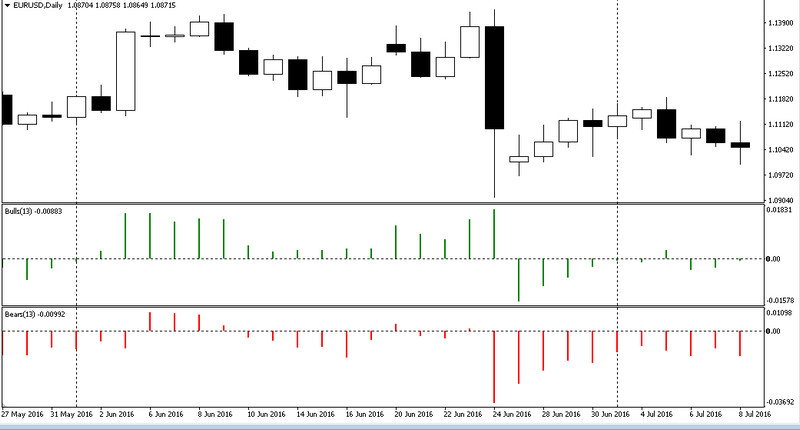
In his book, which became a bestseller in the 1990s among traders in the CIS and beyond, the author proposed a simple and effective way to measure bulls' strength and bears' strength separately. Elder calculated the difference between the average value of the high and the low of each candle, displaying it as two separate histograms in the lower panel of the chart.
Indicator Characteristics
Platform: Any
Currency pairs: any
Timeframe: D1
Trading time: around the clock
Recommended brokers: Alpari, InstaForex, Forex4you
Description of How the Indicator Works

The Bears and Bulls Power indicators are presented separately from each other in trading platforms, but are used only together. Bulls shows the strength of bulls (buyers), Bears shows the strength of bears (sellers) over the period selected by the trader.
Alexander Elder determined crowd sentiment only on daily charts using an exponential moving average line calculated over a 13-day interval. The author explained the choice of this indicator type by the presence of weighting coefficients in the formula that increase the contribution of current candles when calculating the average value of the period:
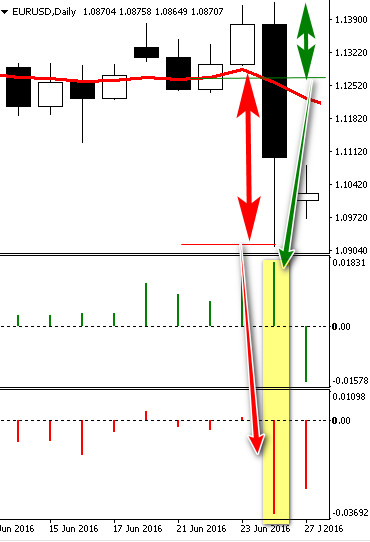
Using the example of a falling daily candle, one can observe that positive values of the Bulls Power histogram are obtained when the High closes above the EMA moving average, while negative values of Bears Power are obtained when the Low closes below the EMA.
A strong rising trend will "direct" the histogram bars above zero, while the High/Low of a candle closing above the EMA curve will correspond to positive values of both indicators. The end of the trend, that is, the moment the moving average is crossed in either direction, will be equal to the zero value of Bears and Bulls Power.
Using the Indicator in Trading

Alexander Elder strongly recommended using Bears and Bulls Power indicators as part of trading systems, and also trading only with the trend determined by the "Three Screens" method.
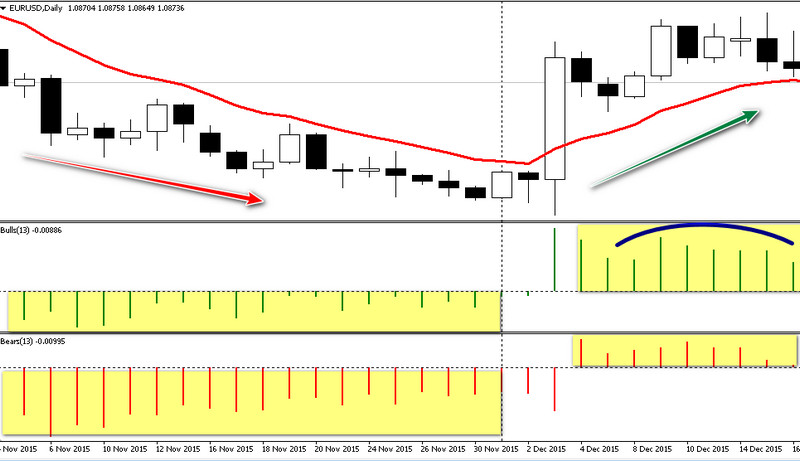
As an example of using the indicators separately, one can take a system for detecting early entries. It is based on divergence between the strength of bulls and bears, which often arises when the trend changes, when one of these groups makes unexpectedly large efforts to reverse the previous movement.
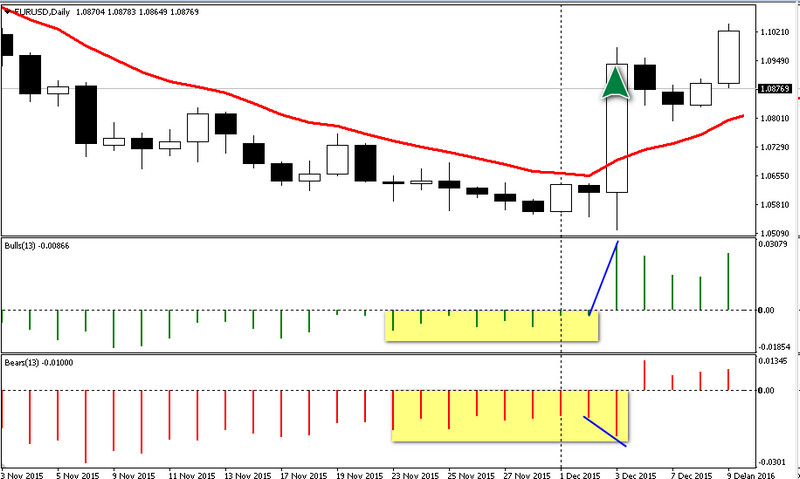
On the chart below, you can see a falling trend that ends with a sharp upward impulse, causing the Bulls bar to move into the positive area. Despite the increase in bulls' strength, the bears' histogram bars also continue to grow.
The resulting divergence gives a Buy signal on the currency pair, because important conditions are met:
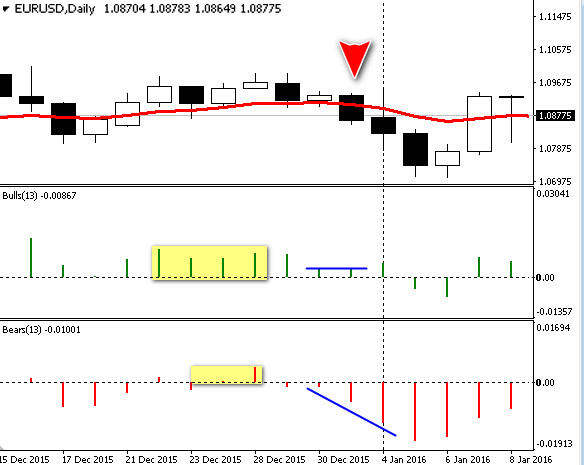
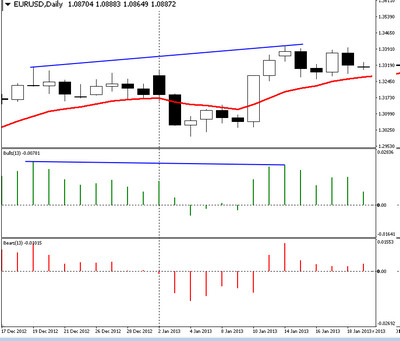
Below are implicit divergence signals for a Short position. Both histograms were in the positive zone for a short time before the divergence occurred, and the two Bulls bars have equal values at the point of divergence.
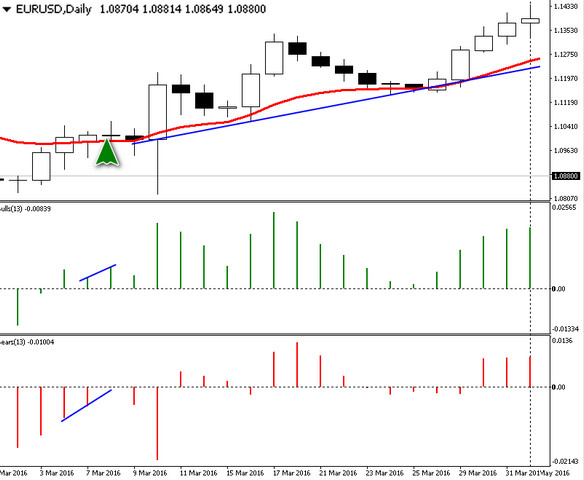
Classic entry signals based on Bears and Bulls Power signals represent a set of rules from the author of the indicators, described in the book "How to Play and Win at the Stock Market."
A Long position is opened at the market price provided that:
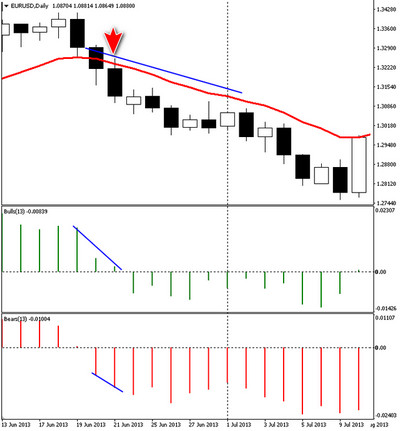
A Short position is opened at the market price if the conditions are met:
During periods when prolonged trends arise in the market, Alexander Elder suggested building a pyramid of trades, increasing the position along the trend:
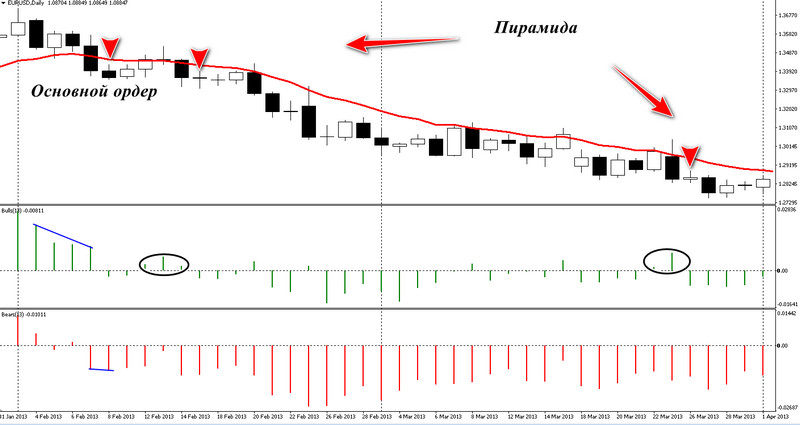
The bulls and bears strength indicator belongs to oscillators, which implies the presence of divergences, discrepancies with the quotes of currency pairs. They are interpreted as a possible end of the trend or arise before flat zones.
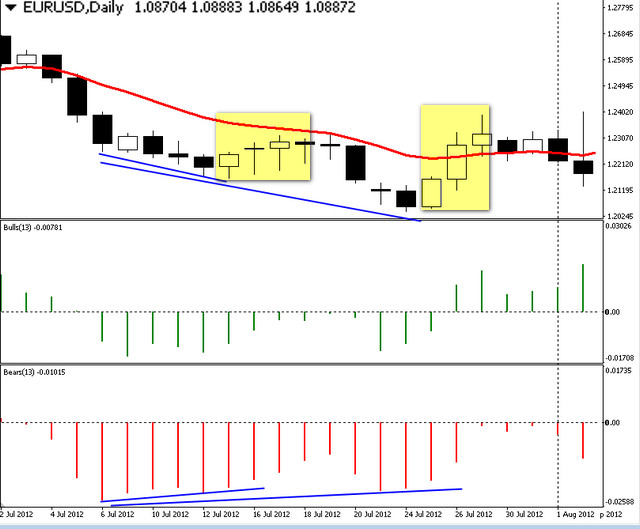
If there is a downward trend on the chart, then the search for divergences is carried out using Bears Power, comparing new lows of the rate with histogram readings. This means that the bears have "run out of steam" and give speculator bulls a chance to profit from an upward correction due to a reduction in short volumes.
Divergences for a rising trend can be confirmed only on the Bulls Power indicator. Bulls lack the volume to continue the movement, which affects the reduction of the candle range. This is a moment for a downward correction or a full trend reversal if the bulls do not want to buy back the local "dump."
Money management in this strategy consists of the traditional placement of protective orders just above the nearest highs or lows for all strategies; the only difference is in position management. Entering on divergences between the two indicators themselves or between the indicators and quotes implies short-term trades lasting one or two candles.
If the trader continues to hold the position in profit, the stop-loss should be moved to breakeven at the very first positive candle close or look for an opportunity to close the position at the entry price when the current loss forms after two working timeframes have passed.
Conclusion

Alexander Elder created the Bears/Bulls Power indicators, trying to transform the fluctuations of market quote charts into a form understandable for beginner traders. The two oscillators clearly show the strength and direction of the trend, and also unambiguously determine entry points.
Despite the use of EMA, Elder's formula eliminates the delays typical of the moving average - on the contrary, divergences of Bears/Bulls Power with price readings act as leading signals of a trend correction or reversal.
Respectfully, Alexey Vergunov
Tlap.io
