
Determining Support/Resistance Levels Automatically

Good day, fellow traders. Not so long ago, in a separate video lesson, we got acquainted with support/resistance levels. However, for beginners it is sometimes not always easy to determine their location and degree of importance, since many weak levels should not be taken into account. The PowerDynamiteAreas forex indicator will help beginners.
The name of the indicator is pompous, but it does its job. Installation is not difficult (see How to install a forex indicator), we open a chart with the currency and timeframe we need, attach PowerDynamiteAreas to it, and get a picture like in the screenshot:
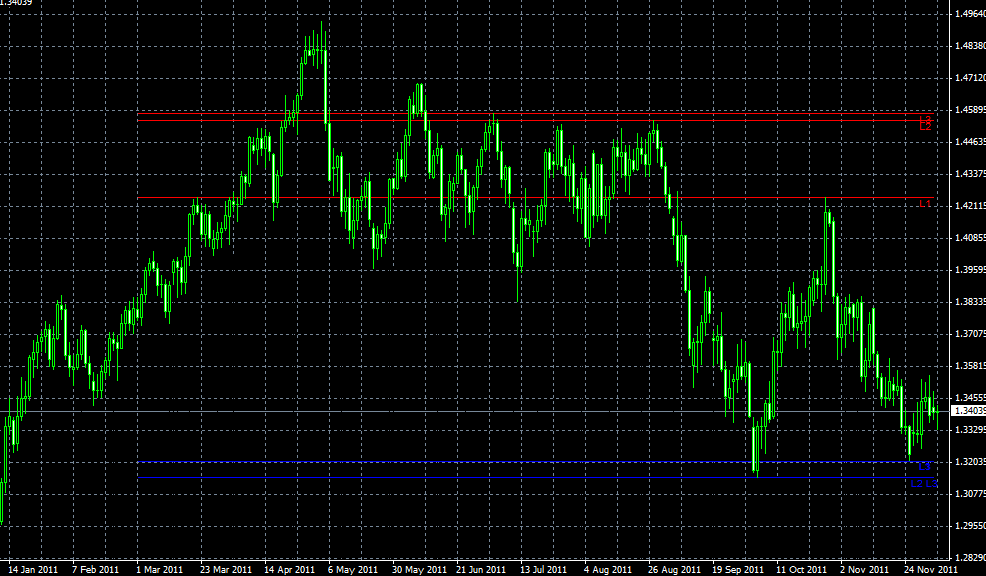
Resistance levels are shown with red lines, and support levels with blue ones. The number of displayed levels, as well as their degree of importance, are easily configured in the indicator parameters. We go into the PowerDynamiteAreas settings and see a list like this:
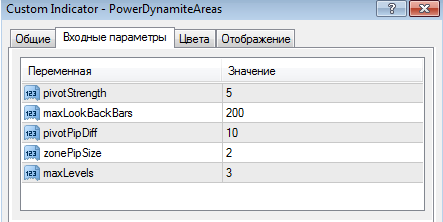
pivotStrength – the degree of importance of the displayed levels, you can set values from 1 to 7
maxLookBackBars – how many recent candles (bars) to take into account
pivotPipDiff – the minimum distance between levels (in points)
zonePipSize – the thickness of the lines (in points)
MaxLevels – the maximum number of displayed levels (if set to 3, the indicator will show 3 support lines and 3 resistance lines)
The values, as usual, are specified in old points (4 digits).
Download the PowerDynamiteAreas Forex Indicator
