
ATR: an indicator you can't do without
 The technical indicator Average True Range (ATR) is a measure of market volatility. It was introduced by Welles Wilder in the book "New Concepts in Technical Trading Systems," and since then the indicator has been used as a component of many other indicators and trading systems. It is quite a popular indicator included in most market analysis programs. Its main purpose is setting correct Stop-Loss levels. This is the most effective method of placing stops, as statistics prove.
Average True Range also serves as a trend filter. It can be interpreted by the same rules as other volatility indicators. The forecasting principle using ATR is formulated as follows: the higher the indicator value, the higher the probability of a trend change; the lower its value, the weaker the trend direction. A detailed review of the indicator is in today's material.
Indicator characteristics
Platform: any
Currency pairs: Any
Timeframe: any from H1 and above
Trading time: around the clock
Indicator type: oscillator
Recommended brokers: Alpari, Exness
Calculation

True Range is the greatest of the following three values:
the difference between the current high and low; the difference between the previous closing price and the current high; the difference between the previous closing price and the current low.
True Range = Max(High-Low; High - Close; Close-Low)
The Average True Range indicator represents a moving average of true range values:
Average True Range = SMA(TR,N), where TR is the true range, N is the averaging period, SMA is a simple moving average.
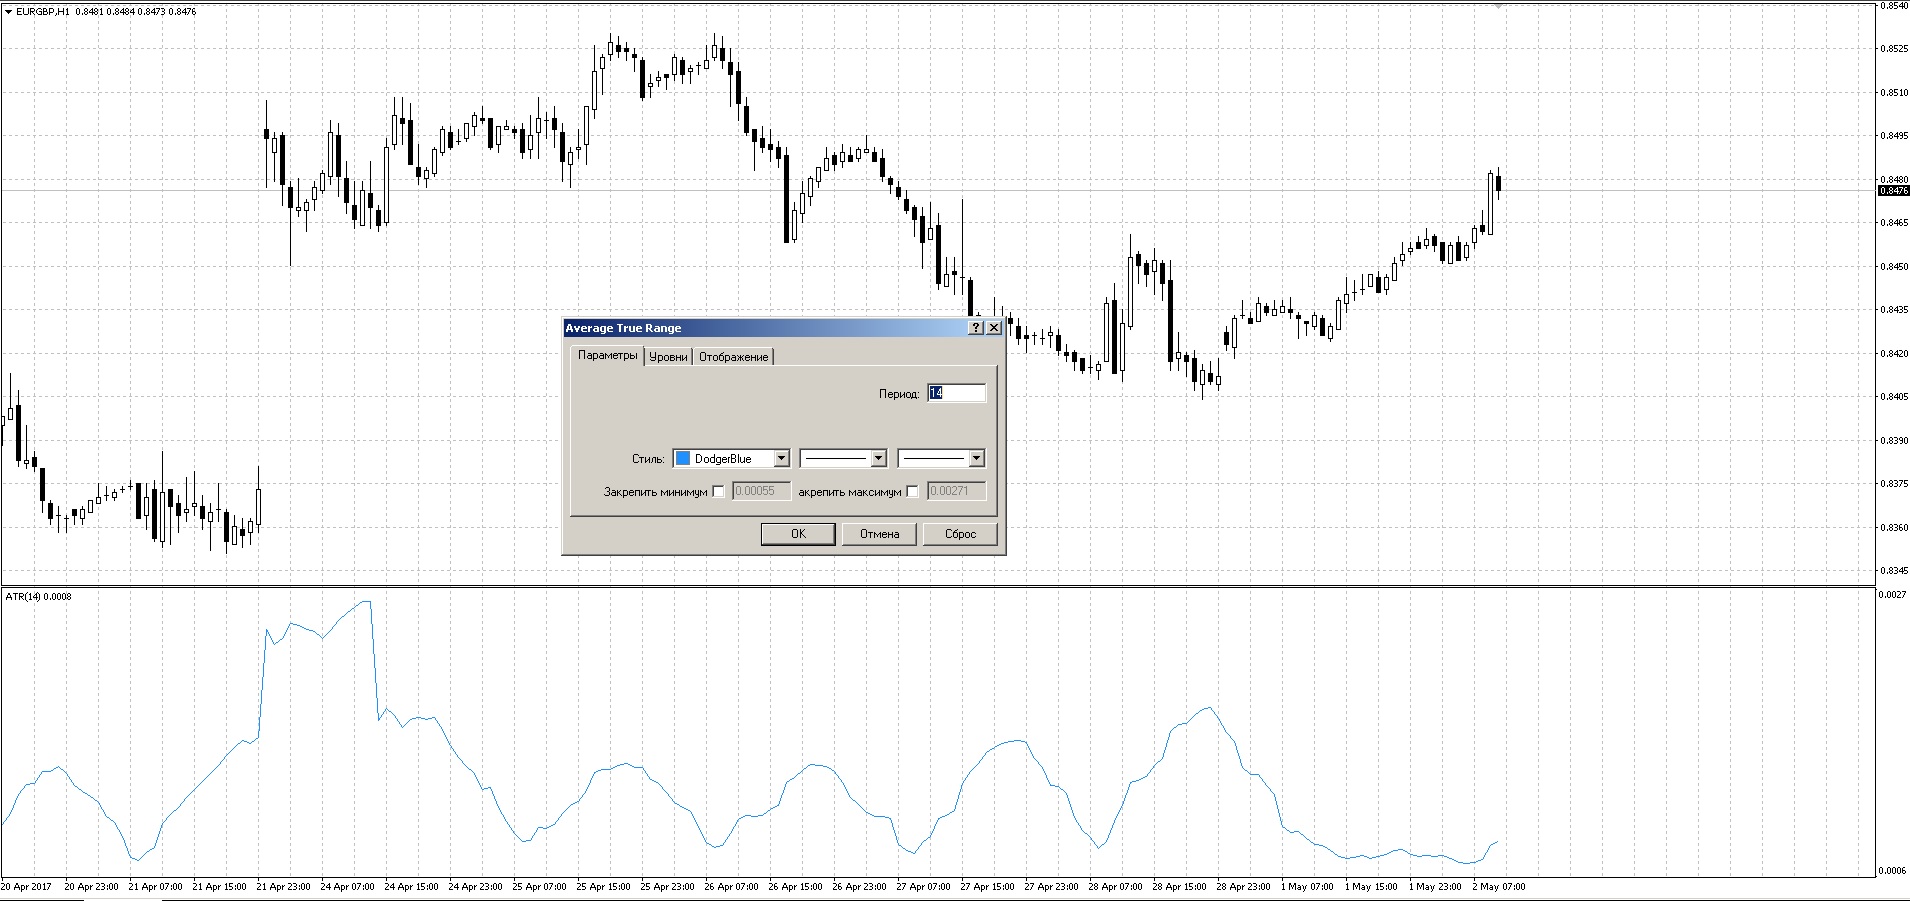 Only the averaging period is available in the ATR indicator settings, and by default it is equal to 14.
Using ATR as a filter

ATR can be used as a trend filter. To do this, you need to place a midline on the ATR chart. Its breakout produces the most significant price movements. The indicator has no and cannot have negative values, and it also has no defined midline. It is chosen by eye, separately for each market. I advise using a long-period moving average as the midline on the ATR chart. As long as ATR is below its moving average, movements are insignificant and the market is calm. When ATR breaks above its average from below, a trend begins. In addition, some traders recommend using the indicator on several timeframes, for example on H1 and D1. If their directions are aligned and on the lower timeframe the indicator has crossed its midline, the market has come alive. I repeat once again, ATR and the midline need to be adjusted for each market and each timeframe separately.
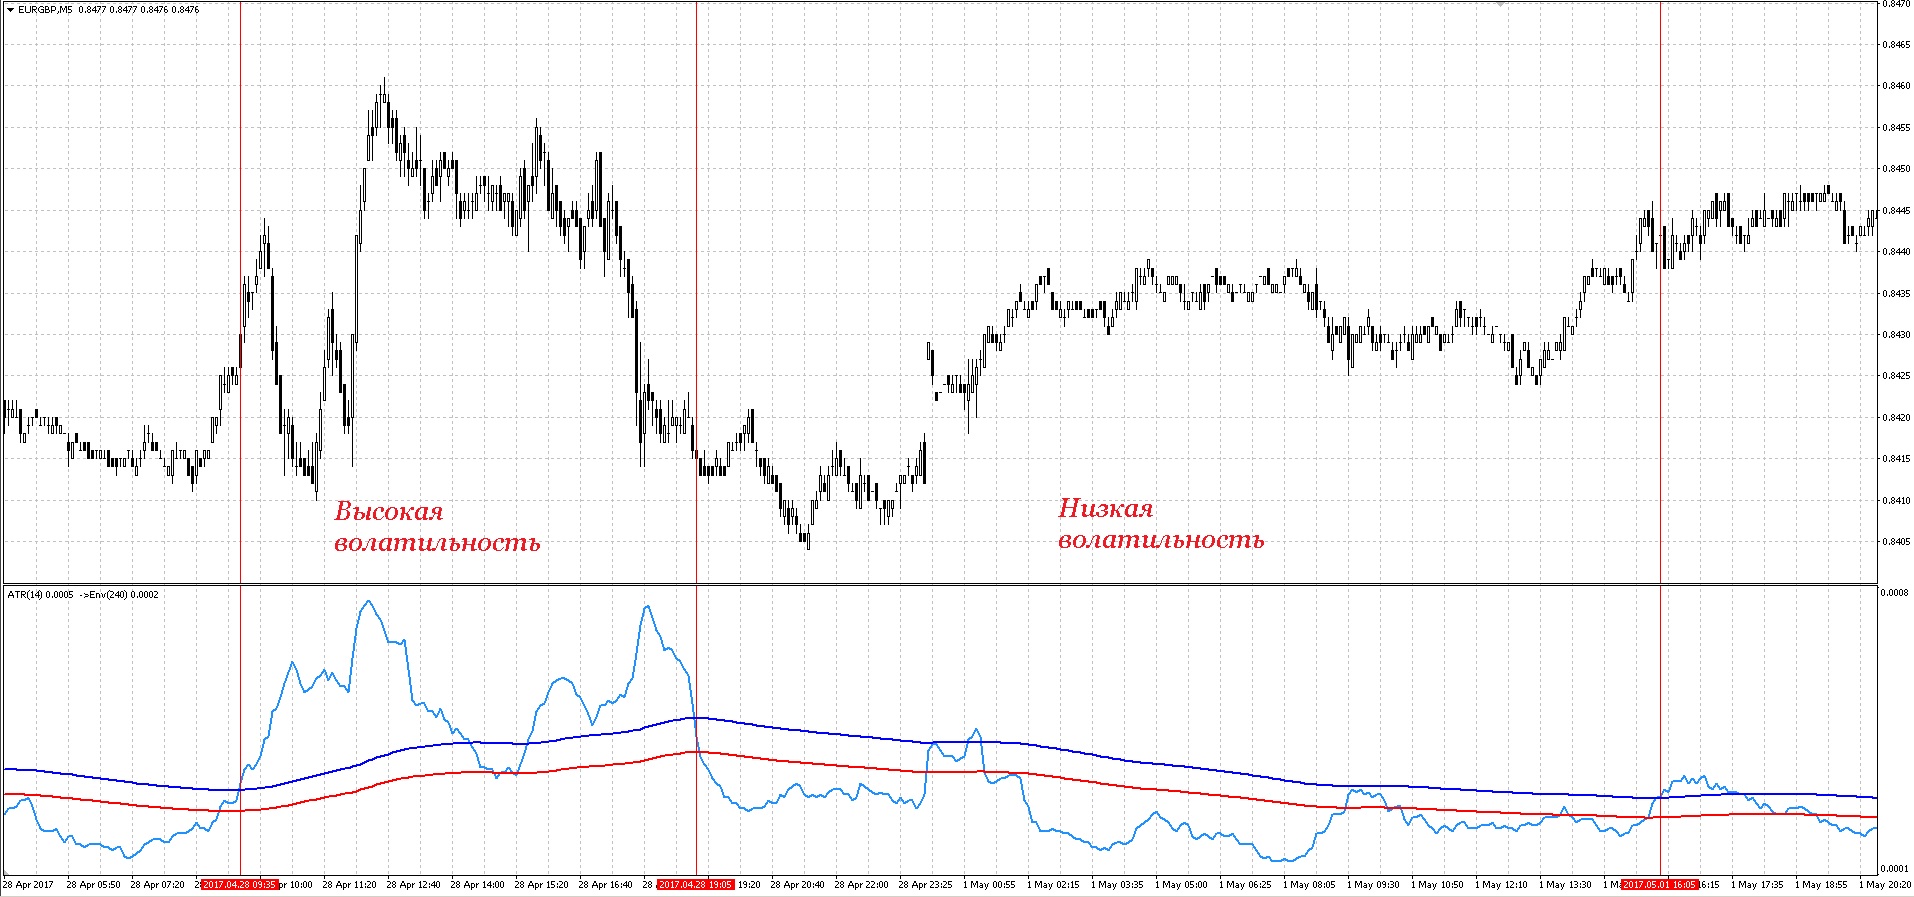 ATR14 and MA100 work excellently as a midline for determining trading time in trading systems based on the mean reversion principle. The Envelopes indicator (240) applied to ATR values also performs very well: when ATR is below Envelopes, volatility is low, and after an upward channel breakout sharp volatile moves are possible. ATR is also often used to determine the average candle length. For example, if the current ATR reading is greater than, say, 20, or conversely less than 10, the trade entry is skipped. Everything here is quite logical: if the candles in the current market are too small, the profit potential is low. If the candles are too large, then most likely some extreme events are taking place in the market, such as the release of important economic news. And as we all know, during news releases the market is quite unstable and the further direction of the instrument is poorly predictable.
Using ATR for exits

ATR is often used to set an adaptive stop loss, both fixed and floating (trailing stop). I personally like the idea of setting stops based on volatility and often use this option specifically for trailing. As a rule, to calculate the required stop order size, the indicator value is multiplied by a certain constant that depends on the theoretical duration of the future trade. For hourly charts, for example, you can take a constant equal to 2-4. That is, for example, for a EURUSD trade with ATR=0,0062 on the hourly chart, we multiply 6,2 by a constant, for example 3, and our stop comes out to about 18 — 19 points.
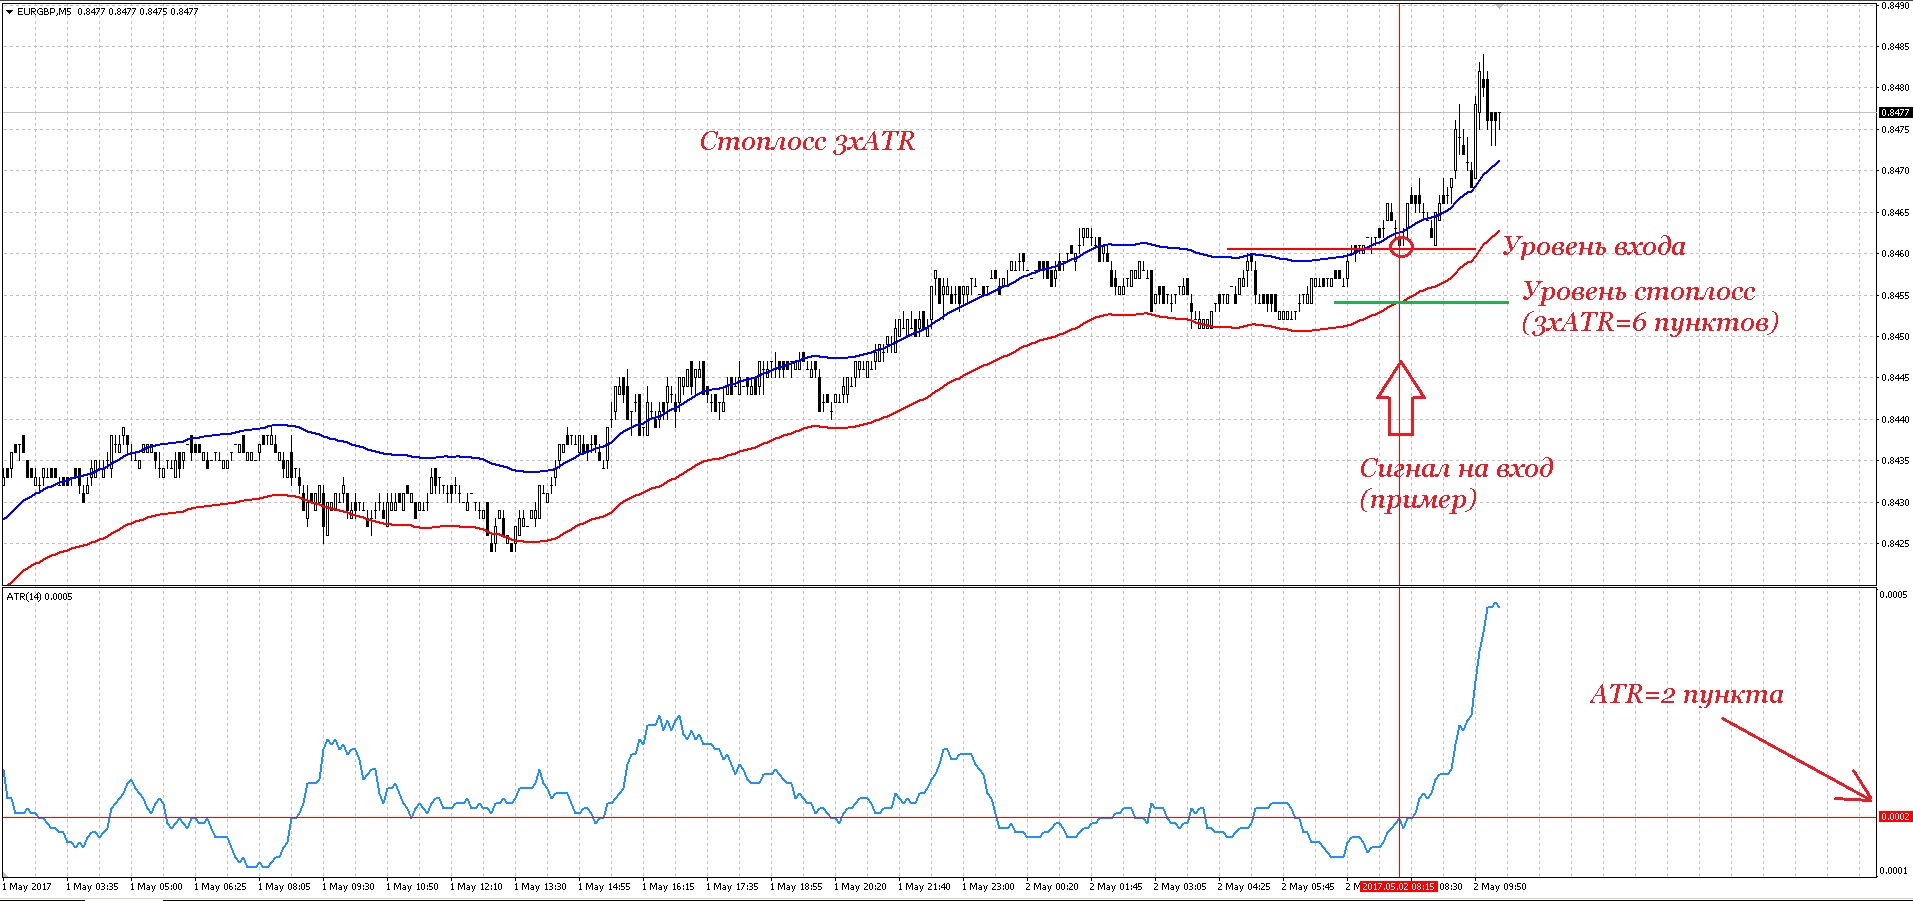 It is much more convenient (and I think it would be quite correct and logical) to use ATR for a trailing stop. In this case, the trailing distance automatically adapts to the current market volatility. For example, we entered a trade, accumulated a certain profit on the position, and at a set distance the trail began pulling up toward the price. The price, in turn, began a sharp move in the right direction. At the same time, the trail stays at quite a large distance, giving the market an opportunity to keep moving further. Then the movement ends and a flat begins. ATR accordingly falls and our trail becomes shorter, so the stop moves closer to the price. As is known, after periods of a strong trend a flat appears, after which the price again starts moving sharply, and not necessarily in our direction. In the case of a reversal after a flat period, we will lose little because our stop will have been pulled close enough to the price. In the case of continuation, the picture repeats again and again, up to the eventual activation of our stop order.
Volatility filter for programmers

And as a bonus for those who can program (or are learning), I decided to post my own version of a function that forbids trading during high volatility.
extern bool          UseATRFilter = true;
extern int           ATRPer =       14;
extern int           EnvPer =       240;
input ENUM_MA_METHOD EnvMode =      MODE_EMA;
extern double        EnvDev =       10;

bool ATRFilter()
{
   if(!UseATRFilter) return(true);
   double ATR;
   for(int i=0;i<=499;i++)
   {
      ATR=iATR(_Symbol,PERIOD_M5,ATRPer,i+1);
   }
   ArraySetAsSeries(ATR,true);
   double ATR1=iATR(_Symbol,PERIOD_M5,ATRPer,1);
   double EnvUp=iEnvelopesOnArray(ATR,0,EnvPer,
                EnvMode,0,EnvDev,MODE_UPPER,0);
   if(ATR1<EnvUp) return(true);
   return(false);
}
This function returns false if the current market volatility is too high for trading, and true if the ATR indicator is below the Envelopes channels. The function really does significantly improve the results of advisors that use channel-trading principles, at least those in which I tried to apply it. In addition, I think it will also be useful for trading systems for which, on the contrary, a low level of volatility brings losses, although I have not yet tested it in that role.
Conclusion

Without the ATR indicator, it is difficult to imagine any at all serious advisor. This indicator is extremely often used when building automated trading systems, especially when you need to build volatility filters or better adapt various values to the market. ATR is also indispensable wherever there are any measurements in points: instead of rigidly specifying, for example, the height of some candlestick pattern, it is much more convenient to indicate these values as an ATR reading multiplied by a certain coefficient, and thus flexibly adapt your model to current market volatility. Despite the widespread use of ATR in algo trading, manual traders often underestimate the capabilities and usefulness of this indicator. I hope this article will convince many traders to take a closer look at such a useful indicator as ATR.
Respectfully, Dmitry aka Silentspec TradeLikeaPro.ru
