
Astrotrading: The Law of Vibration and Gann Cycles
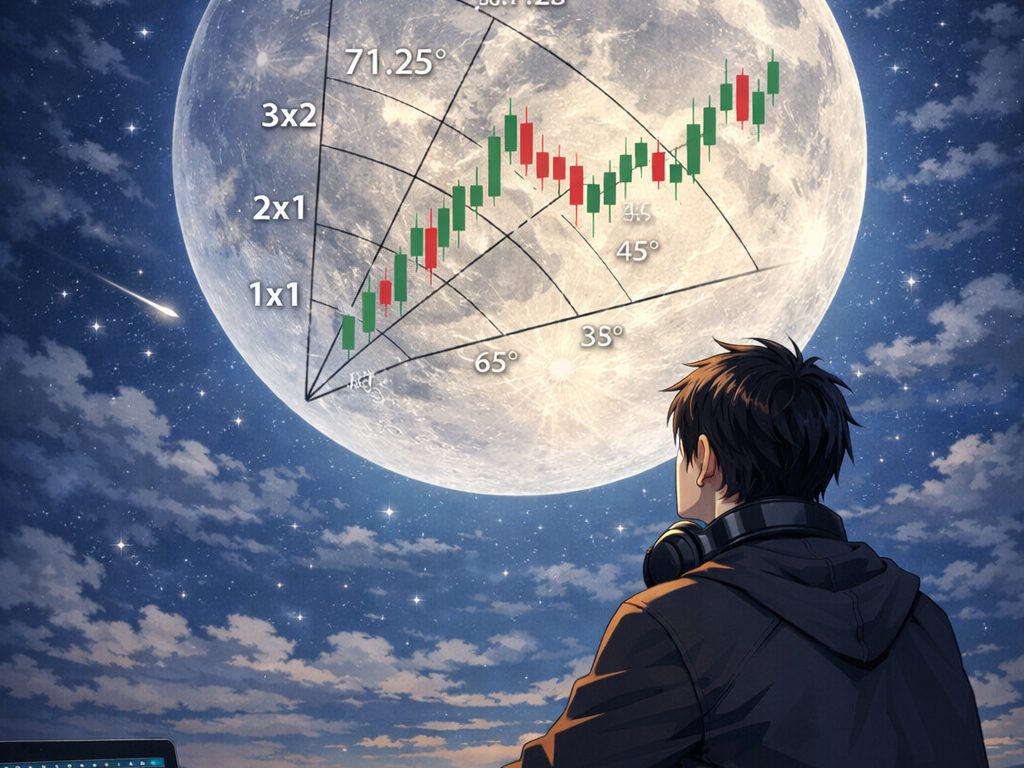
Interest in astrotrading is not a new phenomenon, but in recent years, especially in the volatile crypto market, it has been experiencing a noticeable renaissance.
The reason for the growing popularity of astrotrading is very simple. Many traders, after a series of losses, begin searching for a new Grail, and astrology as a method of explaining market behavior is quite suitable for that.
Traders follow the cycles of the Moon (for example, the difference in returns between the new moon and the full moon), periods of planetary retrogrades (considered times of uncertainty and trend reversals), and also compare asset prices with zodiacal degrees.
The most famous astrologer on the stock exchange was William Gann, who created a complex system of analysis combining geometry, astrology, and numerology. Gann believed that the key to understanding markets lies in cycles: the rotation of the Earth, the movement of the Moon around the Earth, and the revolution of the Earth around the Sun.
What led Gann to become a fan of lunar and planetary cycles? Coincidence, simple coincidence. Even in his youth he noticed that the standard trading day lasted 6.5 hours, but taking the lunch break into account it came to exactly 360 minutes. A circle, as is known, is divided into 360 degrees. And that means the market obeys the same laws as the celestial sphere.
For these reasons, many people, hearing Gann's name, immediately imagine astrological charts and planetary aspects, especially after reading his novel «Tunnel Through the Air».
Astrology and numerology have not gone anywhere in the age of algorithms. For example, new indicators are constantly published on TradingView that combine different methods of technical analysis and astronomical cycles. Quite recently (in February 2026), for example, the Gann o Maticus indicator appeared and became an Editors' Pick.
In this article, we will examine the theory of Gann's astrological cycles and test the Gann o Maticus indicator.
Enjoy the reading, and remember that this material is purely informational in nature and cannot and should not be regarded as a consultation or advice.
Astrotrading in the Style of Gann
«Tunnel Through the Air»: The Book That Encrypted the Secret
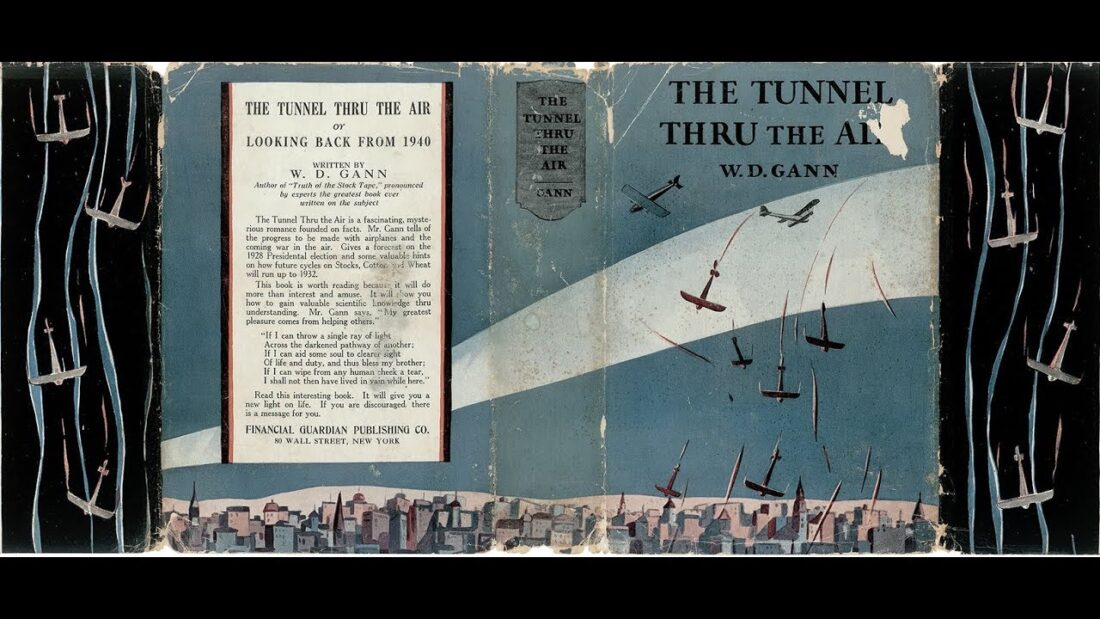
In 1927 Gann published the science-fiction novel «Tunnel Through the Air, or Looking Back from 1940».
In the preface he made an intriguing statement:
The book contains "a valuable secret, hidden in veiled language. Some will find it on the first reading, others on the second, but most will need to read the book three times."
Since then, several generations of traders have been trying to decipher this novel, believing that Gann encoded his astrological methods in it.
The plot of the book describes an imaginary war from April 1930 to July 1932. Many researchers believe that it was not a military but an economic allegory, a prediction of the Great Depression.
Comparing the dates from the book with the movement of the Dow Jones index shows astonishing coincidences:
| Column 1 | Column 2 | Column 3 |
|---|---|---|
| Date in the book | Event | Action on the market |
| Autumn 1929 | US threats | Crash of 1929 |
| April 1930 | Japan declares war | Major top below 300 |
| July 4, 1932 | USA wins the war | The end of the bear market |
Thus, on page 12 there is a mention that the hero had ideas 100 years ahead. 12*12 = 144, the number that underlies the famous Gann Square of 144. On page 56 the word "eclipse" appears once. 56 years make up approximately three Saros cycles, a full eclipse cycle. And on page 69 the hero openly speaks of faith in "signs and stars." In astrology, 69° is the position of Cancer, where the hero's natal Venus was located.
Petter Ivar Amundsen, a Norwegian researcher of Gann's legacy, discovered that the title of the book may be an anagram. Replacing "1940" with letters (1×9×4=36, 3×6=18 → R; 1 and 9 as 19 → S; 9+4=13 → M), he obtained the phrase: "From the Lunar Return, Looking back to His Mother."
Marie, the hero's beloved, disappeared on June 5, 1927, when the Moon was in Leo, and returned on August 30, 1932, again with the Moon in Leo.
The Law of Vibration: The Basis of Gann's Method
At the core of Gann's method lies the so-called "Law of Vibration." According to it, each stock or commodity possesses its own "rate of vibration," which determines its movement. High prices arise because of a high rate of vibration caused by strong positive astrological influences, and vice versa.
In practice, this means that the trader must:
- Identify the beginning of the trend, the point in time and price from which the movement began.
- Determine the prevailing astrological influence, finding out which planets or aspects governed this movement. Special attention is paid to absolute highs and lows, where astrological influences are strongest.
- Calculate the rate of vibration, using Gann angles on the chart.
- Forecast the date when the influence ends, using ephemerides (tables of planetary positions).
Planetary Aspects and Their Significance in Gann's Method
In his course Gann wrote:
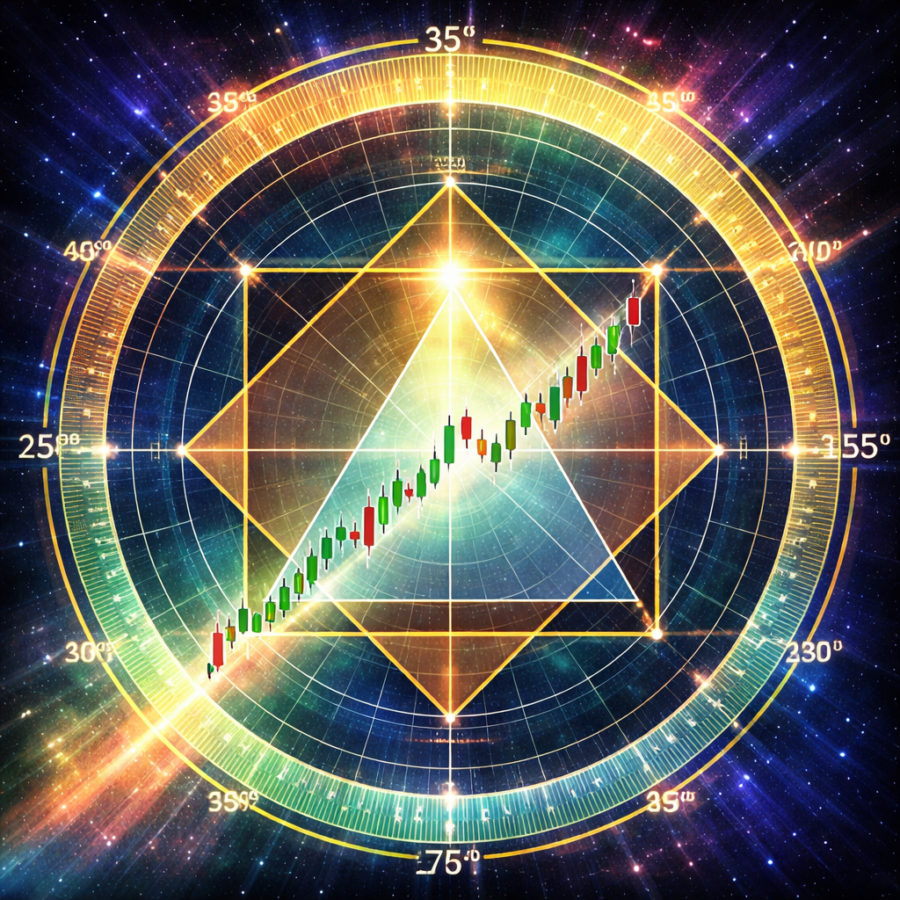
"We use three geometric forms: the circle, the square, and the triangle. We use the circle, within which are the triangle and the square, to determine time points, price levels, and spatial resistances. We use the 360-degree circle to measure time and price."
Modern followers, such as Patrick Mikula, have developed these ideas. His indicator "Master 360° Square of 12" directly ties price levels to zodiacal degrees:
- The zodiacal scale shows 12 signs.
- The degree scale divides the circle into 24 rows of 15° (from 15° to 360°/0°).
- Planetary lines allow you to track the movement of planets through the zodiac and see how their position relates to price.
When a planet moves through the zodiac, the price cell associated with it in the grid shifts. Thus the trader can follow the path of the planet through the zodiac as a path through price.
An implementation of this approach can be found in the indicator Mikula's Master 360° Square of 12.
Gann and his modern followers interpret the geocentric (the position of planets relative to the Earth) and heliocentric (the position of planets relative to the Sun) systems. Here are the main cycles Gann paid attention to:
- Lunar cycles (the fastest, ~29.5 days) New moon, optimism, the beginning of growth (a bullish signal). Full moon, emotions, volatility, often a reversal. Gann considered the Moon the market's "emotional trigger." Many modern traders note growth in the S&P 500 after the new moon.
- Cycles of the inner planets Mercury (~88 days), fast reversals, news, speculation. Retrograde Mercury is a period of confusion and false moves. Venus (~225 days), cycles in commodities (gold, oil).
- Cycles of the outer planets (long-term) Mars (~687 days ≈ 1.9 years), impulsive moves. Jupiter (~12 years), major bullish trends. Saturn (~29 years), crises and long-term reversals. Uranus, Neptune, Pluto, multi-year/century cycles (for indices and the economy).
Modern interpreters of Gann's method pay considerable attention to the retrograde motion of planets. In the indicator Mikula's Master 360° Square of 12 retrograde motion is displayed with a special symbol (℞) . The retrograde period is traditionally considered a time of revision, returns, and uncertainty, which in the market often corresponds to corrections and consolidation.
In astrology, the angles between planets are of great importance. Gann singled out two main aspects:
- Square (90°) is considered a tense aspect, often associated with crises and reversals.
- Trine (120°) is a harmonious aspect associated with smooth movement and trend continuation.
Practical Application of Astrotrading by Gann's Method
Step 1. Choosing the Starting Point
The first step in applying Gann's astrological method is choosing a significant price extremum. This can be: a historical high or low of the asset, the date of an important economic event, an astrologically significant date (for example, the moment when a planet entered a certain sign).
Step 2. Identifying the Key Planets
Gann believed that different assets are governed by different planets.
Thus, grain markets are often associated with the Moon (agriculture, planting and harvesting cycles). Industrial metals markets with Mars (war, industry) and Saturn (structure, constraints). Modern followers associate technology-company stocks and cryptocurrencies with Uranus (innovation, surprises) and Mercury (communications, information).
Step 3. Building Gann Angles
Gann angles are lines drawn from a significant point at certain angles. The main angles:
| Column 1 | Column 2 | Column 3 |
|---|---|---|
| Corner | Incline | Meaning |
| 1×1 | 45° | Unit of price per unit of time - balance line |
| 2×1 | 63,75° | Two price units per unit of time - a strong trend |
| 1×2 | 26,25° | One unit of price for two units of time - a weak trend |
| 4×1 | 75° | Very strong trend |
| 1×4 | 15° | Very weak trend |
Gann believed that these angles work not only as support and resistance levels, but also as measures of time.
Step 4. Combining with Planetary Data
Modern software products, such as Timing Solution or indicators on TradingView, make it possible to overlay planetary lines on a chart with Gann angles. The trader's task is to find points where:
- The price touches a Gann angle.
- At the same time a planet is in a significant position (an aspect to another planet, entry into a sign, change of direction).
The [MAD] Gann o Maticus Indicator on Tradingview
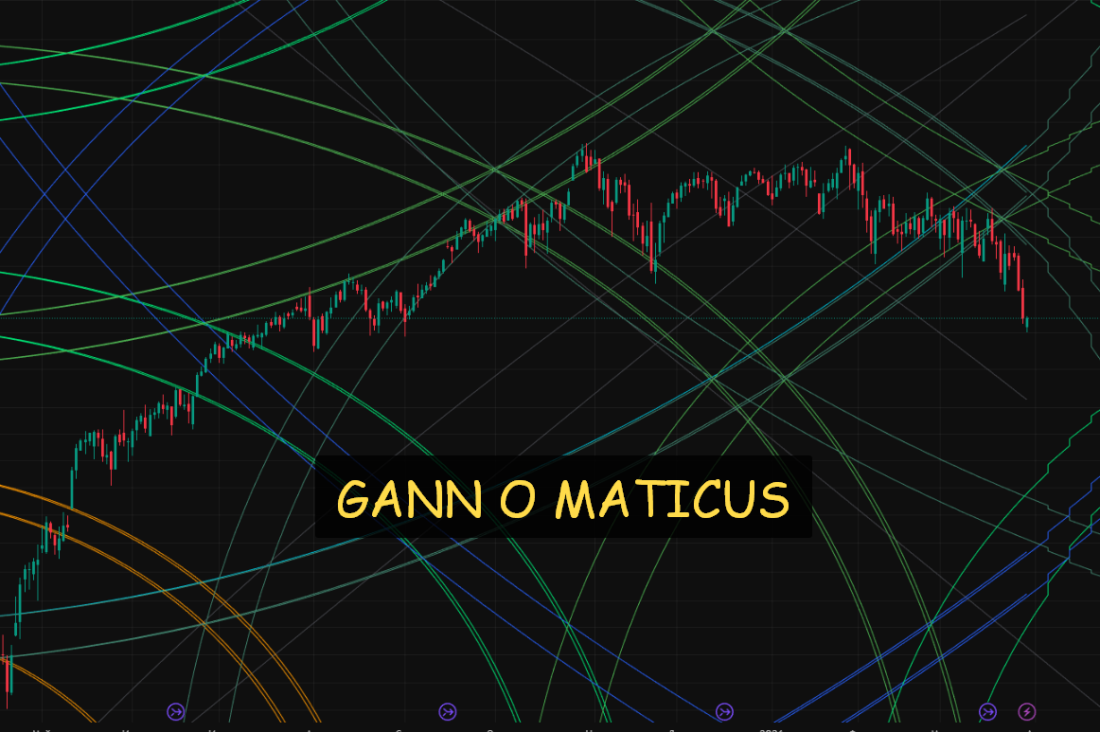
The author of the indicator Gann o Maticus is a user with the nickname djmad. At the time of writing the article, djmad had published 54 scripts and attracted 1.6 thousand followers.
The Gann o Maticus indicator was published on February 26, 2026. At the time of writing the article, the indicator page had gained more than 8.5 thousand views and 196 positive ratings.
djmad says the following about his indicator: "Gannomat is fully automated Gann grids with astrocycles (Gannomat — Full-Automated Gann Grids & AstroCycles)."
Gannomat draws a Gann square on the chart. At first glance it differs little from other Gann indicators. Every time a new period begins, whether it is a candle on the timeframe or a new astronomical event, the block resets and a new set of arcs is drawn. And it is precisely the accounting for the astronomical event that is the clear difference from other Gann indicators.
Within the framework of this article, we will talk only about the Astrocycles mode, although besides that the indicator can build reversal points, ATR, and so on. It is a very powerful tool!
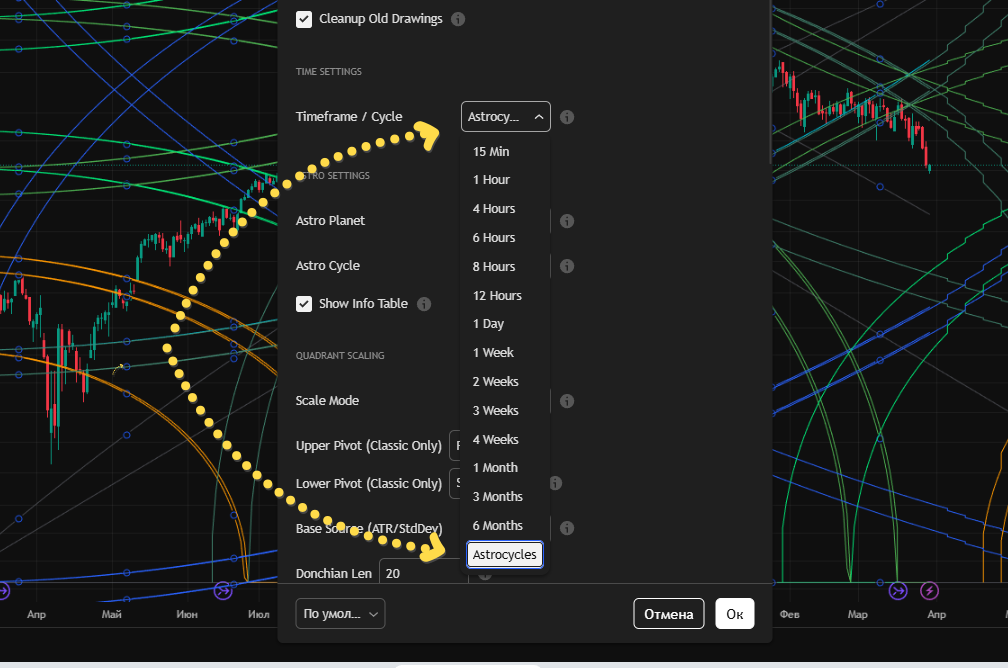
When using the "Astrocycles" mode, the information table in the upper right corner shows the active planet, the cycle type, the current cycle duration in days, and the dates of the last and next astronomical events. How the Moon and the planets influence things, and what they influence, was written in the previous section.
When Astrocycles is enabled:
- A new Gann square begins exactly at the moment of the event.
- The width of the square equals the actual duration of the cycle (for example, 27 days for the Moon or 12 years for Jupiter).
- A table appears in the upper right corner: Planet | CycleType | Duration(days) | LastEvent | NextEvent.
An astrological cycle (by default: high latitudes) is the type of astronomical event marking the beginning of a new period.
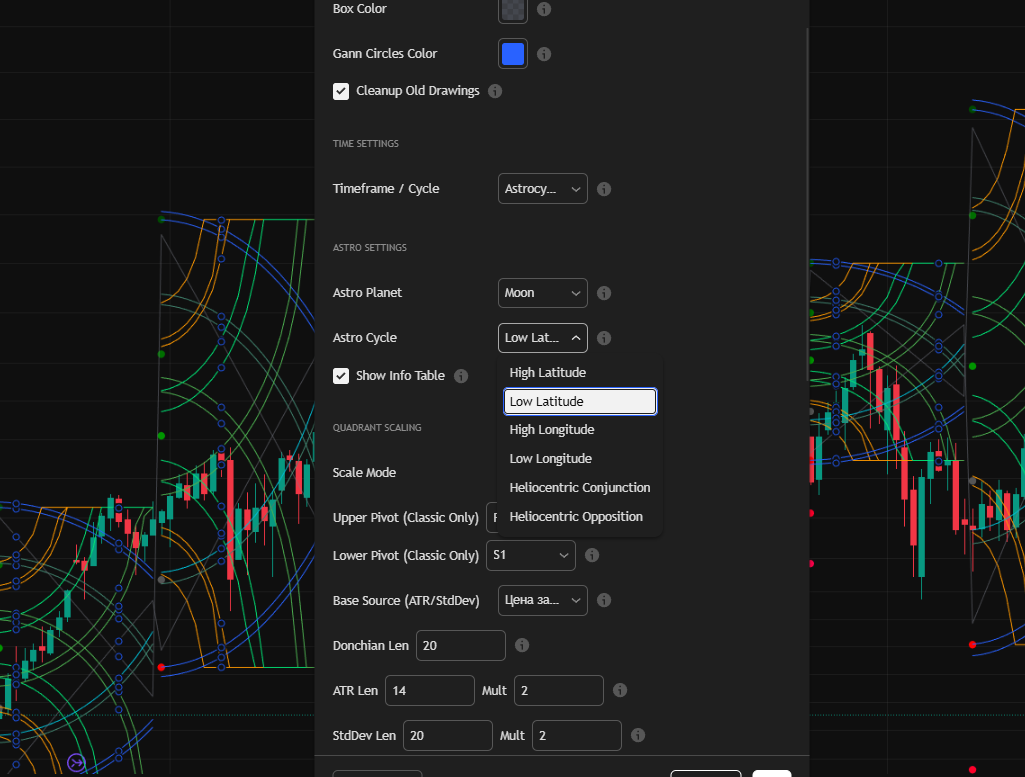
High Latitude means the planet reaches its maximum ecliptic latitude (moves as far as possible from the plane of the ecliptic). Works for all planets, including the Moon.
Low Latitude means the planet reaches its minimum ecliptic latitude (moves as close as possible to the plane of the ecliptic). Works for all planets, including the Moon.
High Longitude means the planet reaches a stationary point at which its geocentric longitude stops increasing and begins decreasing (the start of retrograde motion). Not applicable to the Moon.
Low Longitude means the planet reaches a stationary point at which its geocentric longitude stops decreasing and begins increasing again (the end of retrograde / the start of direct motion). Not applicable to the Moon.
Heliocentric Conjunction means the Earth and the selected planet are on the same side of the Sun (heliocentric distance 0°). Unavailable for the Moon.
Heliocentric Opposition means the Earth and the selected planet are on opposite sides of the Sun (heliocentric distance 180°). Unavailable for the Moon.
Example: if Moon + High Latitude is selected, the square updates about every 27 days at the moment of the Moon's maximum deviation.
How workable is this indicator?
On stock futures I could not find any patterns by eye. But, for example, BTC in some sense does respond to Gann squares built with the lunar cycle taken into account.
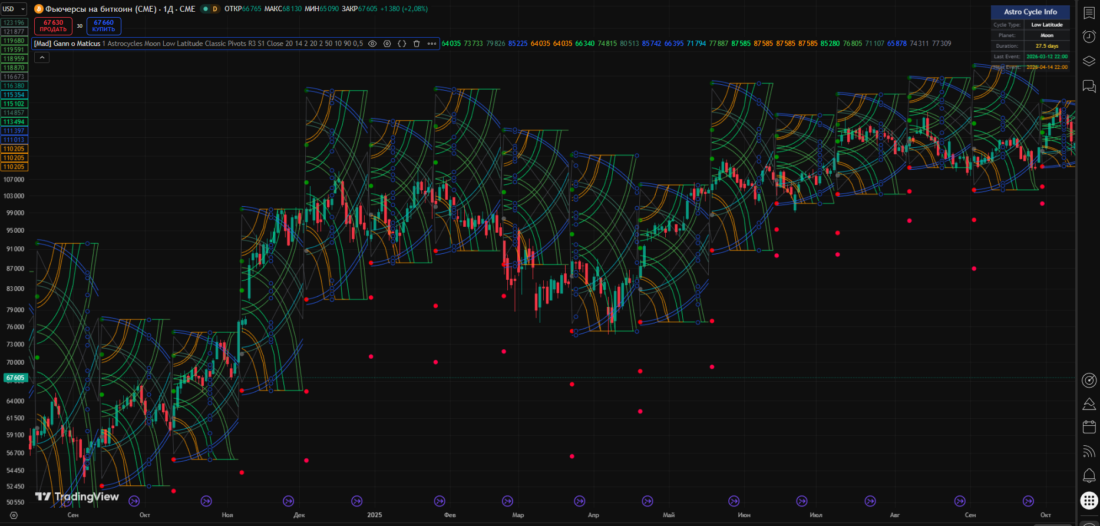
But is it worth studying very deeply? I am not sure.
Conclusion
What influences markets more, planetary cycles or, for example, self-organized criticality, let everyone decide for themselves.
One cannot deny the fact that a full moon or magnetic storms influence the behavior of some traders. But that is no longer about the exchange, but about psychology. And if the stars have indeed "aligned" (ahem) so that there is a full moon in the sky, traders are overexcited, and the market has compressed, then nothing prevents it from going into a tailspin within the framework of the theory of self-organized criticality.
Seriously speaking, astrotrading is a rather thankless occupation, characteristic of people with a mystical type of thinking. Real trading, on the other hand, is a strict system of risk calculation and rules.