
Arbitrage Detector and Arbitrage Matrix Indicators: How to Spot Arbitrage in Cryptocurrencies and the Forex Market

When a person is just starting to understand trading, they often get the feeling that an asset's price is the same everywhere. You open a Bitcoin or currency pair chart, and it seems like there is "one price for everyone."
In practice, this is not the case. The same asset can cost slightly differently on different exchanges and with different brokers. These differences are called spreads and open up opportunities for arbitrage trading.
Arbitrage Detector and Arbitrage Matrix indicators from LuxAlgo, available on TradingView, help you see and analyze these opportunities. The arbitrage detector and matrix are powerful tools for finding spread and/or market inefficiencies, which traders can and should profit from.
The quality of the Arbitrage Detector indicator was recognized by the TradingView editorial team: on December 29, 2025, Arbitrage Detector was included in the selection of the best community scripts.
In this article, we provide a detailed breakdown of the indicators and methods for their practical use.
Arbitrage Detector: an easy start and a deeper look
The Arbitrage Detector indicator from LuxAlgo automatically identifies relevant data sources for arbitraging an asset (cryptocurrency or forex), takes prices and volumes from selected venues (19 crypto exchanges and 13 forex brokers are supported), and compares them with the asset's price on the chart.
Key interface components
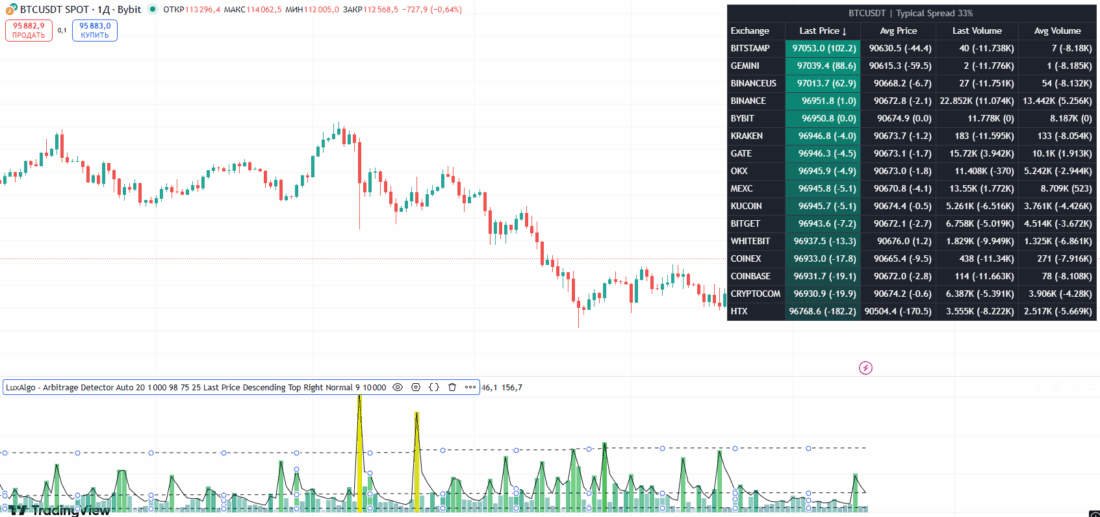
Dashboard (control panel) is a sortable list of venues with the columns "Last price," "Average price," "Volume," and "Total volume."
All dashboard columns can be sorted in ascending or descending order, or left unsorted. The sorted column is highlighted with a background gradient color.
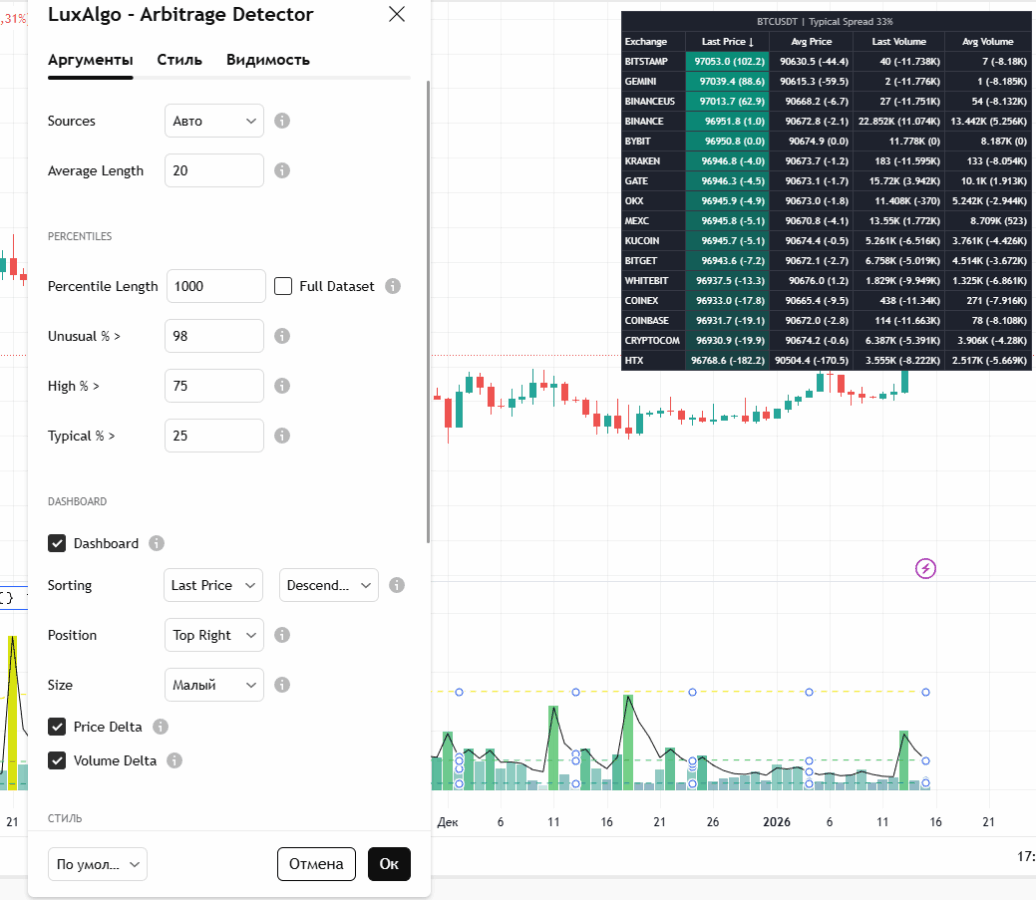
In the settings panel, you can enable or disable information about the price and volume delta between the charted asset and each exchange.
In the image above, both deltas are enabled, and the list is sorted by the Last Price column.
Spread histogram is a historical visualization of market inefficiency. It includes four percentiles (Unusual, High, Typical, Low), a gradient, and smoothing options (EMA or adaptive MA). The histogram helps assess whether the current spread was unusual in a historical context.
By default, the automatic gradient and smoothing functions are enabled in the histogram.
With automatic smoothing enabled (Histogram Smoothing with the "Auto" box checked), adaptive moving averages are used with higher values for unusual activity.
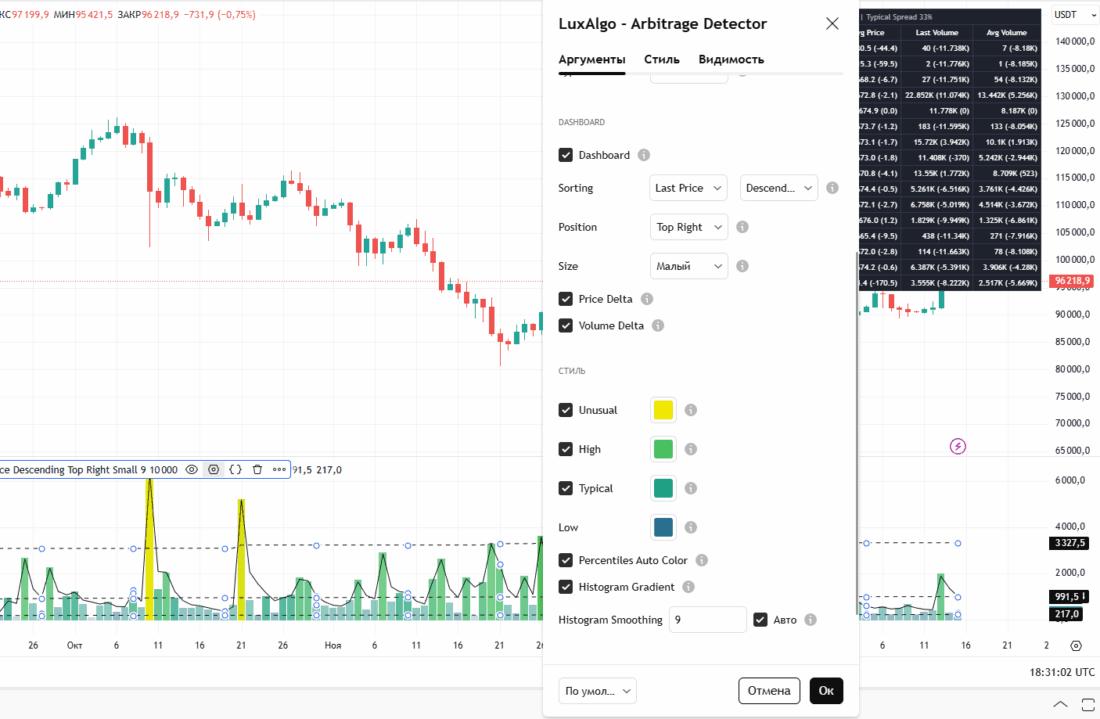
If you clear the "Auto" box, EMA will be used for the calculation (in the image below).
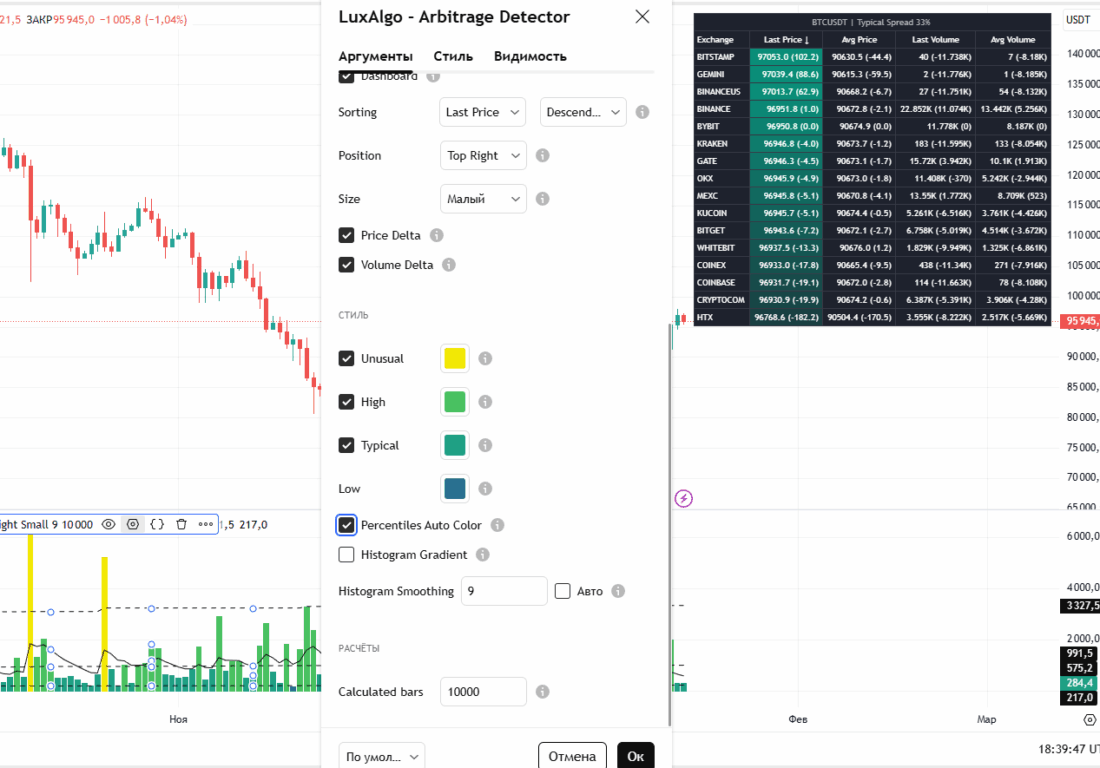
The differences between gradient and solid histogram colors are obvious.
In the case of gradient colors, the histogram corresponds to the data values: the higher the values, the more yellow there is, and the lower they are, the more green there is. In the case of solid colors, only the data above or below the specified percentiles differ.
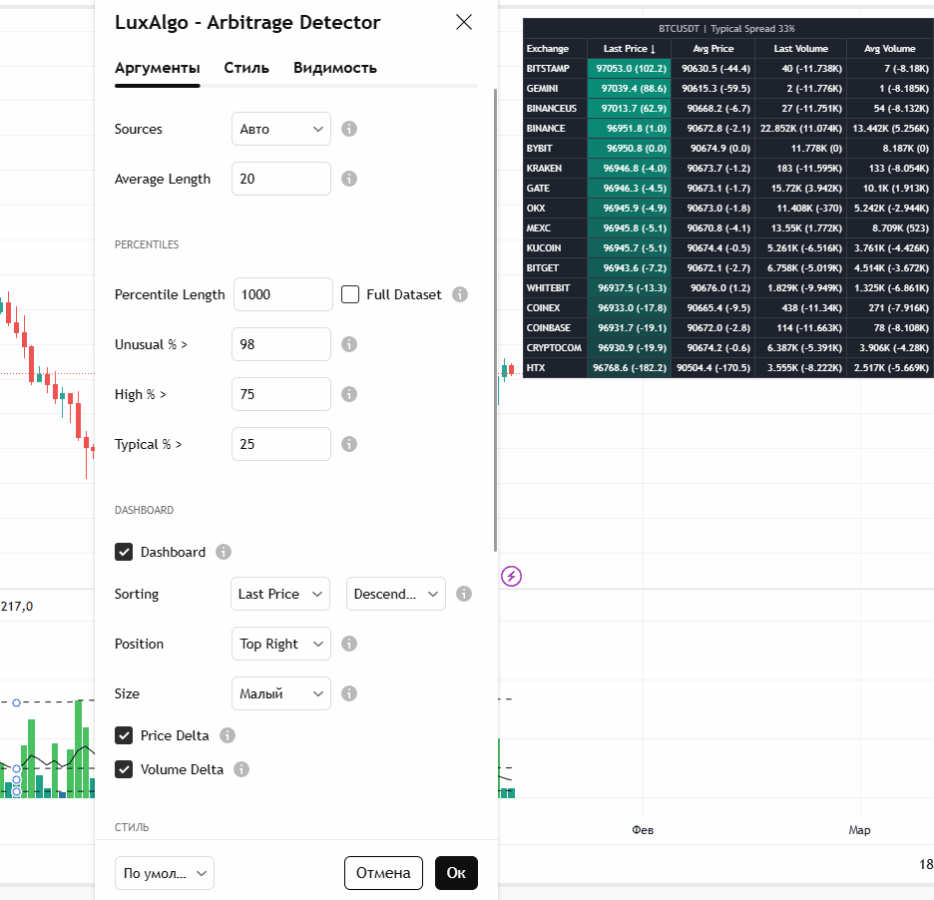
Settings
- Sources: automatic or manual selection of the asset, cryptocurrency exchanges, and forex brokers.
- Average Length: selection of the length for the average price and volume values.
Percentiles
- Percentile Length: selection of the length for percentile calculation or inclusion of the full data set (may lead to errors).
- Unusual % >: selection of the unusual percentile.
- High %>: selection of the high percentile.
- Typical % >: selection of the typical percentile.
Dashboard
- Dashboard: enable / disable the dashboard.
- Sorting: selection of the column and sorting mode.
- Position: selection of the location for the dashboard.
- Size: selection of the dashboard size.
- Price Delta: shows the price difference between each exchange and the asset on the chart.
- Volume Delta: shows the volume difference between each exchange and the asset on the chart.
Style
- Unusual: enable display of the unusual percentile and select its color.
- High: enable display of the high percentile and select its color.
- Typical: enable display of the typical percentile and select its color.
- Low: select the color for the low percentile.
- Percentiles Auto Color: enable automatic display of all percentiles.
- Histogram Gradient: enable gradient fill for the histogram.
- Histogram Smoothing: selection of the EMA smoothing length for the histogram or activation of the "Auto" function. The "Auto" function uses an adaptive moving average with the percentile rank of the data as the efficiency ratio.
Methods of using the indicator
Any arbitrage decision needs to be checked against several parameters: liquidity, fees, execution speed, and signal stability over time. Arbitrage Detector provides context: it shows on which exchanges the price differs from the market and how often such deviations repeated in the past.
In practice, this can be used in two ways: as a filter and as an analysis tool.
As a filter, the indicator helps quickly check whether the price movement is aligned across platforms; if the movement is confirmed by most sources and the volumes match, this reduces the risk of local false breakouts.
As an analysis tool, the indicator is useful for studying structural market problems: persistent anomalies on one venue may point to order book features, regional liquidity constraints, or a technical delay in the data.
For a technically advanced trader, it is important to understand which indicator parameters are critical.
Averaging length affects sensitivity: short periods make it possible to catch short-term spread spikes, but produce a lot of "noise"; long ones smooth things out and show persistent deviations.
Percentile breakdown of the historical histogram makes it possible to quickly classify a spread as "typical" or "unusual," but calculation over the full history may require platform resources and become distorted due to changes in market makers or shifts in volumes over the long term.
Adaptive smoothing (Auto MA) helps preserve responsiveness when volatility changes, but adds complexity in backtesting: historical results may depend on the initial conditions and the window length.
In practical work, it is necessary to adjust the length and compare the indicator's behavior over identical segments of history; this gives a better idea of signal stability.
Arbitrage Matrix Indicator: an excellent addition to Arbitrage Detector
The Arbitrage Matrix indicator by LuxAlgo is a logical continuation of the idea embedded in Arbitrage Detector.
This tool does not simply show the difference in price and volume for one pair and across several venues, but also builds a matrix of pairwise comparisons, presenting a complete picture of how each exchange or broker trades one asset relative to the others.
The matrix is displayed as a dashboard where, at the intersection of rows and columns, you can see how much the average or current price (as well as volume) on one venue is higher or lower than on another over the selected period. This makes it possible to quickly see not only individual anomalies, but also systematic relationships between venues.
Technically, the tool is oriented toward practical scanning: it automatically selects a set of sources depending on the asset type (crypto or forex), supports the display of four data types (last price, last volume, average price, and average volume), and provides the ability to fine-tune the average length and enable or disable individual venues.
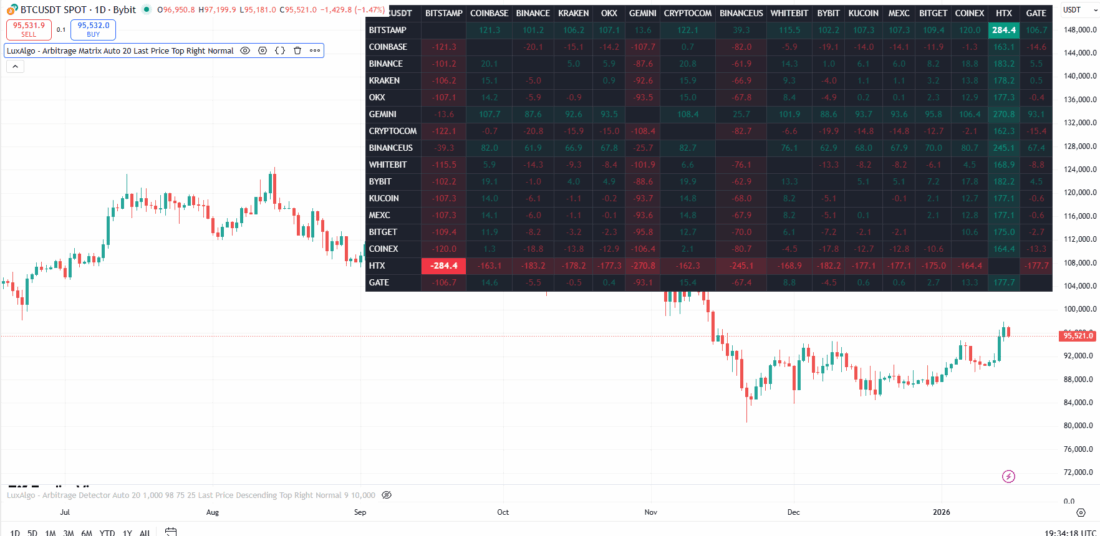
Visually, the matrix can be colored with a gradient for a quick intuitive assessment of the direction and strength of deviations. For the trader, this means that instead of viewing a series of separate charts, they get an instantaneous picture of the relationships between sources.
To explain it at the data level: one cell of the matrix shows how much the average price of the pair on Exchange A is above the average on Exchange B over the last N bars (by default N can be changed). A positive number means the average price on the first exchange is higher, a negative one means it is lower.
For example, exchange A is shown in the row, and exchange B in the column. The data represents the average price, and the value equals 100. The length of the average value is 20 by default. If we talk about the instrument, then the average price over the last 20 days on exchange A is 100 dollars higher than on exchange B. If the value were -100, that would mean that the average price on exchange A is 100 dollars lower than on exchange B.
This tabular presentation makes scenarios obvious when, for example, one exchange is systematically trading at a higher price than others. This may be either an arbitrage opportunity or a sign that the price on that venue is distorted (low liquidity, regional factors, order book problems, and so on).
As for the indicator settings, in terms of visualization they are similar to the previous indicator, and there is an option to manually choose specific crypto exchanges (BYBIT, OKX, and so on).
Combining Indicators for Arbitrage from LuxAlgo

Arbitrage Detector and Arbitrage Matrix complement each other and provide different perspectives on the same task.
Arbitrage Detector shows on the current chart a list of venues, their latest and average prices, volumes, and a historical histogram of spreads divided by percentiles, helping you understand whether the current spread is unusual in a historical context. Arbitrage Matrix, in turn, turns monitoring into a multidimensional scanner that shows pairwise deviations across all selected venues at once.
Together they provide both depth (history and spread distribution) and breadth (comparison of all sources). It makes sense for a beginner arbitrage trader to use this duo systematically: use the matrix as the primary filter and the detector as confirmation and a tool for assessing execution risk.
In practice, these indicators can be combined like this:
Arbitrage Matrix works in a "passive" mode as a scanner: it quickly shows which exchange pairs are currently in strong divergence from each other. If the matrix shows large persistent deviations (for example, one exchange is more expensive than most others, or a chain of exchanges differs systematically), it is necessary to open the same asset in Arbitrage Detector.
Working with Arbitrage Detector lets you see the context: how unusual the current spread on one venue is in historical terms, what volumes stand behind it, and whether there is confirmation in the form of a percentile histogram.
What Other Indicators of Arbitrage Opportunities Exist on TradingView and MT5

Below are practical, publicly available TradingView indicators that solve similar tasks of monitoring spreads, inter-exchange discrepancies, and synthetic spreads:
- ArbitrageDashboard v3 — a panel for monitoring spreads in real time; it allows you to track several pairs at once.
- Uptrick: Arbitrage Opportunity — an indicator focused on the quick visual search for inter-exchange discrepancies in cryptocurrencies.
- Arbitrage Spread — sets of scripts that calculate spread, z-score, and volatility attributes for cryptocurrency pairs and help assess correlation and the spread's readiness for reversal.
- Arbitrage Synthetic Spread Chart v2 — a tool for building a synthetic spread chart of two assets for in-depth divergence analysis.
Each of these scripts has its own logic and set of parameters: some focus on a panel and many sources, others build statistical spreads and z-score, and others provide simple alerts when thresholds are exceeded.
As for searching for and analyzing arbitrage opportunities, it is worth studying the article posted on the MQL5 portal, "Statistical Arbitrage Through Mean Reversion in Pair Trading: Beating the Market with Mathematics", which describes in detail the mathematical logic of arbitrage and provides an example of expert advisor code.
Conclusion
Arbitrage Matrix is a powerful scanner that allows a trader to take in the entire market at a glance, while Arbitrage Detector provides a detailed picture of the spread history of the selected instrument and the volumes behind the market inefficiency.
Using them together turns "observation" into a consistent workflow: the matrix points to where to look, and the detector shows how anomalous it is and with what liquidity.
Respectfully,
Ivan Rusin