
Another Support and Resistance Indicator on TradingView: Building R/S Levels in a New Way
Support and resistance levels are price zones where the market often stops, slows down, or reverses. Levels can be drawn manually, but modern traders choose automation, for which they use one support and resistance level indicator or another.
As a reminder: support is a level where demand is usually stronger than supply and the price stops falling, while resistance is a level where supply is stronger than demand and the price stops rising. A level is considered stronger if the price has reacted to it aggressively several times (high volume and high volatility). Everything is simple and clear.
Traders build support and resistance levels in several ways:
- By extremes — local lows are marked for support and highs for resistance.
- By horizontal levels — lines are drawn where the price reacted several times.
- By trend lines — sloping levels are built from a series of lows or highs.
- By volume — zones where the greatest horizontal volume passed are sought.
- By candle clusters and consolidation zones — sideways areas where the price lingered for a long time are highlighted.
- By indicator methods — for example, Fibonacci levels, pivot points, etc.
Below I will talk about the new BIN Based Support and Resistance support and resistance indicator, which was included in TradingView's Editors' Pick selection in April 2025.
This material is for informational purposes, cannot and should not be construed as consultation or advice.
BINS Support and Resistance Indicator
The BIN Based Support and Resistance indicator can only be found on TradingView. Its author is Steversteves, who has 18.3 thousand followers. At the time of writing (early April 2026), Steversteves had published 107 scripts. His scripts have repeatedly been included in Editors' Pick, which speaks to the author's professionalism.
In trading, the concept of BINS is effectively absent, but behind the indicator “BIN Based Support and Resistance ” on TradingView lies a fairly interesting concept representing an alternative way of defining support and resistance levels.
A “bin” is a range into which data is grouped. The binning method in the context of defining support and resistance works as follows:
- Data is grouped into ranges, or “bins.” For example, when grouping people by age, there may be such groups as 0–18, 19–35, 36–50, and 51+.
- Each data point falls into the corresponding bin depending on its value.
- Binning simplifies complex data sets by grouping values into categories.
- In the context of support and resistance, the indicator groups price action into 10 separate bins.
- The support and resistance level is determined by averaging the values in the bins, which makes it possible to find an iteration of the “central tendency” or the average repeating value.
The obvious advantages of this approach include the following:
Support and resistance levels dynamically adapt to ranges rather than being rigidly fixed at peaks and troughs. Thus, it becomes possible to analyze all price action in the range from the maximum to the minimum of the period, which makes it possible to identify a pseudo-POC (price consolidation point).
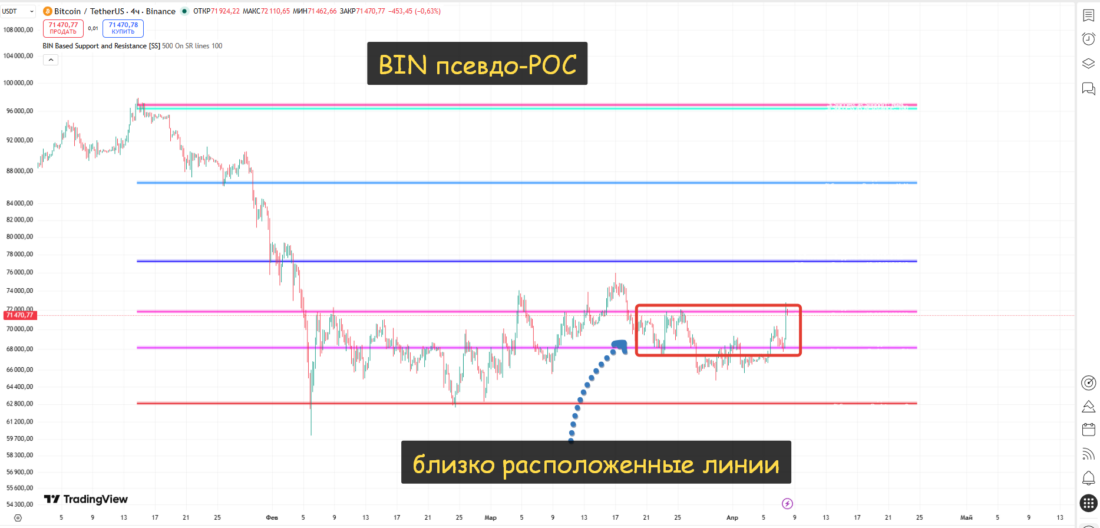
In the image above is the H4 chart of BTC/USDT on Binance. The range in which the pseudo-POC is located is formed where the support and resistance lines are close enough to each other.
Below, on the M30 chart, this concept is presented much better:
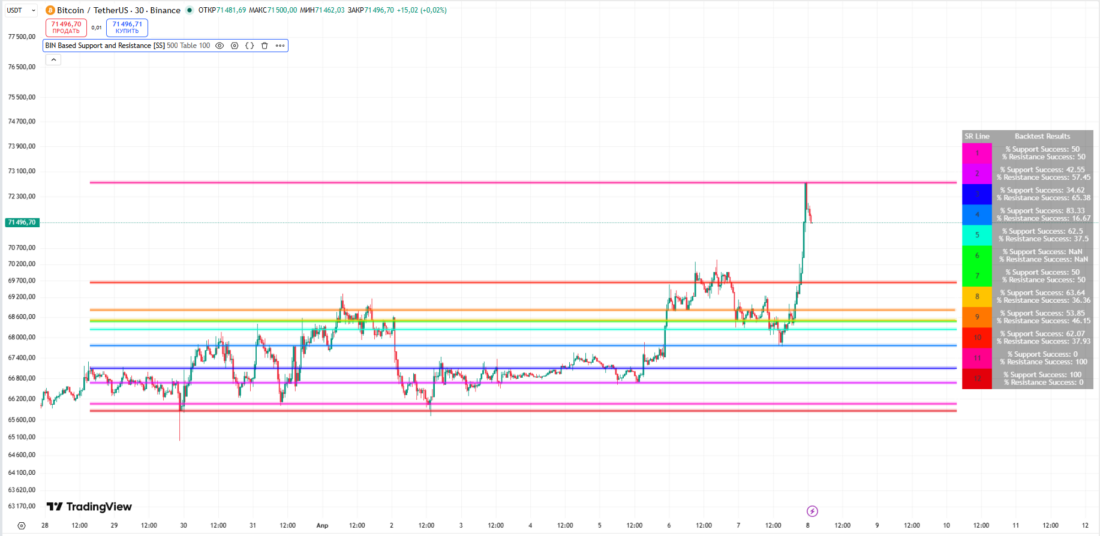
In addition, this indicator makes it possible to backtest support and resistance lines to see how many times certain areas acted as resistance or support.
This function is extremely interesting from the point of view of statistical analysis of support and resistance levels.
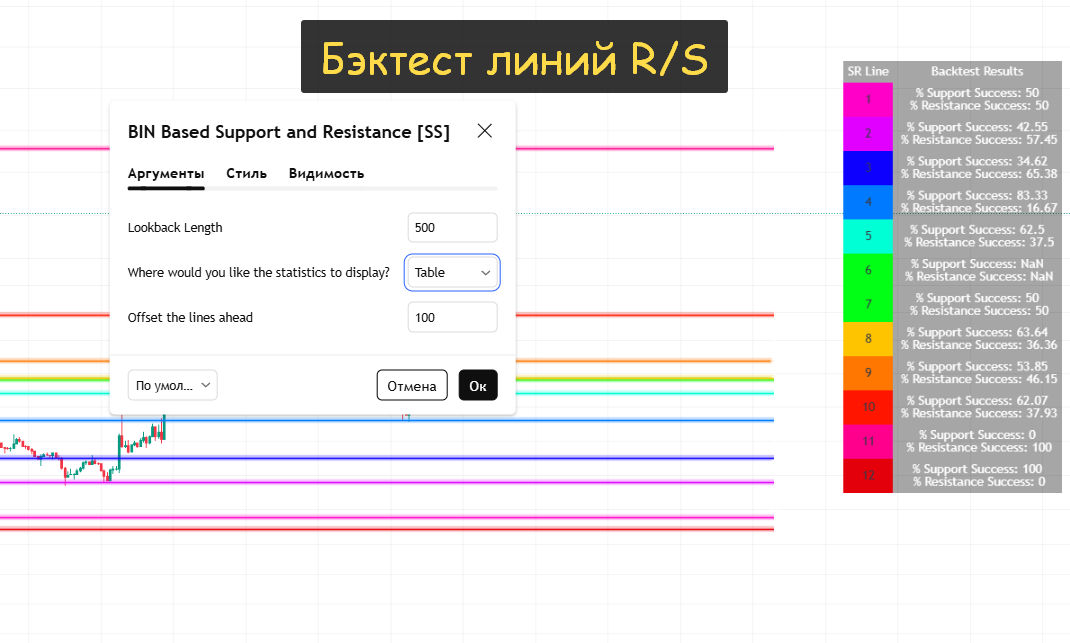
By default, the statistical values are located directly on the R/S lines. My opinion is that it is better to turn on the backtest display in the form of a table, in which it is clearly visible how often a level was support and how often it was resistance. In our example, the red level (number 12) always acted as support, whereas the pink level (number 11) always served as resistance in this segment.
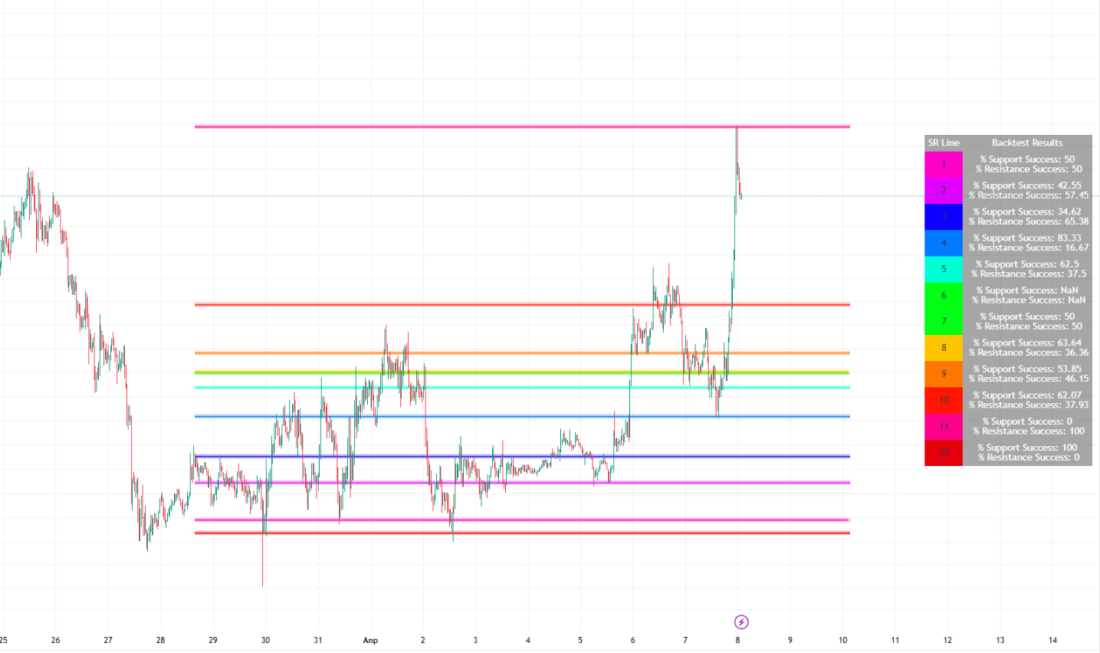
I will say right away that the author of the indicator recommends using retrospective analysis lasting from 250 to 500 candles on lower timeframes. However, this also applies to the higher timeframe.
The disadvantages of the method that the author points out are as follows:
Because of averaging, support and resistance lines can sometimes be broken slightly. However, according to the author, in order to avoid mistakes in positioning or repositioning a level, it is necessary to check how many times the indicator closed above / below the resistance / support line.
As an example, I will show the chart of PJSC Acron shares on MOEX. The stock has little liquidity, which means brief breaches are a standard phenomenon. But even here the indicator makes it possible to build working support and resistance lines.
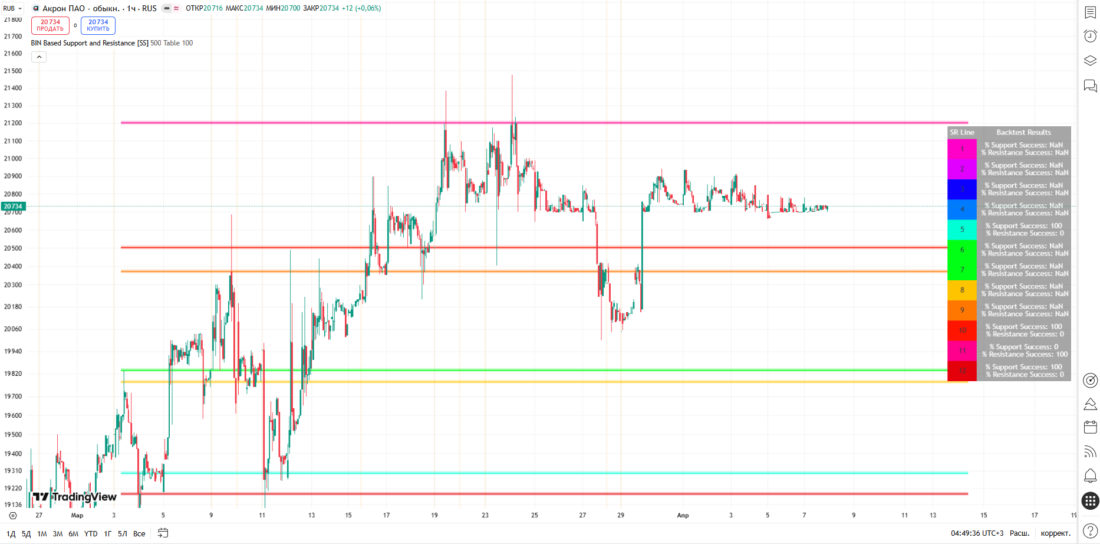
The indicator does not take reversal points into account, which can be both a disadvantage and an advantage, since it allows all price action to be taken into account, not just extremes. And lastly, support and resistance levels may be slightly distorted in conditions of high volatility.
Conclusion
The author of the Bins indicator did not disclose the mathematical principles behind the formation of R/S levels. Judging by some signs, the calculation of support and resistance levels is performed using the k-means clustering method.
It works as follows:
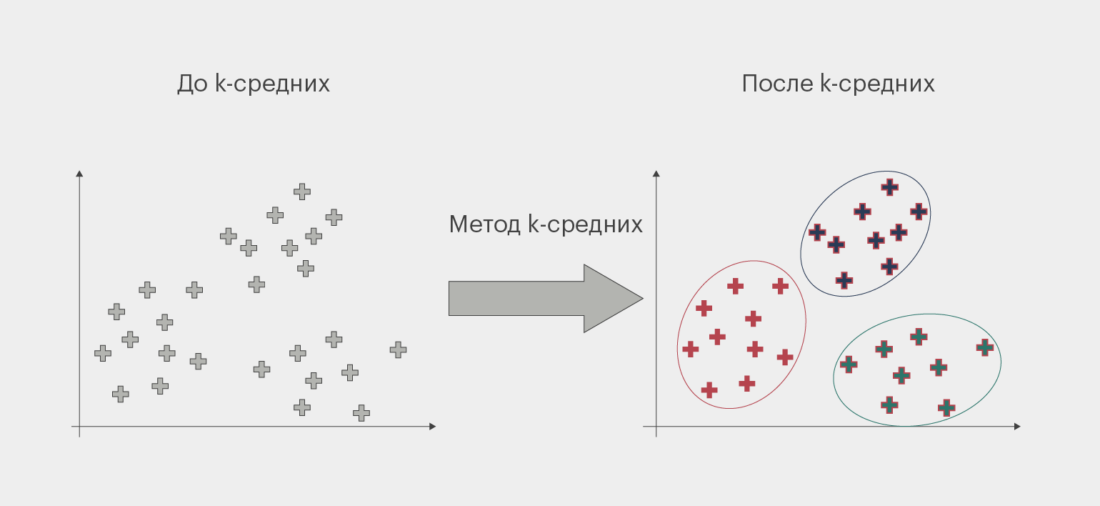
The clustering algorithm divides the data set into K predetermined groups / clusters (bins in the author's terminology). Clustering makes it possible to minimize the dispersion of values within each cluster (bin), while dramatically increasing the distance between clusters. In other words, objects within one group should be as similar to each other as possible, and objects from different groups should be as different as possible.
You can read more about how to create your own support and resistance level indicator using the k-means method in this article.
But most ordinary traders are not interested in statistics; they are more interested in the effectiveness of the indicator.
I liked how this indicator builds support and resistance levels, and let everyone check for themselves and decide whether or not this tool is needed in their arsenal.