
ALMA Indicator: A Fast and Accurate Moving Average for Professional Trading
Moving averages (MA) are one of the oldest and most widely used tools of technical analysis.
However, the classic SMA, EMA, and WMA have well-known drawbacks: lag, excessive sensitivity to noise, or, conversely, smoothing out important market movements. In an attempt to find a balance between smoothness and response speed, French traders Arnaud Legoux and Dimitrios Kouzis-Loukas in 2009 developed the ALMA (Arnaud Legoux Moving Average) indicator.
In the world of technical analysis, where everyone is looking for an edge, the ALMA (Arnaud Legoux Moving Average) indicator stands out for its mathematical elegance and practical efficiency.
That is why ALMA quickly gained popularity among algorithmic and discretionary traders due to its ability to effectively filter market noise while maintaining high sensitivity to trend changes.
This article will provide not only a theoretical description, but also the main trading strategies that can be applied across various timeframes and instruments.
Simple words about the not-so-simple ALMA indicator
The ALMA indicator is a type of moving average that uses a normal bell-shaped (Gaussian) distribution of weights to smooth price data. Unlike the simple moving average (SMA), where all prices have equal weight, or the exponential moving average (EMA), where the weight decreases exponentially, ALMA applies a more complex weighting scheme.
A few words about the calculation
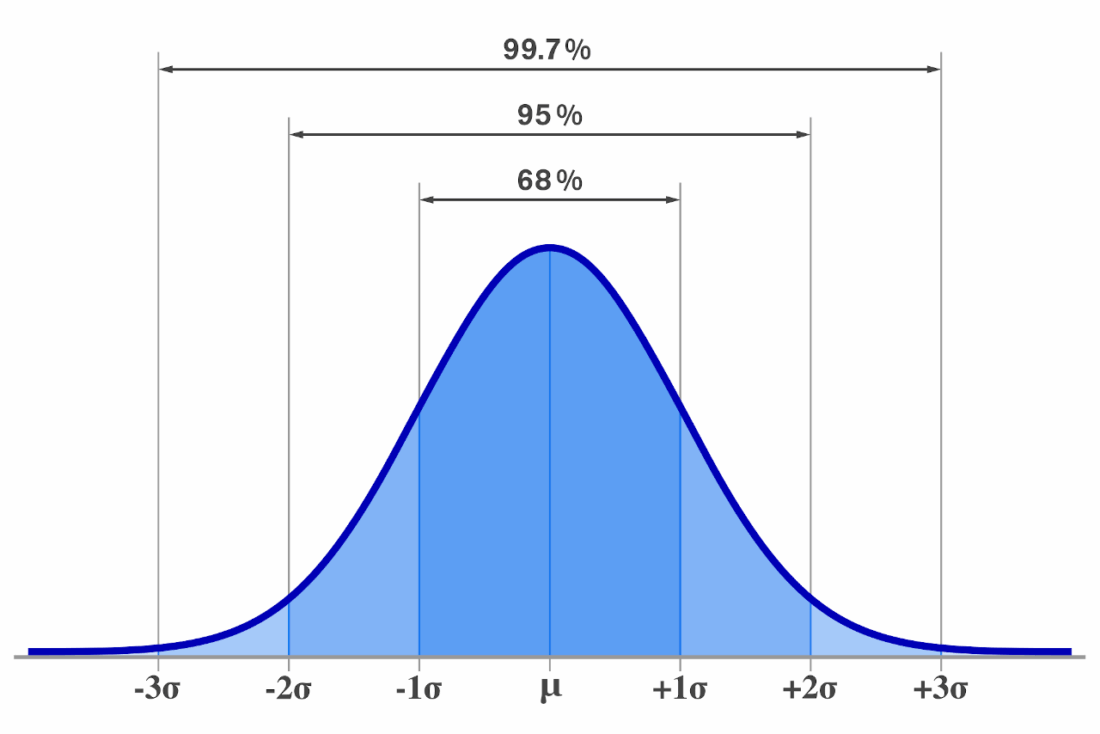
The ALMA formula is a weighted sum of prices within the calculation window, where the weight is computed according to the Gaussian law.
ALMA(n, \sigma, offset) = [ \frac{\sum_{i=0}^{n-1} w_i \cdot Price_{(n-i)}}{\sum_{i=0}^{n-1} w_i} ],
where:
n - window size.
\sigma - standard deviation.
Price - the price at each of the n points.
w_i represents the weight of the i-th element.
The weight of the i-th element (w_i) is calculated as:
w_i = exp(\frac{-1}{2 \cdot \sigma^2} \cdot (d_i – \frac{offset \cdot (n – 1)}{2})^2), where:
d_i - is the distance of the i-th element from the moving average.
The closer to the end of the window, the greater the weight assigned to the price, but the weight distribution is smoothed by the bell. Such a construction provides a smooth line, but with the possibility of faster reaction due to shifting the center (offset) and narrowing the width (sigma). This makes it possible to reduce noise on the chart while maintaining a prompt response to a trend reversal.
Calculation method
The ALMA indicator is calculated as follows:
- Determining the parameters: the user specifies the number of periods (n), the standard deviation (\sigma), and the offset.
- Calculating distances: computing d_i for each element in the dataset, where i ranges from 0 to n-1.
- Calculating the weight: using the Gaussian distribution formula for each d_i to compute the weight w_i.
- Calculating the weighted price: multiplying the weight w_i by the corresponding price Price_{(n-i)} for each data point.
- Weight normalization: summing all calculated weights to find the normalization factor.
- Calculating the ALMA indicator: summing all weighted prices obtained in step 4 and dividing by the normalization factor obtained in step 5 to find the ALMA value for the period.
The calculation method is iterative: the ALMA value is updated as new price data arrives. This process requires careful programming in trading software to obtain accurate real-time calculations, especially in rapidly changing markets.
Indicator parameters and their influence on the ALMA curve
The ALMA indicator, which can be found for MetaTrader and on TradingView, has three main parameters:
- Length (window length, N) is the number of bars over which averaging takes place. Large N gives strong smoothing and lower sensitivity, meaning a slower response to price changes; small N gives a more noisy but faster line.Offset (center shift, usually from 0 to 1) determines the position of the peak of the Gaussian curve inside the window. The value 0.85 is the recommended default: it shifts the weight closer to the latest bars, reducing lag compared to a symmetric curve. Lower values make ALMA more symmetric and smoother.
- Sigma (σ, distribution width) is the standard deviation for the Gaussian weight. It determines the width of the bell: the smaller the sigma, the narrower the bell and the greater the influence of nearby bars; the larger it is, the closer ALMA is to a flat average, and the smoother the line.
The most common recommendations for configuring ALMA
The selection of optimal parameters depends on the market and the time frame. Many traders start with typical settings (for example, Length≈20, σ≈6, Offset≈0.85) and then adjust them through testing. It is recommended to experiment on historical data or a demo account in order to find a balance between signal speed and noise filtering.
In all cases, it is worth considering that more sensitive settings produce more signals, including false ones, while smoother settings produce fewer signals, but more reliable ones.
General recommendations are as follows: length 9–200 (intraday: 9–34, medium-term: 34–89, long-term: 100+), offset usually 0.6–0.95, sigma 2–6 (or 0.5–3 in some cases).
ALMA indicator settings in trading strategies
Short-Term Strategies (Scalping, Intraday)
Minimal lag and clean signals are important here. The ALMA indicator makes it possible to trade on 1-15 minute charts, generating clear signals with minimal delay.
In general, ALMA (9-14) reacts to price movement almost instantly, while its Gaussian filter cuts out isolated noise spikes. This is convenient, for example, when trading cryptocurrencies, where quotes are highly volatile. At the same time, ALMA is more stable than an EMA with the same period, which reduces the number of false signals in scalping.
Traders recommend using ALMA(9) on one-minute candles for scalping in order to catch very short impulses.
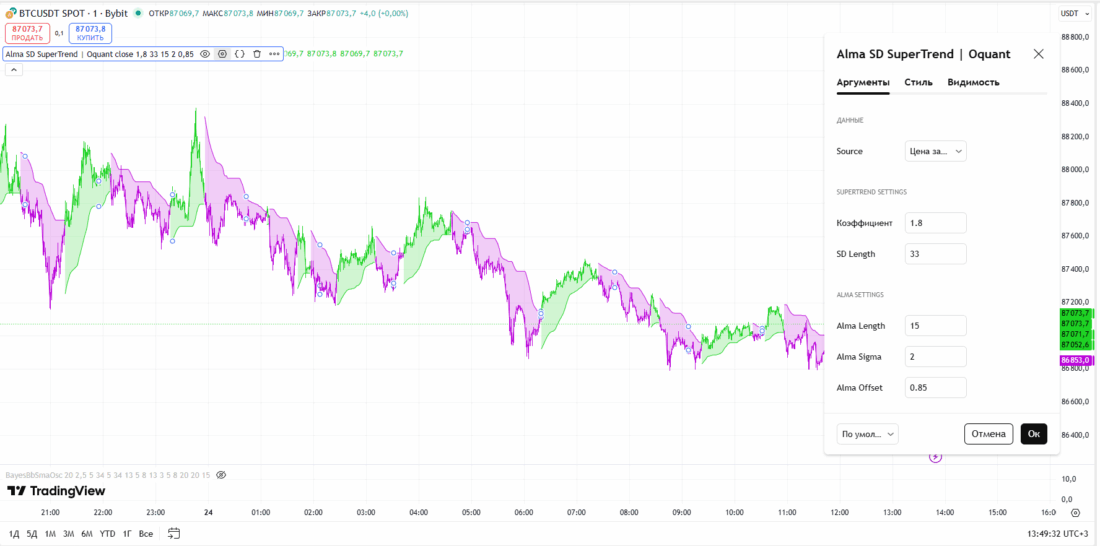
In the image above: the Alma SD SuperTrend | Oquant indicator, BTC 1-minute chart, ALMA settings: length - 15; sigma - 2; offset - 0.85.
Thus, short periods are usually chosen (length ~ 9-20), and the sigma offset is moved closer to 1 so that the line reacts quickly. This makes it possible to catch fast price impulses provided there is sufficient filtering through sigma and additional indicators.
If high volatility is observed in the market, for example in cryptocurrencies or during news events, then because of sharp moves you can reduce sigma or shift the center of the window forward so that ALMA reacts faster to strong price fluctuations.
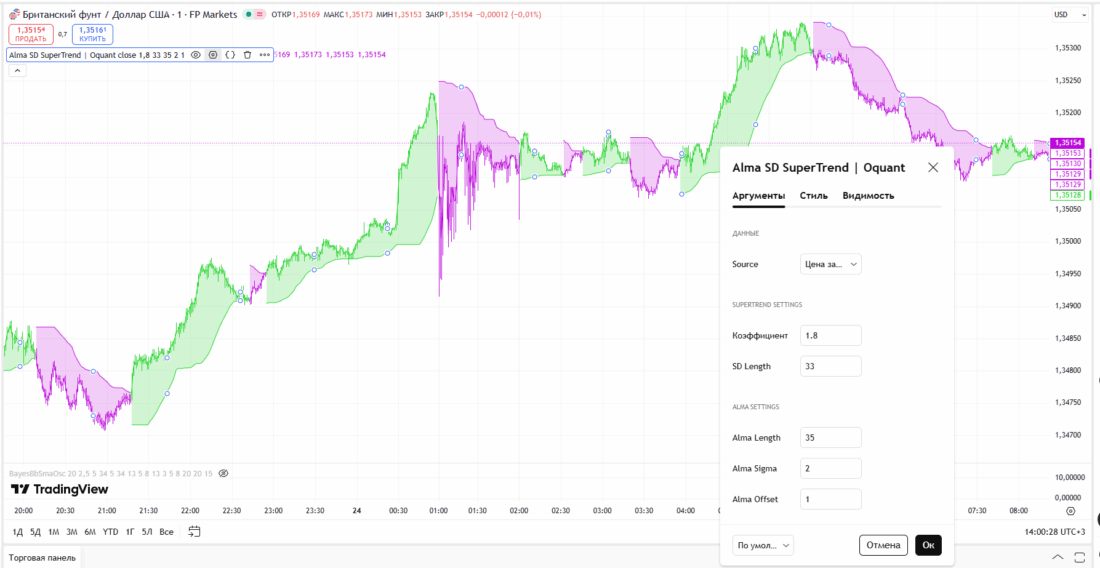
In the image above: the Alma SD SuperTrend | Oquant indicator, GBP/USD 1-hour chart, ALMA settings: length - 35; sigma - 35; offset - 1.
Medium-Term and Swing Strategies
For medium-term entries, longer ALMA indicator periods are used, for example 20-50, on the hourly or daily timeframe. At the same time, the offset is often set to a moderate value, around 0.8-0.9, and sigma is increased for better smoothing in order to avoid false rebounds in low-volatility conditions.
Thus, ALMA provides a smooth trend curve and helps identify reversals earlier than with SMA.
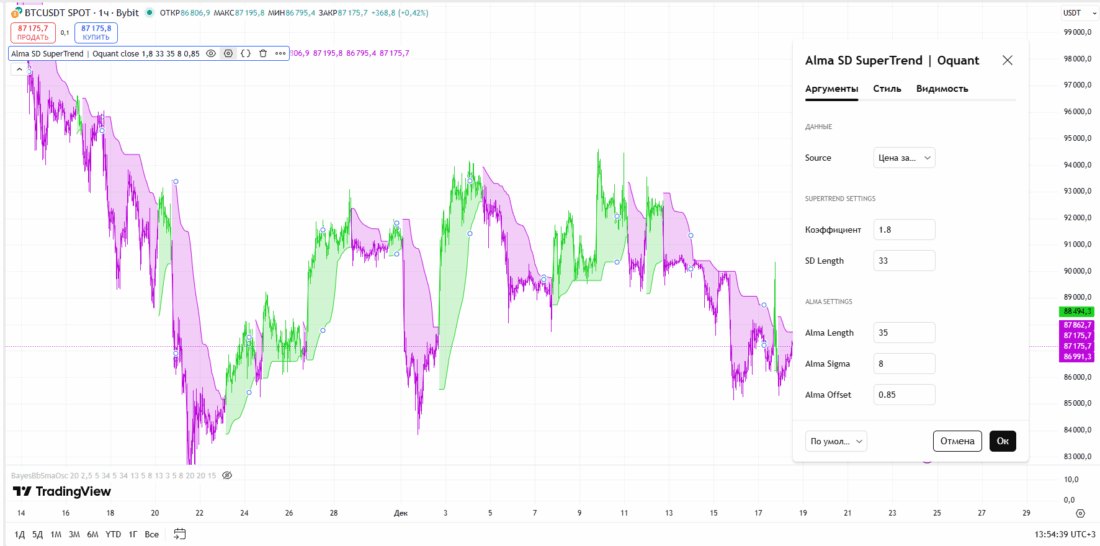
In the image above: the Alma SD SuperTrend | Oquant indicator, BTC 1-hour chart, ALMA settings: length - 35; sigma - 8; offset - 0.85.
In crypto and forex trading, where trends can last for several days or weeks, the ALMA indicator is well suited for confirming an uptrend or downtrend, with price above or below ALMA, and for building dynamic support and resistance. Popular recommendations say: "If the price is above ALMA and the ALMA line is rising, the market is in a strong trend."
It is also possible to use ALMA as moving support or resistance depending on the direction. At the same time, it is worth remembering that in a fading trend, ALMA begins to flatten gradually and signals weakening momentum.
Trading Signals of the ALMA Indicator
Trend Signals
ALMA performs the role of a trend filter well. If the price is above the ALMA line and the curve itself is directed upward, this confirms a bullish trend, so we look for buy signals. For example, when the price holds above ALMA(50), the advantage is on the side of the bulls.
In the opposite case, when the price is below ALMA and the slope is downward, traders trade to the downside. Thus, ALMA suggests the direction in which one should trade with the trend: price above ALMA means long positions only, price below means short positions only.
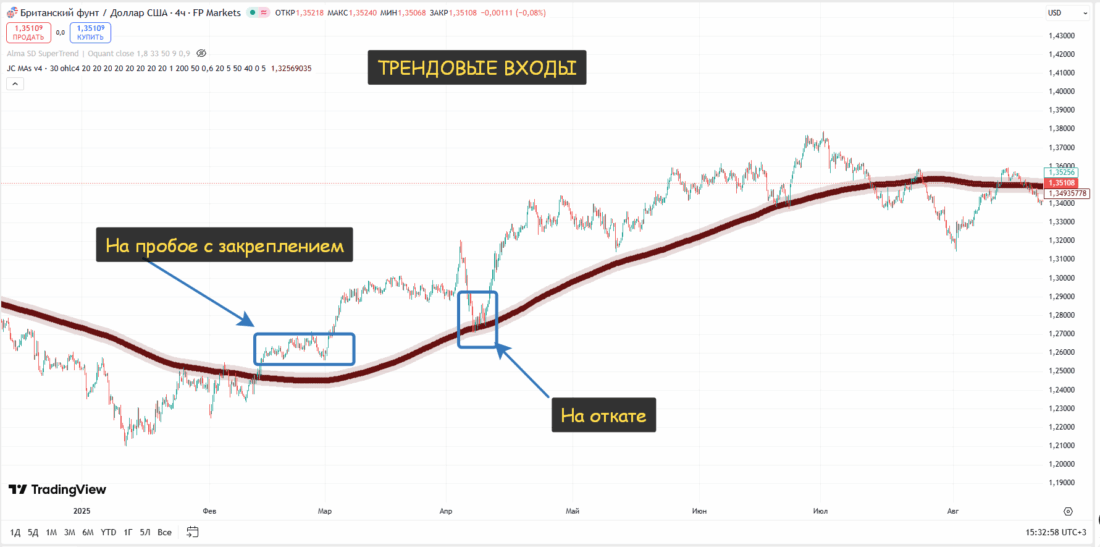
Pullbacks to ALMA as an Entry Point
In an established trend, price approaching the ALMA line often serves as a good entry point. In an uptrend, price may bounce upward from ALMA. This is a signal to buy on the pullback.
Likewise, in a downtrend, an upward correction comes right up to ALMA as resistance, and here it is worth considering opening short positions. The key principle is to trade the bounce or breakout of the ALMA line, confirming the signal with candlestick patterns or rising and falling volume.
ALMA Crossovers with Other Moving Averages
Combinations of ALMA with other MAs are often used.
The simplest strategy is a crossover of two ALMAs of different lengths. For example, a fast ALMA(9) crosses above a slow ALMA(21) — a buy signal. A reverse crossover — a sell signal.
Similarly, you can combine ALMA with EMA.
One approach is to use ALMA as a trend filter (for example, ALMA(100)), and two short EMAs (say, with periods 10 and 15) to generate signals. In this case, you can enter on the EMA crossover if the price is above (or below) the ALMA line.
For example, if ALMA is below price (an uptrend) and the 10-day EMA crosses the 15-day EMA from below upward, this is a confirmed bullish signal.
Combinations with RSI and MACD
To increase the reliability of ALMA signals, RSI and MACD indicators are often used.
When RSI is above the 50 level (strong momentum) and the price holds above a rising ALMA, this strengthens the bullish signal. Conversely, RSI below 50 together with price under a falling ALMA confirms a downtrend.
A bullish MACD crossover with a rising ALMA serves as additional confirmation of bullish momentum; similarly, a bearish MACD crossover under a falling ALMA is a signal of decline. This approach helps filter out weak signals and enter the market only after the trend is confirmed by several indicators.
Examples of ALMA Indicator Implementations
Indicators for MT4 / MT5
Unfortunately, there are very few ALMA implementations for MT4 / MT5 terminals.
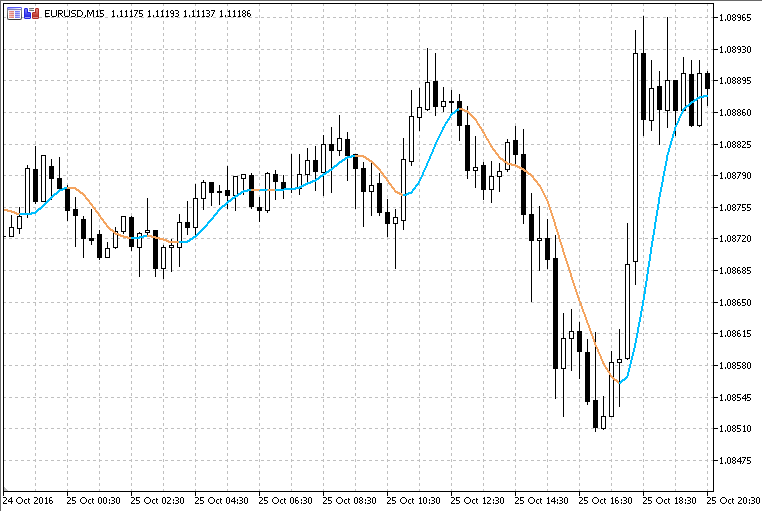
On the MQL5 market, the most interesting one is ALMA 2.0. It is better used together with other indicators, as stated in the previous section.
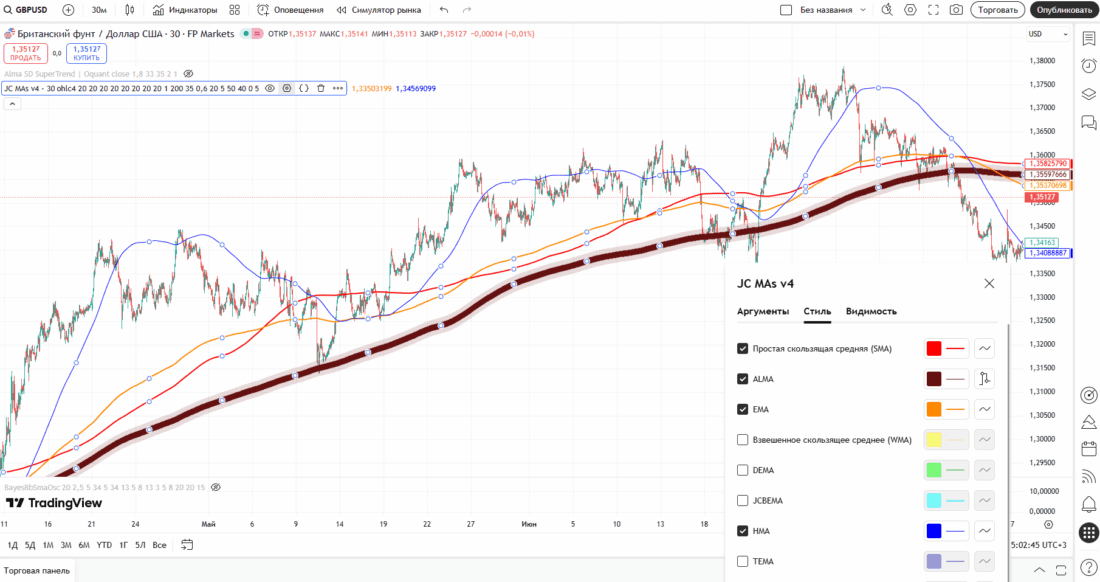
It is also worth paying attention to the fairly popular development called Moving Averages-14 different types: for MT4 it was published on March 12, 2024, for MT5 on December 22, 2025. Here you can combine 14 different types of moving averages to get the best result.
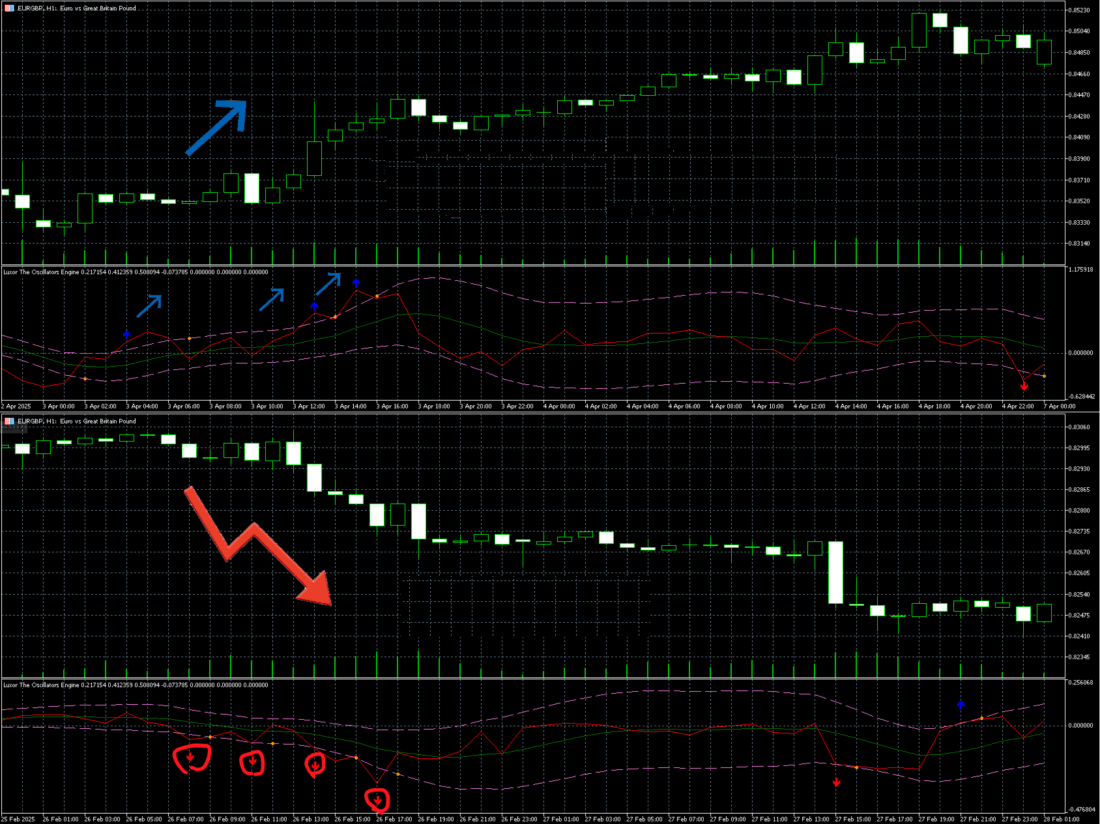
If we talk about indicators that use ALMA, the fairly popular Luxor The Oscillators Engine looks interesting, representing a combination of ALMA and PCH (Percentage Change), complemented by dynamic RMS bands. It is very new: published on May 15, 2025. Available only for MT5.
Indicators on TradingView
On TradingView, you can find many more scripts based on the ALMA indicator compared with MQL5.
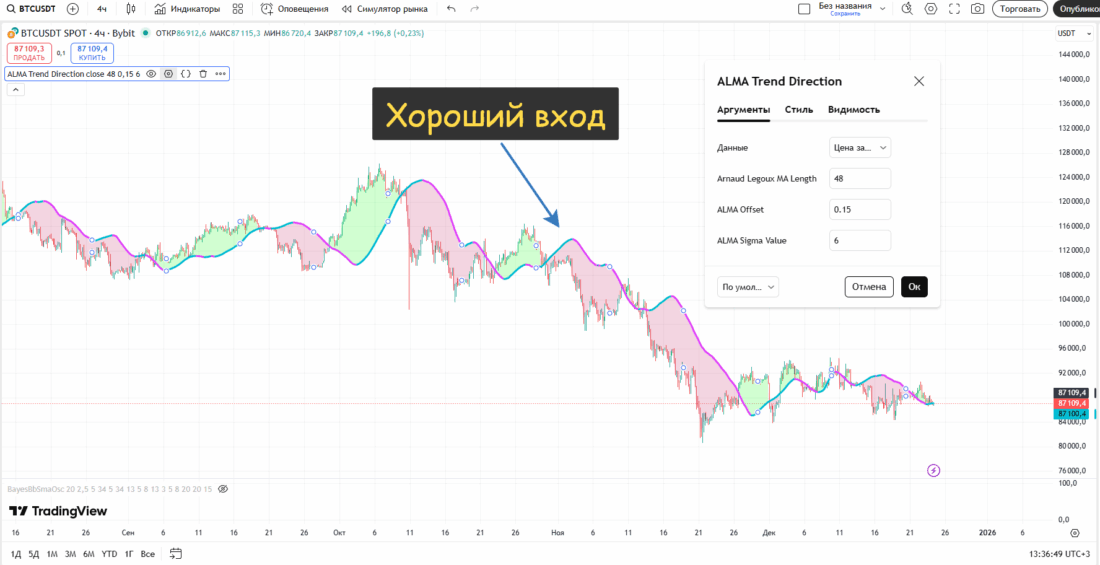
The basic indicator is called ALMA Trend Direction. The indicator's default settings work well on the 4-hour bitcoin chart.
Speaking of custom scripts, a good indicator is Alma SD SuperTrend | Oquant. It follows the trend by combining the ALMA moving average and a supertrend calculation based on standard deviation (SD).
In our opinion, it gives a slightly clearer signal with the basic settings on the 4-H bitcoin chart.
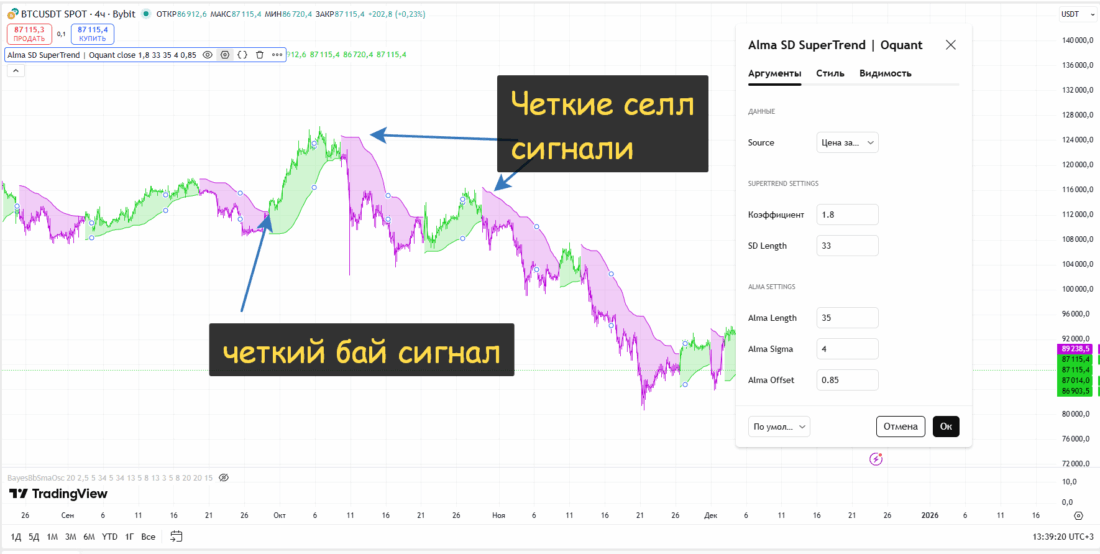
We recommend familiarizing yourself with the full list of user indicators on TradingView based on ALMA.
Advantages of ALMA over SMA and EMA
Comparison of different types of MA with ALMA
SMA (simple MA) gives the smoothest line (maximum smoothing), but has the greatest lag: it reacts slowly to sharp movements and often trails behind the current trend.
EMA / WMA (exponential MA / weighted MA) react faster because newer prices receive greater weight. Their lag is lower than that of SMA: they react quickly to recent movements. At the same time, EMA and WMA lines are more jagged: they follow the latest price fluctuations and can generate many false signals.
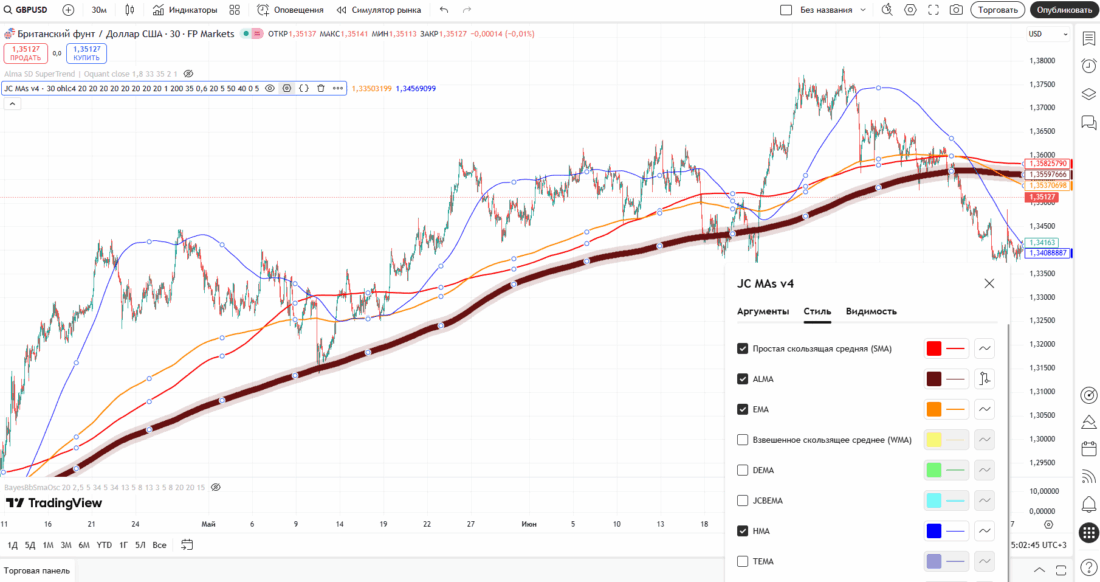
HMA (Hull MA) is designed to minimize lag: due to a double MA over half the period, it reacts very quickly, with almost no delay. At the same time, HMA remains quite smooth (thanks to the final smoothing), but studies indicate that in a flat market HMA can give erroneous signals (jump across prices). In other words, HMA is the most sensitive of the listed averages.
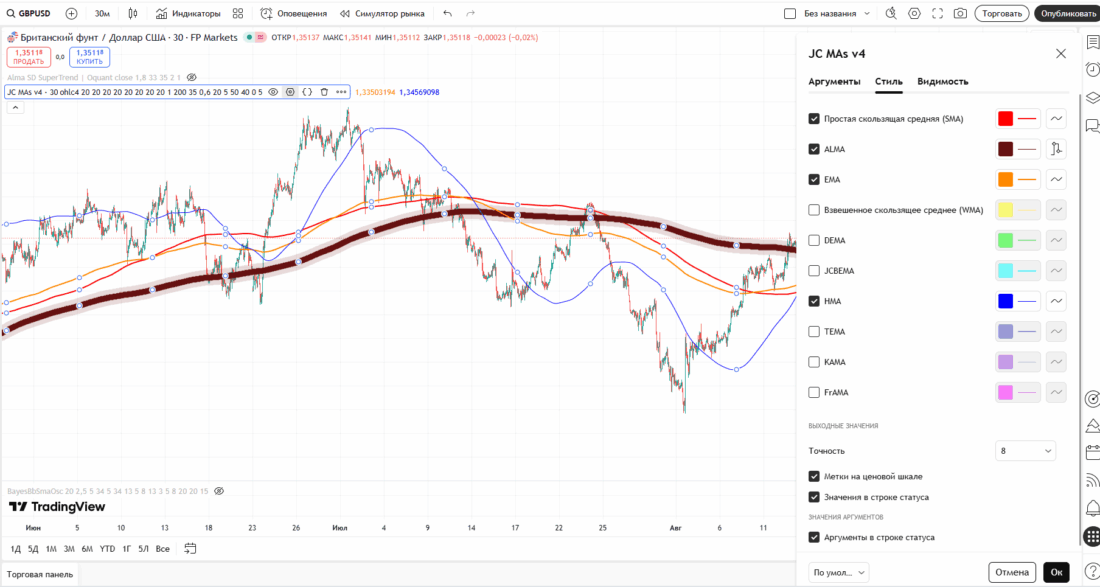
Compare in the picture below the behavior of ALMA and HMA (the purple MA): the latter often gives false reversal signals.
ALMA balances speed and smoothness. As the developers note, ALMA “reduces lag while maintaining a smooth depiction of the trend.” Thanks to the Gaussian distribution of weights, ALMA reacts almost as quickly as EMA/WMA (that is, it has a small lag), but at the same time gives a very smooth curve, smoothing out noise spikes (unlike exponential MA).
In other words, ALMA combines the best properties of SMA and EMA: lower lag than SMA and more reliable noise filtering than HMA.
Briefly about the advantages and disadvantages of ALMA
Compared with simple (SMA) and exponential (EMA) moving averages, ALMA has a number of advantages.
Lag reduction: thanks to bell-shaped weights, ALMA reacts faster to reversals than SMA while at the same time forming a less jagged line than EMA.
Noise filtering: the uniform (Gaussian) distribution of weights across the data makes it possible to better filter out short-term price spikes. Thus, ALMA avoids many of the false signals typical of fast-reacting EMA.
Smoothness with sensitivity: ALMA harmoniously combines the responsiveness of EMA and the smoothness of SMA. Greater weight on the average values within the window provides smoothness, while the offset brings the line closer to current prices.
In essence, ALMA “balances” between the even SMA and the sharp EMA, reducing false whipsaws and at the same time confirming true trends faster.
If we talk about the disadvantages of the indicator, then, first, it is not built into all trading platforms by default and requires loading a custom script. Second, the presence of several parameters (offset, sigma) means that the indicator is easy to over-optimize: it will be difficult for an inexperienced trader to choose the settings.
It should be noted that ALMA is a relatively new tool, and fewer historical tests are available for it than for classic MA.
Comparison of ALMA and other MA in short-term and medium-term trading (cryptocurrencies and forex)
ALMA is especially useful when noise filtering and low lag are critical (a volatile trend). If the main task is to cut out noise at any cost (sacrificing reaction speed), then SMA is better suited; if the fastest possible response is needed (accepting more false signals), then HMA or a short EMA will give the earliest signal, while sacrificing stability.
In forex markets, where volatility is usually lower and news produces sharp but short-lived surges, ALMA captures trend movements well, but sometimes traders prefer a simpler EMA (with a similar period length) instead. For example, for pairs with low volatility, EMA(14) may be suitable instead of ALMA(14).
In cryptocurrencies, ALMA is more preferable: it gives clear signals even during bitcoin/ether “jumps.”
Conclusion
The ALMA indicator can be used on any timeframes and assets (forex, cryptocurrencies, stocks), and the adjustable offset and sigma allow it to be adapted to any trading style.
ALMA combines low lag with high-quality smoothing and has minimal delay, since it is faster than SMA and more stable than EMA. Therefore, this type of MA gives fewer false signals in volatile markets.
Thanks to its Gaussian weighting function, ALMA filters minor market noise better and thereby gives a clearer picture of the trend.
Thus, in short-term trading (scalping, day trading), ALMA is often preferable due to its minimal lag. In medium-term trading (swing trading) in volatile markets (especially cryptocurrencies), ALMA helps identify reversals better while accounting for noise.
However, in calm conditions it is more effective to use classic MAs instead (for example, EMA for a fast signal or SMA for reliability).
Best regards,
Ivan Rusin