
All the Secrets of the Accumulation/Distribution Indicator

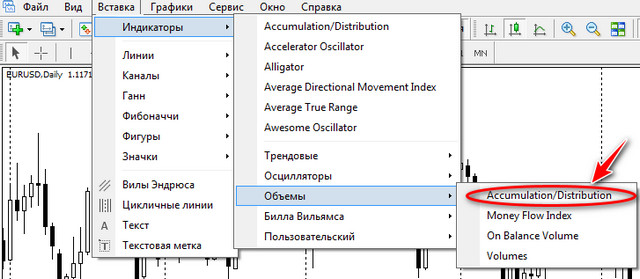
Accumulation/Distribution (A/D) belongs to the standard package of technical analysis tools in Metatrader and other common trading platforms. The name of the indicator translates as "Accumulation/Distribution," reflecting the meaning of its value and operation.
Today we will get to know this tool in detail and see how it works in Forex. This indicator may be especially interesting to supporters of the VSA method, since it is precisely the one that takes trading volumes into account in its analysis.
The author of the tool, world-famous stock market theorist and practitioner of technical analysis Marc Chaikin, managed to describe the stages using volumes and price behavior:

The currency market looks somewhat different: the A/D curve interprets the accumulation or growth stage as an increase in bull strength, while distribution or decline is perceived as rising pressure from bear positions.
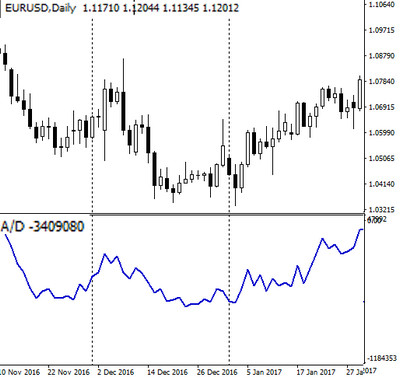
Accumulation/Distribution is considered the most accurate predictive indicator in the package of four standard tools in the "Volume" section. The A/D formula fully includes all the readings of the On Balance Volume indicator and Larry Williams' distribution index.
Indicator Characteristics
Platform: Any
Currency pairs: all instruments
Timeframe: D1 - recommended by the author
Trading time: around the clock
Recommended brokers: Alpari, RoboForex, AMarkets
Description of How the Indicator Works

Accumulation/Distribution is considered a technical tool for confirming or refuting a trend. A rise or fall in quotes on the chart must necessarily coincide with the direction of the indicator curve. All discrepancies are interpreted in favor of A/D, that is, any divergence is considered a signal of an imminent reversal in the rate of the currency pair.
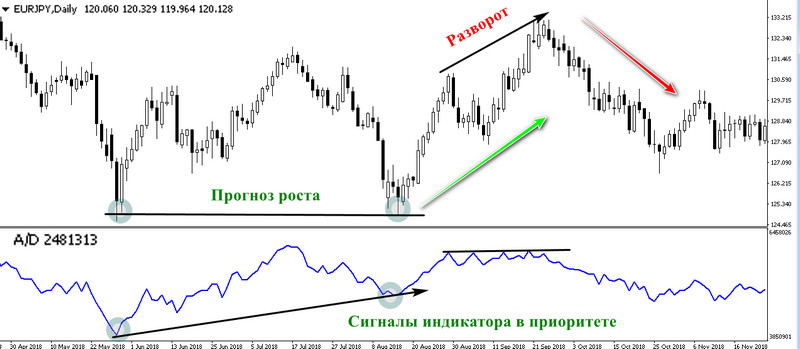
Indicator divergences with price are the most popular signals in technical analysis, but only A/D readings possess high leading predictive accuracy. The indicator formula uses real volume data compared with changes in the price range, thanks to which Chaikin achieved the best algorithmic reflection on the chart of the principles of VSA theory.
Chaikin's A/D Formula

When deriving the indicator formula, Marc Chaikin used the mathematics of On Balance Volume (OBV) as a basis, whose creator Joe Granville kept a cumulative record of trading volumes for the period, adding or subtracting from it the volume of each candle depending on its positive or negative close.
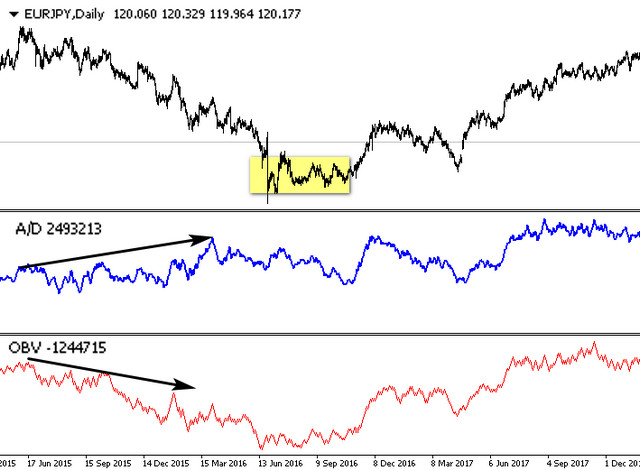
Trading volume is an abstract quantity with no connection to the result achieved by the end of the trading session. The figure below shows the differences between OBV and Chaikin A/D signals, and it is clear that Joe Granville's indicator (the lowest one) shows a decline, whereas the Accumulation/Distribution curve indicates the process of position accumulation by market makers.
The reason for the accuracy of the readings lies in Chaikin's formula, which calculates trading volume separately for each timeframe with a "weighting coefficient" of the reduced trading range, borrowed by Larry Williams from the book "Long-Term Secrets...," where the accumulation and distribution index was derived, equal to:

Marc Chaikin changed the weighting coefficient to a fraction that takes into account in the numerator the separate contribution of bulls (high - close) and bears (close - low):

The resulting CLV value was summed according to the principle of cumulative volume from Joe Granville's formula, which explains the partial coincidence of OBV and A/D in many areas of the chart.
Using the Indicator in Trading

The most common strategy for using Accumulation/Distribution is considered to be the oscillator method proposed by the author himself, Marc Chaikin. It consists of searching for the difference between two exponential moving averages with periods of 3 days and 10 days, taken from A/D values.
Chaikin Oscillator (CHO) is not included in the standard package of Metatrader indicators; the download link is placed at the end of the article. Calculation formula: CHO = EMA(3) - EMA(10).
Thanks to the properties of A/D to generate leading signals of a change in trend, the CHO indicator has the important feature of producing signals synchronized with the current change in quotes, despite the use of exponential averages, which traditionally lag because of averaging the calculation result.
The strategy of trading oscillator signals consists of opening positions:
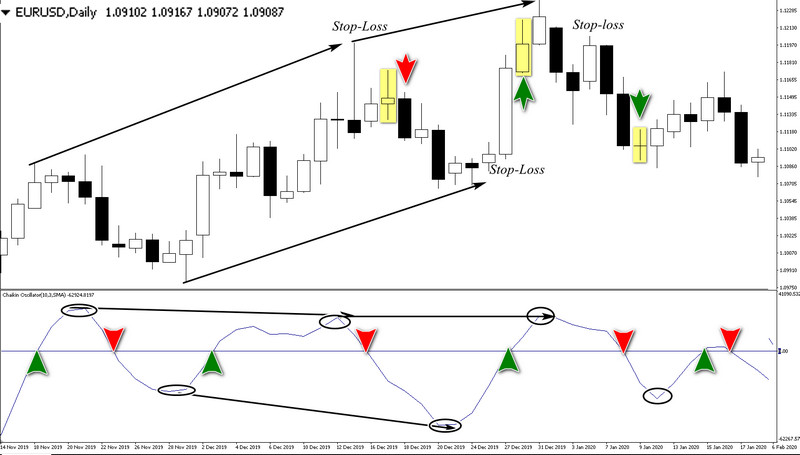
Marc Chaikin suggested using divergence signals, discrepancies between the readings of peaks and troughs in the trends of the chart and the oscillator, interpreted in favor of CHO, as a filter for trades.
The figure above shows how an upward trend is not confirmed by the next peak of the curve, which means that when the zero line is crossed from top to bottom, we open a Short position. A similar situation occurs with a downward trend: if it is not confirmed by new CHO lows, then we open a Long after the indicator crosses the zero line.
Positions are closed by reversal on the opposite signal; "insurance" of an open order is possible with a stop loss moved to the break-even zone. When a trade is first opened, it is located at the nearest maximum or minimum, usually coinciding with a CHO peak or trough.
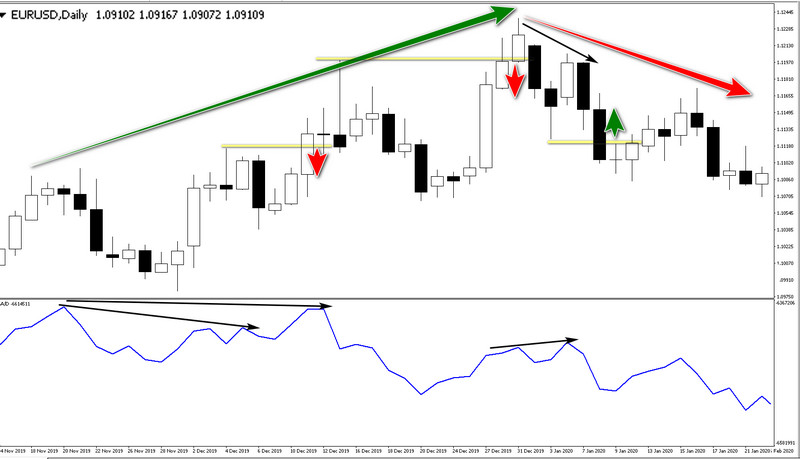
Some traders who trade exclusively countertrend divergence signals choose Accumulation/Distribution specifically. As soon as a discrepancy is identified on the chart, a pending order is placed:
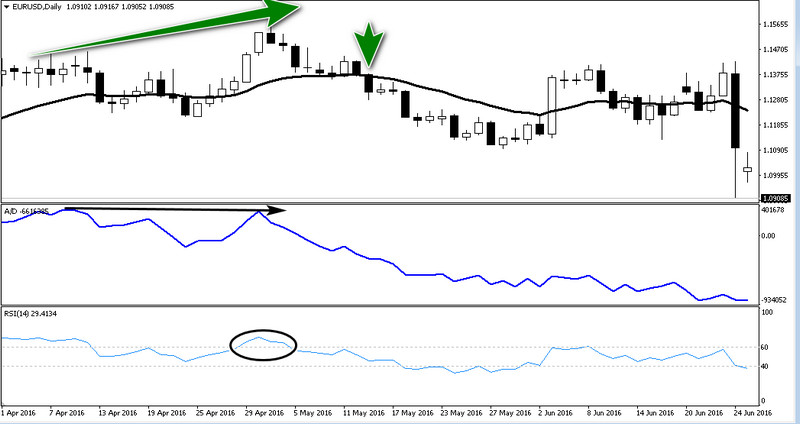
In all other cases, the Accumulation/Distribution indicator is used as part of trading systems as an overbought/oversold filter for oscillators. The picture below shows a simple MA + RSI strategy, where one of the conditions for a sell signal is A/D divergence in the overbought zone. Having thus confirmed a trend reversal, the trader waits for the quotes to cross the moving average and opens a market Sell order.
Indicator Settings

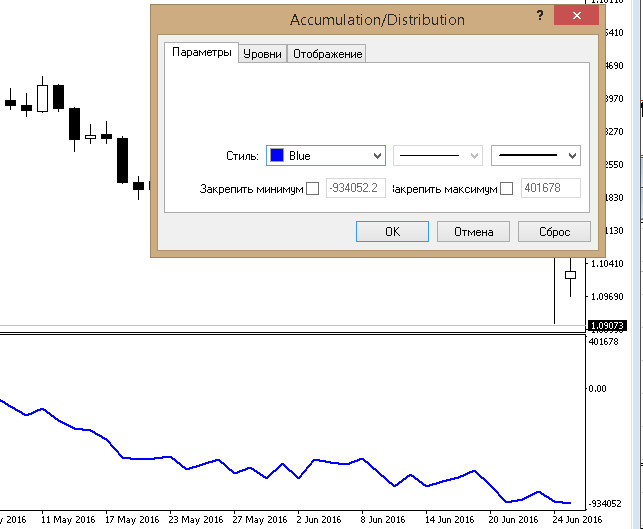
The settings window of the Accumulation/Distribution indicator is unique in that it contains no parameters other than auxiliary ones: color, line thickness, and user levels. The reason lies in the formula: it automatically calculates the volume of each candle and computes (subtracts or adds) the total reading across the entire available chart history.
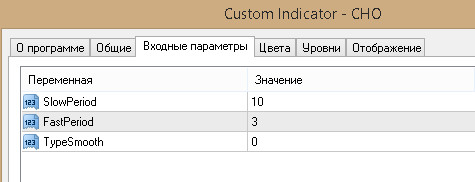
The Chaikin oscillator readings contain only EMA periods and the possibility of smoothing the curve to remove noise and more clearly emphasize the market's cycles.
Conclusion

Accumulation/Distribution is an example of ideal synchronization between trading volume readings and the dynamics of market quotes. The indicator is simple to interpret and use and will not cause difficulties in application even for a beginner, since it has no settings that would need to be adjusted.
Like any other technical analysis tool, A/D readings are best used as part of trading systems or together with Marc Chaikin's other developments. They are published on the Chaikin Analytics website, which has repeatedly been recognized as the best portal for quantitative analysis of financial markets.
Respectfully, Alexey Vergunov
Tlap.io
