
All the Secrets of Managing Positions in Forex
 Hello everyone!
The correct identification of entry and exit points, as well as the levels for setting stop loss and take profit, can become a real headache for a beginner trader in Forex. Today we will try to figure out what options there are for entering and exiting a position, and we will also discuss ways to modify orders and manage open positions.
Entering the Market

Any trading strategy begins with an idea of how to enter the market. This is, as a rule, the starting point in the development of a trading strategy of any complexity.
Usually, an entry according to a trading strategy is associated for a trader with a specific set of rules: if this and that happened, then one can enter a buy trade. The rules themselves do not arise out of thin air, and usually the algorithm here is as follows:
- a trader reads various literature, visits online forums and blogs, and communicates with colleagues. At some point, various ideas inevitably come to them in the form of, "what if I try trading an ascending triangle according to the rules I read today?";
- this is followed by testing on historical data to identify the optimal set of rules for entering, exiting, and managing positions. This is usually done with the help of special programs for manual testing, such as Forex Tester, or add-ons for the MT4 terminal that allow manual testing;
- after testing the idea, the trader then decides whether it is worth using the developed strategy in their trading.
The market entry strategy can be very different: a regular entry on a pullback, on a breakout of a certain price level, on news, by a pattern of Price Action, and so on. Depending on the strategy, appropriate types of orders are selected. For breakout strategies, these are pending orders Buy Stop and Sell Stop or market orders, while for pullback strategies Buy Limit and Sell Limit are sometimes used, and so on.
I cannot fail to mention that beginner algo traders often use pending orders in their advisors without caring about the consequences. For high-quality testing of advisors that use pending orders, high-quality tick history is required. Otherwise, those orders that would not have been activated on a real account would be activated in the test, and vice versa.
Let us take a closer look at the three main ways of entering trades: by the trend, on a breakout, and in a flat market.
Trading with the Trend
Trading with the trend is often presented as the simplest thing. We all know the old immutable truth: "Trend is your friend". But entering a position at the very beginning of a newly emerging trend usually looks problematic and dangerous for most people. The reason lies in the psychological barrier that arises for most people, who have difficulty changing their views on the existing trend.
When prices begin to rise after a downward move, everyone expects a catastrophic fall, so they gladly sell, and with any decline in an uptrend everyone thinks prices will go higher, and therefore everyone is ready to buy on every correction. That is why most traders enter buys almost at the very top and sell almost at the base of the market. In the middle of the trend, calm often arises among traders, and they almost completely stop caring about preserving the profits accumulated in their trading accounts.
Buying in a rising trend and selling in a falling trend do not coincide with the rhythm of the market for most traders. Please note: we are not considering cases when the entry occurs at the moment the trend is born. Now we are talking about how one should behave inside the trend. And for this situation, the best ways to enter the market are based on the use of trend lines with the use of support or resistance determined with the help of the latest completed moves.
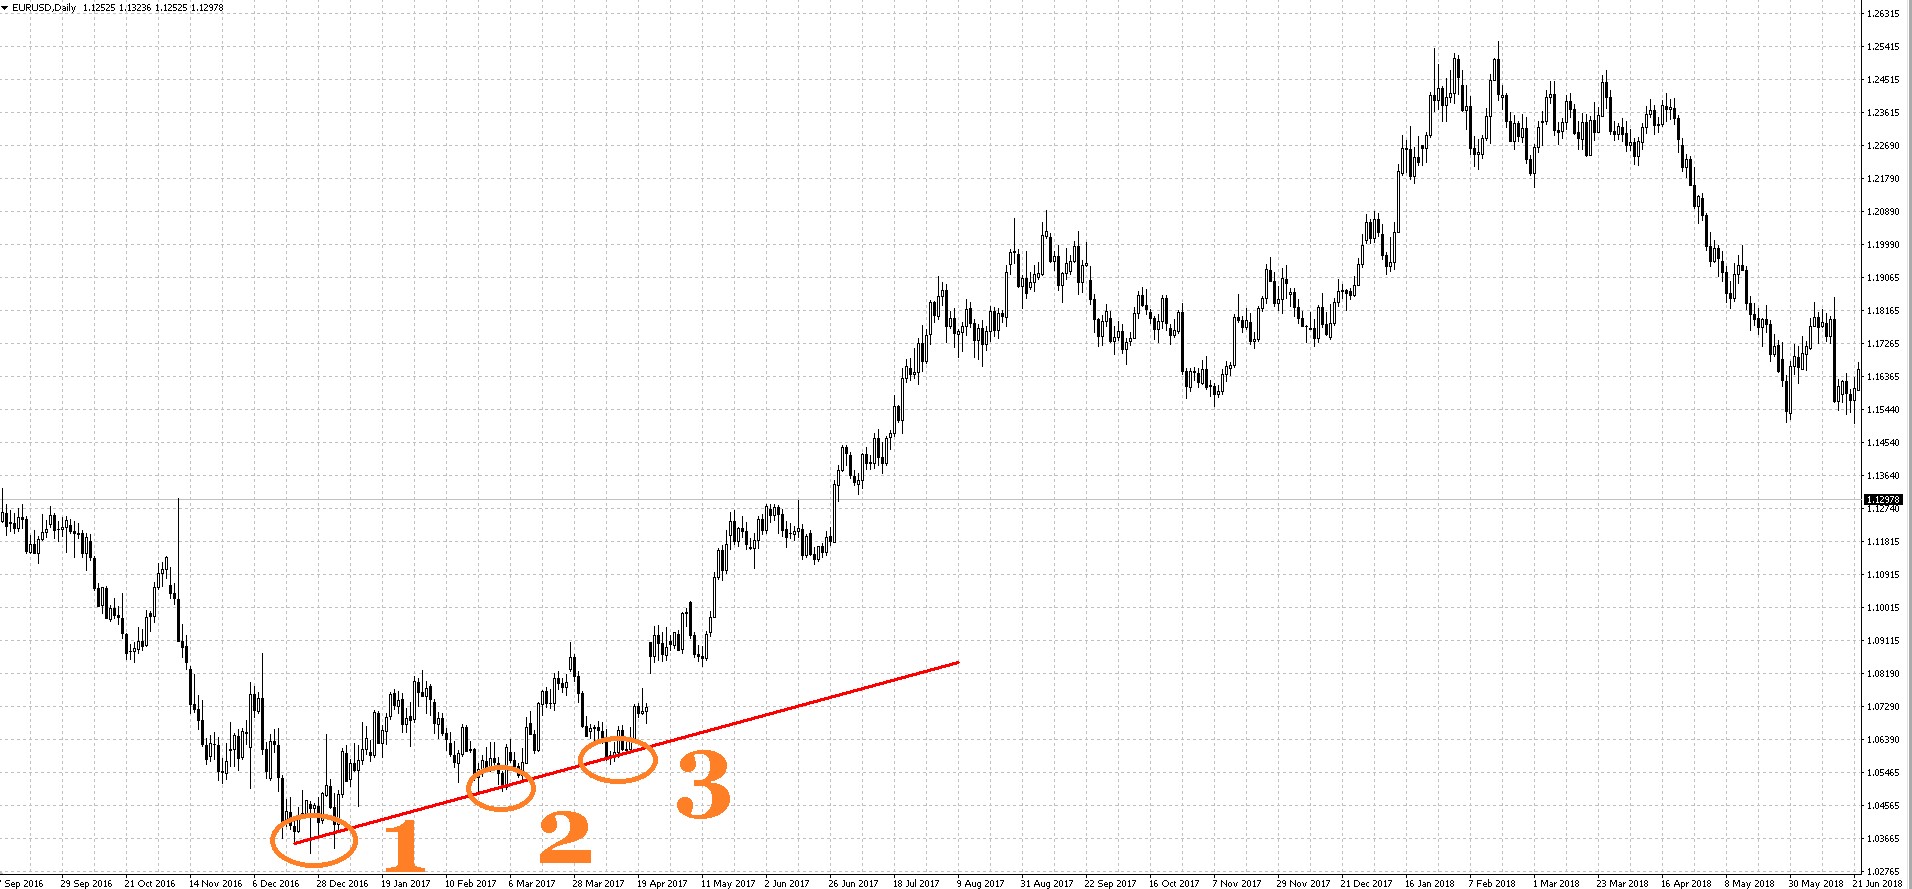
An uptrend is determined when prices rise. We get the opportunity to draw an upward-sloping line. It is drawn through two consecutively rising bases of price bars that have an absolute bottom relative to at least two previous and two subsequent bars. The best moment to enter the market comes at the third touch of the trend line by price. At this point, one certainly has to buy, and only buy. The entry here is assumed to be made using limit orders, and only occasionally market orders, if there are compelling reasons for that.
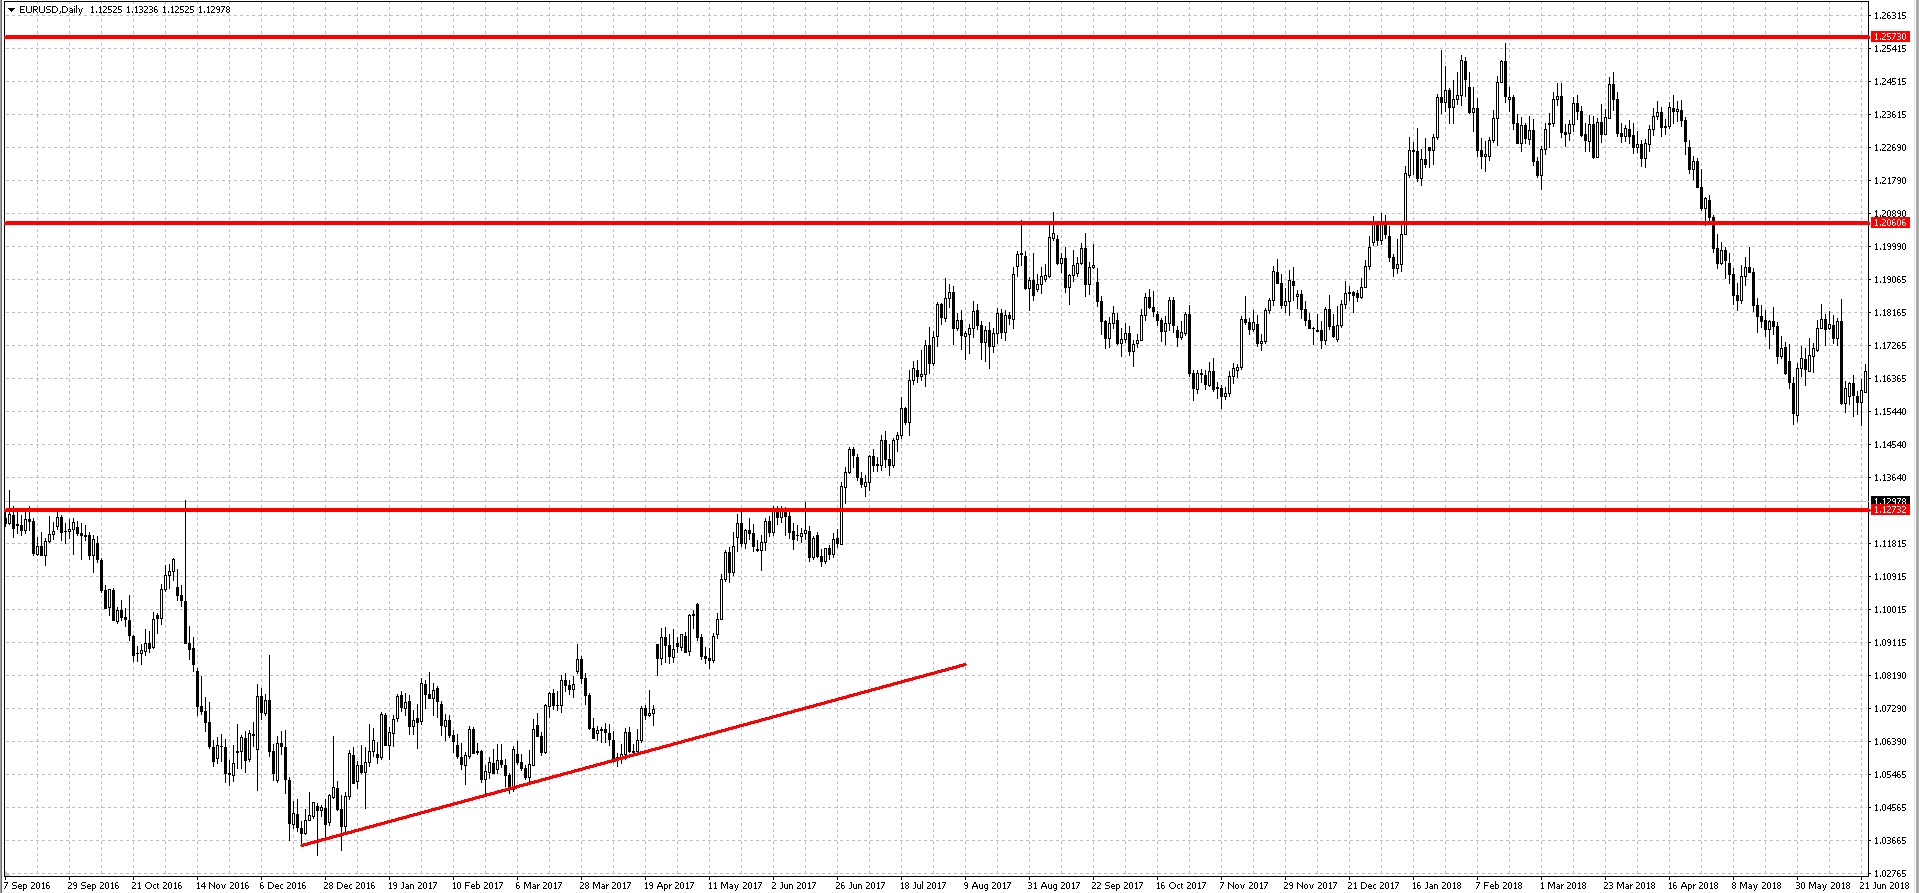
 When using such a technique, it is worth marking the main price levels in advance. They can serve both as a guide for taking profit and help you avoid entering unpromising trades. The best option for this is to use daily charts. More precise marking can be done using hourly or 30-minute charts. In the figure below, the price levels served as an excellent guide for setting targets.
 The use of trend lines is negatively affected by false breakouts, which create the appearance of a break through the trend line. Unfortunately, it is impossible to recognize whether the break is true or false until the bar that broke the trend line closes and the next one begins to trade. Very often, traders wait for other clues from price, for example the formation of Price Action patterns. Of course, it is best to use the daily timeframe, but hourly and half-hour charts also perform well.
Breakout Trading

Price breakout trading strategies through important levels are considered the most effective ways of managing trading positions, providing high profitability. They are often associated with stop orders, which are triggered directly at the moment of the breakout and thereby make it possible to take a position at the very beginning of the developing price impulse.
All of that is true, but in many markets stop orders are not very practical, and often even dangerous for a trading account, so this path is not always justified. For breakout strategies, options for entering the market with limit orders provide a greater opportunity to make a profit with relatively low risk.
In a rising market we often observe price movement upward developing in a zigzag pattern. As a rule, in the first third of the trend, when it has already become evident and the bulls have moved to a consistent offensive, the bears still retain serious strength, so they often manage after each price surge to push prices down so far that they fall to the level of the penultimate peak. Sometimes the decline stops there, after which a new upward movement follows, pushing prices higher.
If the trend is strong, then the depth of the decline rarely exceeds the 23% level, and even more rarely the 38% level, of the last fully completed downward market movement.
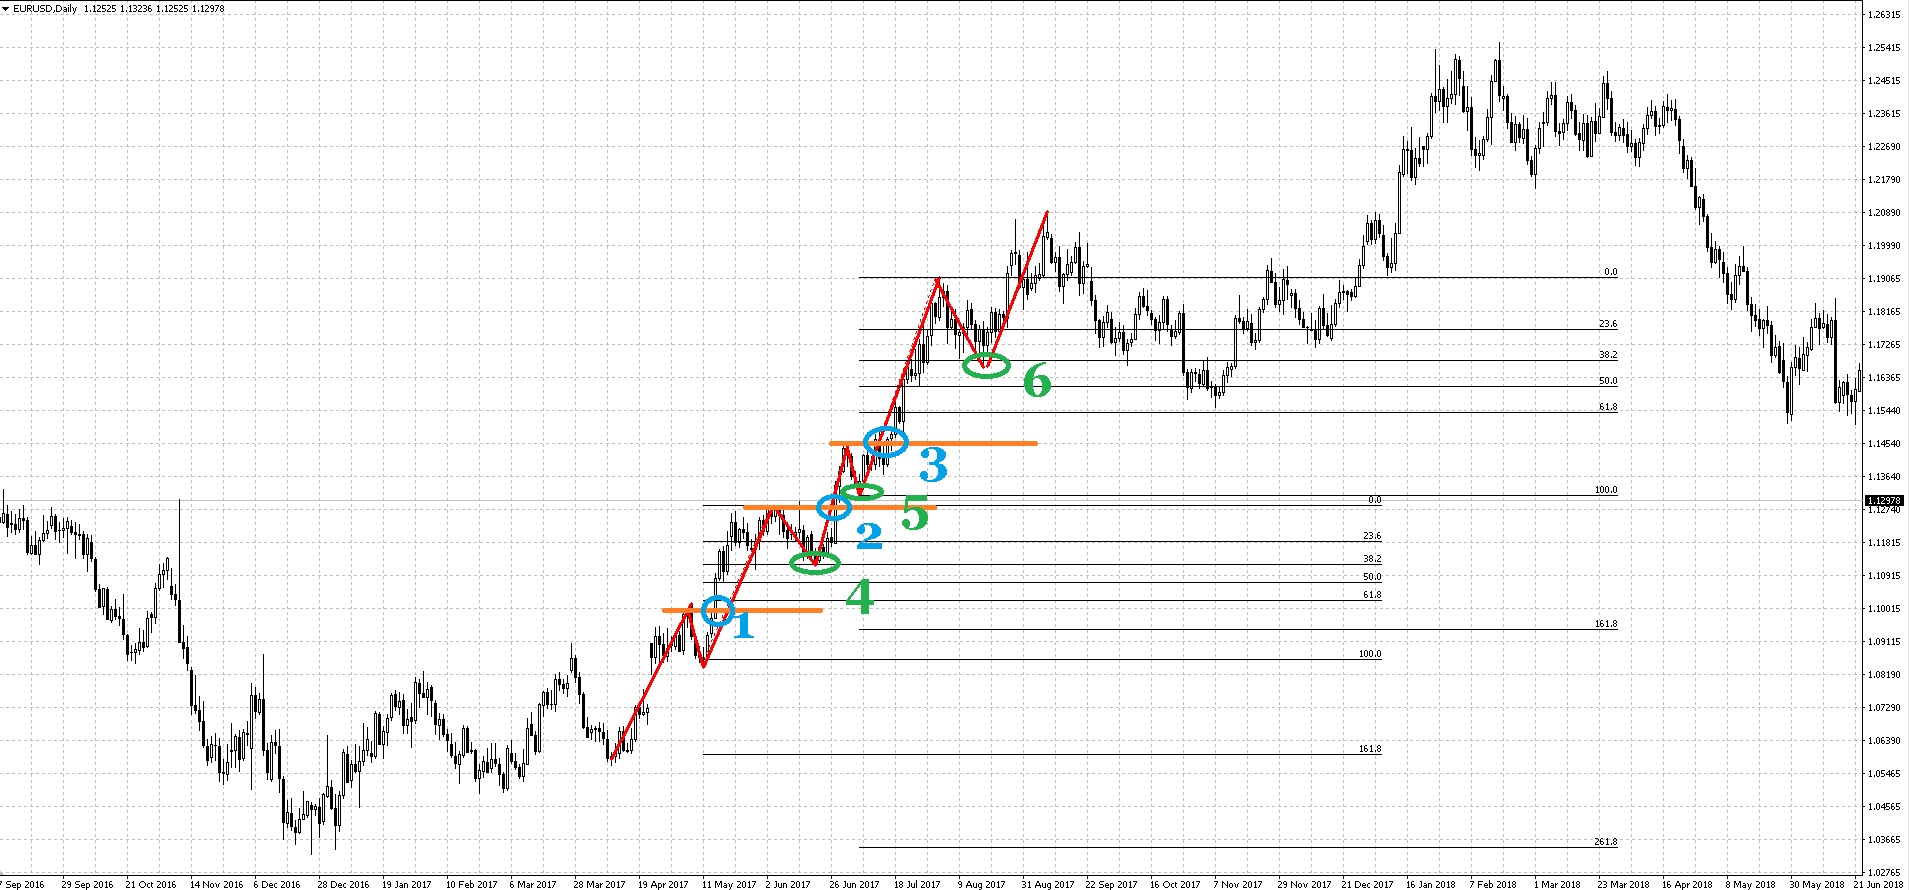 As can be seen from the figure above, points 1, 2, and 3 are breakouts of the previous highs. Points 4, 5, and 6 are optimal entry points, and they are located at the 38.2% levels. Thus, instead of using stop orders to enter a position, limit orders can be used.
Trading in Sideways Movement

Trading in a sideways market movement seems to many to be a rather dangerous and thankless task. Attempts to apply breakout strategies in a flat market work poorly, and quite often roughly the following scenario develops: after stop orders are triggered, prices move for some time in the desired direction and then reverse, ultimately bringing losses. Few can buy from the lower boundary of the trading range and sell in its upper area, because the psychological tension is too great, since for the most part one has to trade against the current trend.
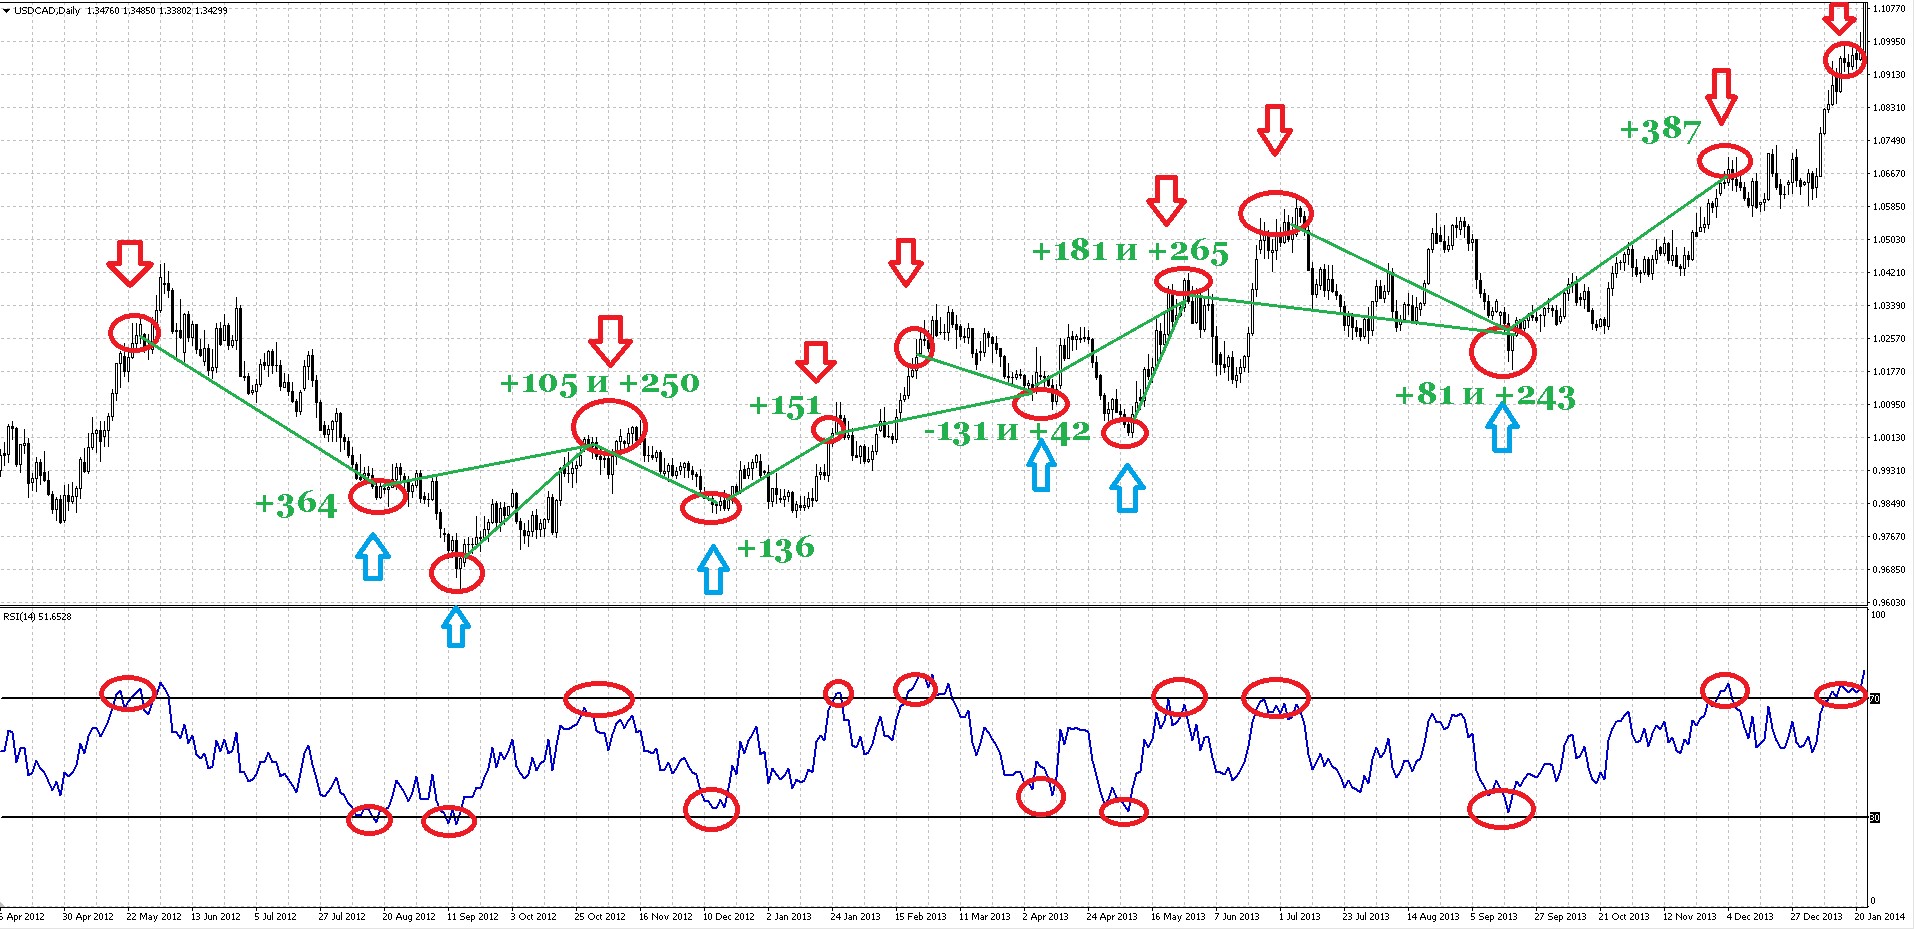 Nevertheless, when trading in a flat market, the best tools are oscillators. There are many varieties of such a trading approach, for example, night trading. As a rule, entries into positions in these cases most often occur with market orders.
Another option, as shown in the figure above, is leisurely trading on daily charts using one of the oscillators. When there is no established powerful trend, such trading brings a small profit. Stops, as a rule, are not used, while on each new oscillator signal either an addition is made or a profitable position is closed. Entry is usually made with a small lot, hence the low profitability of the strategy. Another drawback is the need for quite large capital for such trading or the opening of a cent account.
As can be seen from the figure, in about a year on one pair you can earn about 2,000 points. Problems arise when a strong trend begins, as in the figure below:
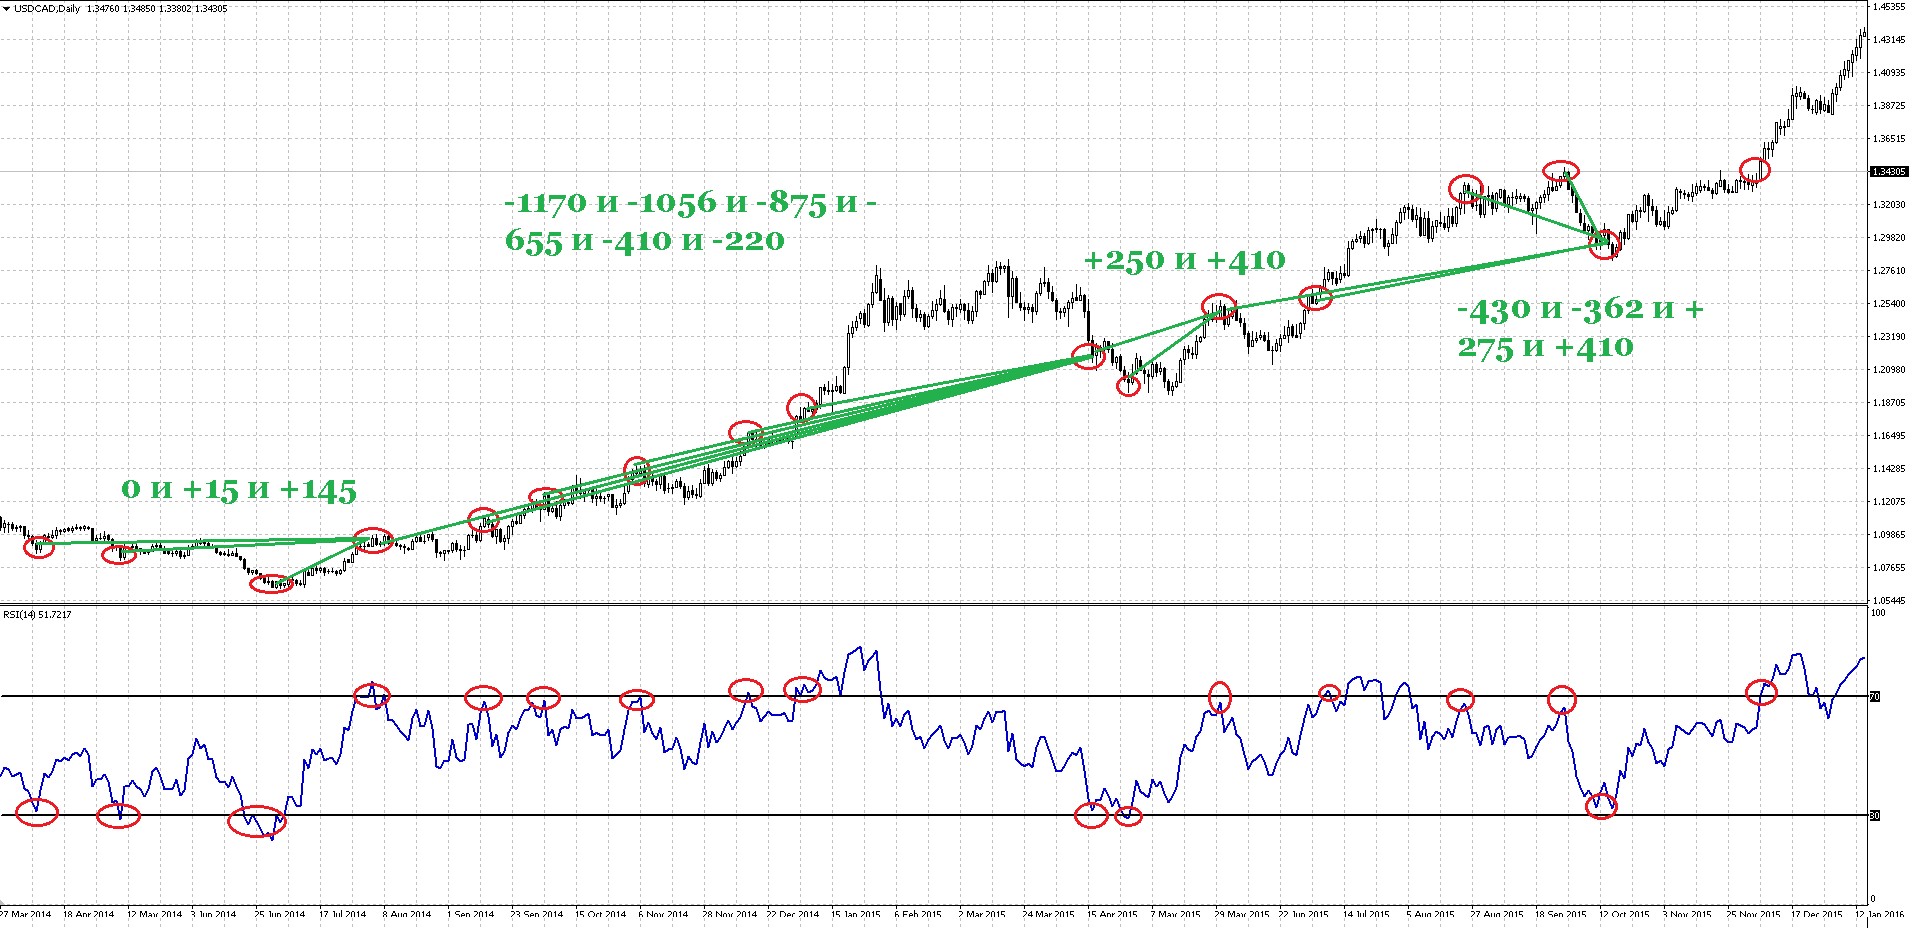 Thus, it is possible to get several large losses in a row. That is why trading against the trend is considered dangerous.
Exits from the Market

Getting an entry signal is quite simple. Before entering any trade, we know exactly what must happen for a signal to form, and if market conditions match the rules of our system, we will receive a correct entry signal. Entries are simple because we can set all the conditions for them in advance, and the market must come into line with these conditions, otherwise the trade simply will not be opened.
But when we are in the market with an open position, the number of likely scenarios for what can happen to our trade is infinite. It would be extremely naive to hope for effective returns in all trading situations with only one or two simple exit strategies. Nevertheless, everything I observe on forums and in descriptions of various trading systems is, at most, a couple of rules for exiting a position.
Good exits from a position require enormous work on their content, and simple single-option exits are far from as effective as a series of well-planned exits in which many possible options for the development of the situation are provided for.
As you remember, the very first task of a trader is to protect capital from any catastrophic losses. On the other hand, if you worry too much about losses, you can begin to close trades early at the slightest hint of a reversal and thereby miss potential profit. Thus, it is very important to maintain balance.
Something is constantly happening on the world stage, various news items are released, fundamental factors emerge, various catastrophes occur. Predicting in advance where the price will move is a very difficult task, especially if you do not possess extrasensory abilities.
And since it is impossible to predict prices of market assets, you simply need to accept this fact. It also follows from this that no indicator can predict the future movement of prices. The same applies to fundamental, and technical, and in general any analysis. Sometimes I see beginners asking more experienced traders to suggest where the price will go. It looks funny.
The question suggests itself: then why all these indicators and complex methods of technical analysis? Everything is simple: they help to understand the current situation, the situation at the present moment. For example, by analyzing indicators, at point 1 one can find a potential entry into a trade.
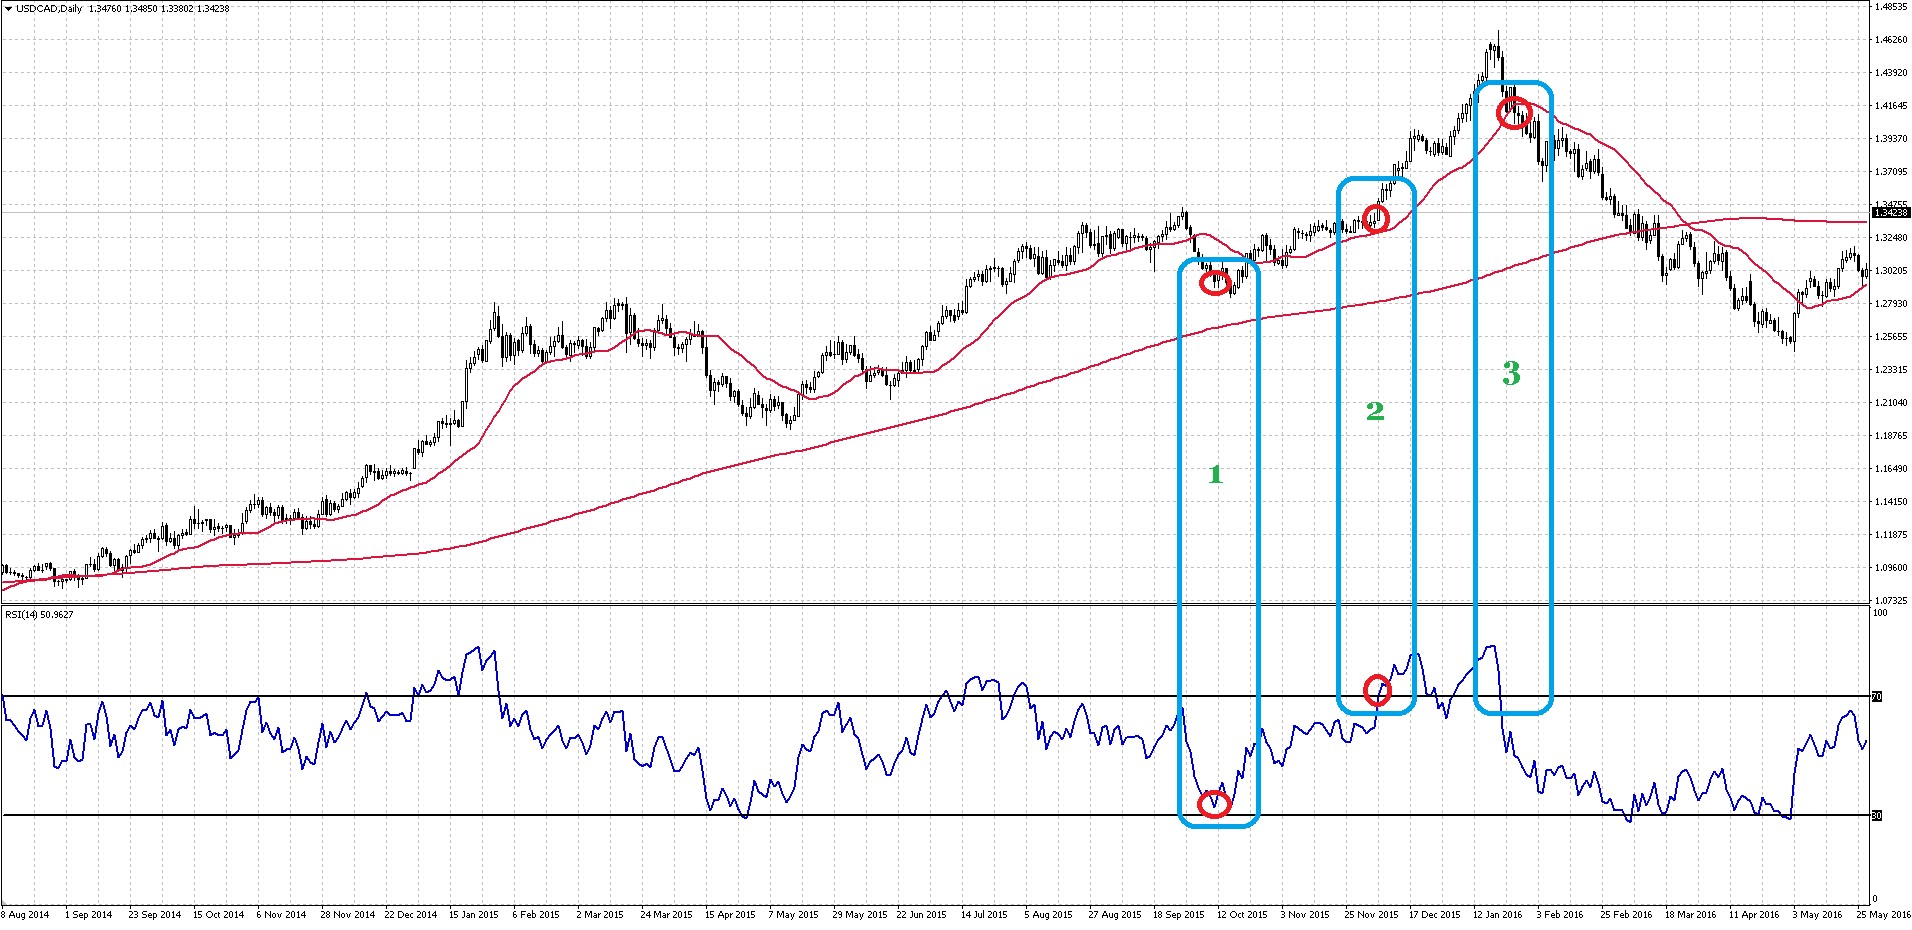 The moving average with a period of 200 is below the price and rising, which indicates an upward trend. This does not mean at all that the price will not reverse right now and a bearish trend will not begin; it means that at the moment the trend is bullish and so far there are no reasons for this to change, which implies a certain probability that in the future the trend will also continue. The oscillator is almost at the oversold level, which indicates that the preceding pullback has already lasted quite a long time. The oscillator will not show you the exact point where the pullback ends, but its presence at the oversold level sort of hints that it is already time for the pullback to end.
The levels themselves are constructed in such a way that upon reaching them this is most often exactly what happens. But this is not a fact: the price can remain near this level for a long time while the market continues to fall.
Nevertheless, at the moment the situation, based on our simple analysis, indicates that the movement will most likely continue. At the same time, this probability may be only a little more than 50%, say 55%. That is, in 45% of cases we will be wrong, and that is normal.
So, we enter the trade and our analysis turned out to be correct: the price really did reverse and is moving upward. Most often, as I have already said, some single primitive exit option is used in systems. This option does not take into account at all all the possible developments after entering the trade; it considers only one option. In our example, at point 2 the oscillator reached the overbought zone and the trade was closed.
But, as you can see on the chart, there were no adequate reasons to exit. If we had not used this exit option and had simply trailed the stop behind the moving average with a period of 21, we would have earned almost 3 times more and at the same time would have exited at a logical point: after the exit, the price continued to fall.
But the point is that conditions for exiting coincided so favorably only in this particular example. In another part of the chart, that same oscillator exit would have worked better. In a third, something else would have worked better. But at the same time there are not so many options for a preferred method of exiting trades, and no one forbids you from using several exit options in your system. Now let us examine the main ways of exiting trades.
By take profit

This is one of the most ineffective ways to close a trade. As was already said above, in advance we can never know how far the price will go from the entry point, and limiting your profit with a fixed ceiling sounds illogical. Nevertheless, take profits still need to be set, since you cannot always be at the terminal, equipment can fail, and it would be disappointing if your trade had been bringing in a lot of profit, but then the price reversed and you got a stop only because you did not set a take profit. But the take profit should be technical, specifically about 2-4 times larger than the stop loss.
By stop loss

The optimal stop loss option has already been discussed more than once. Some like shorter stops, some longer ones, and so on. A stop that is too far makes it ineffective, one that is too close will be triggered constantly. It is important to understand that the task of a stop loss is not to avoid losses or reduce their size, but merely to limit their maximum size. Losses are reduced by completely different methods, which we will discuss below.
By time

As a rule, any strategy has an average position holding time, and deviations in one direction or the other bring less efficiency. Thus, if a trade has been hanging for three months already, for example, it is time to close it.
Another approach is closing a trade after a certain number of candles, if the market is not moving in a certain direction, or the trade has little profit.
This option for managing a position allows you to improve trading results and not hold trades when the market is not ready to give you profit.
On large moves

In this case, the exit occurs on a strong, clearly unusual move during the day. Personally, I use this exit option if the price has passed more than 3-4 levels of the ATR indicator in a day. Such behavior, as a rule, indicates the imminent end of the trend.
By fundamentals

Another option that may require manual intervention is the scheduled release of important news that can significantly affect the rates of the currencies being considered. As an example, one can cite Brexit, which led to a significant fall in the pound sterling exchange rate. This event was announced in advance, so it was quite possible to close positions in advance to avoid large losses.
By indicators

This is the largest group of exit methods, which includes exits by oscillators and by trend indicators. Usually I set for each such exit a minimum number of bars that must pass from the moment of entering the position for this rule to start working.
It is also useful to limit the profit or loss on the position, upon exceeding which this rule does not apply. For example, we can make an exit from a buy twenty bars of the current timeframe after it was opened, if the oscillator has reached the overbought level and the profit is at least 40% of the take profit level.
At levels

Exiting at levels quite often justifies itself, since prices often begin to move against our position after reaching levels. There are quite a few indicators that determine levels automatically. And although such levels are of little use for finding entry points, using them for exiting positions is quite effective.
Position management

In addition to timely entry into a position and a good set of options for exiting it, it is also important to think through options for modifying the stop loss level as a safeguard in cases when indicators, due to their lag, do not manage to signal an exit from the position in time.
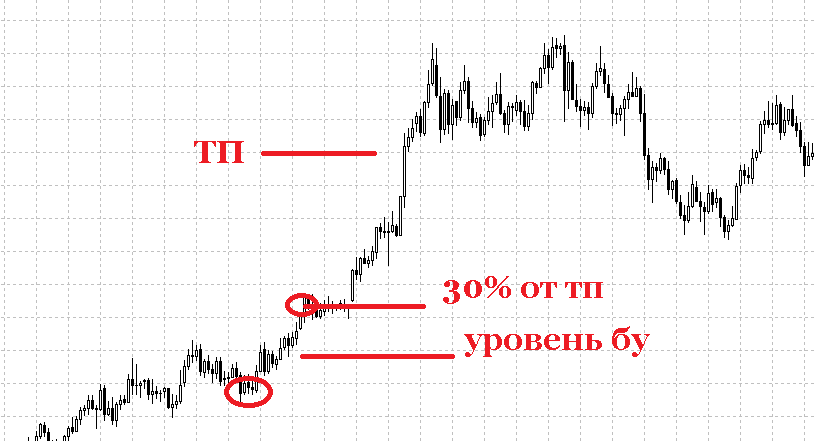
Therefore, the very first option should be a strategy for setting the breakeven level. As a rule, I set the stop loss to the breakeven level when the price covers 30% of the distance to the take profit. At the same time, I usually add 4-7 points above the order opening price in order to compensate for losses on swaps and possible slippage.
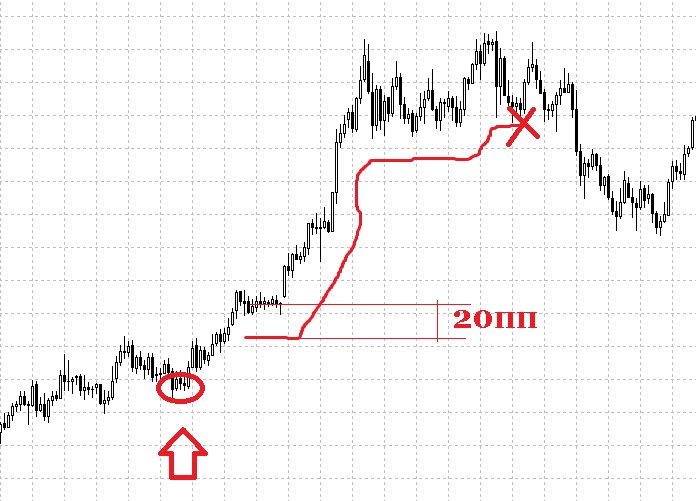
 The simplest method of a trailing stop is a fixed trail. In that case, the stop is pulled after the price in such a way that between the price and the stop level there is always exactly the number of points that you specified. The stop follows the price strictly and does not move back.
 A more adaptive option is setting the stop by a moving average. For daily charts, as a rule, EMA21 with a shift of 4 works well:
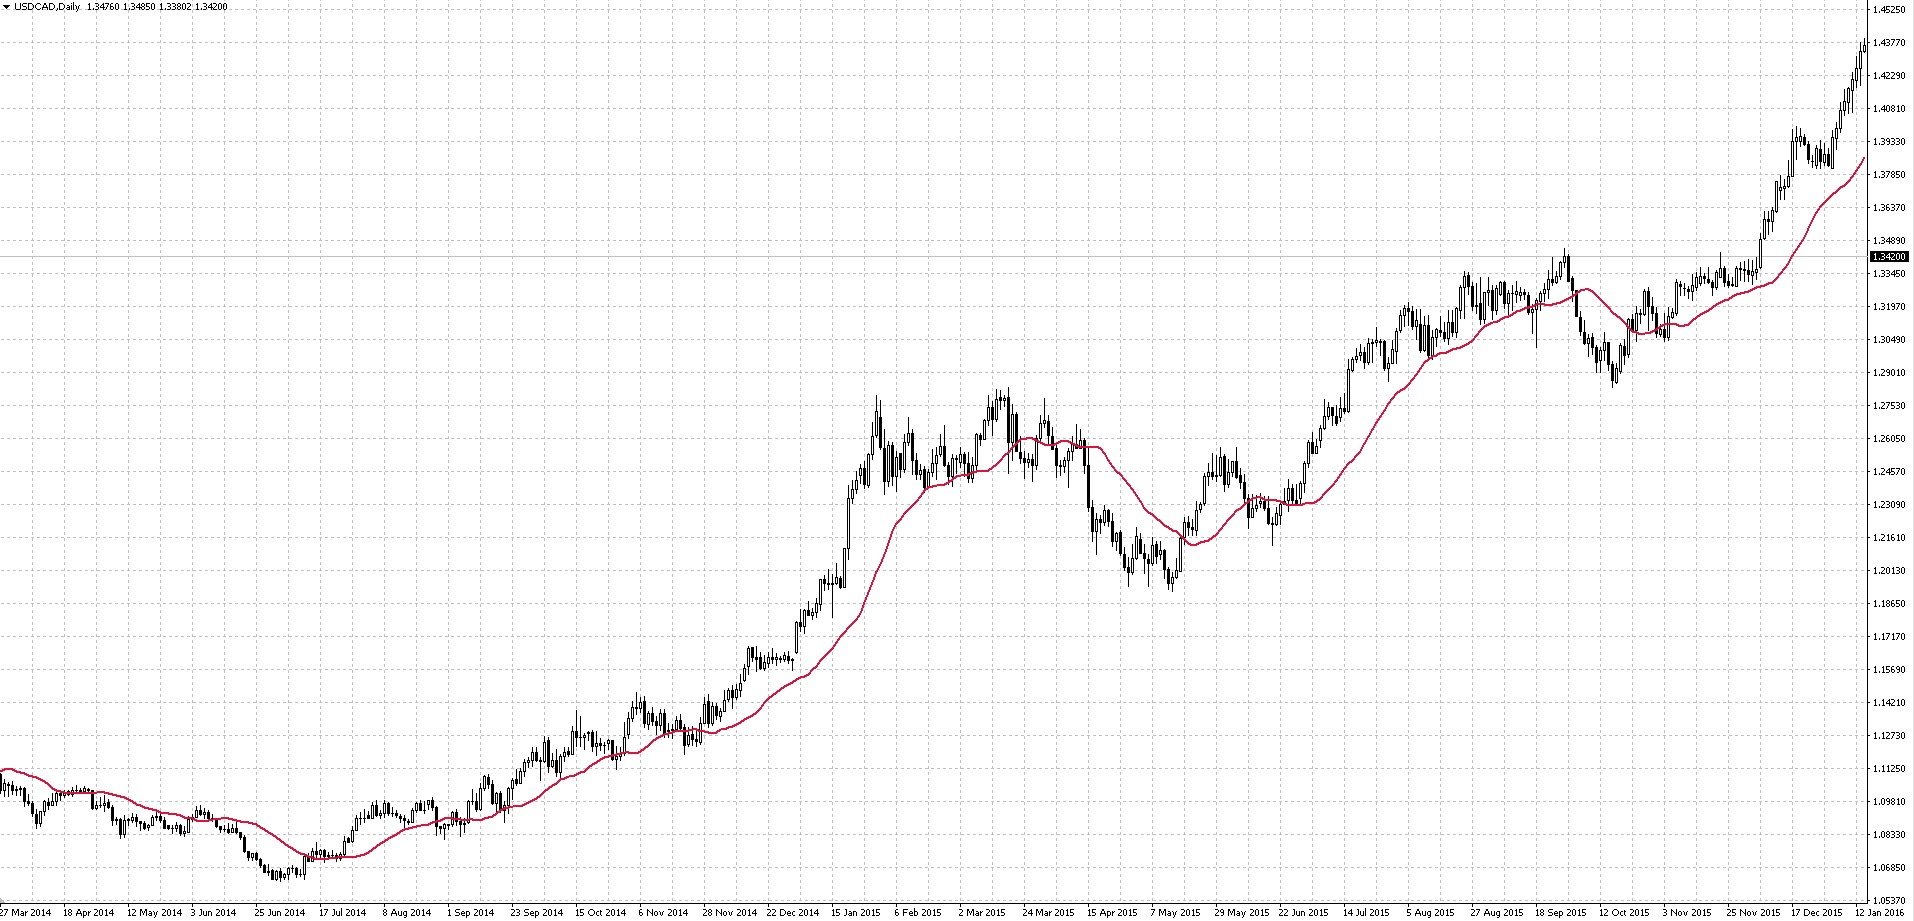 A moving average with such parameters allows you to work quite well in trending markets. Intraday, an EMA with a period of 48 works better.
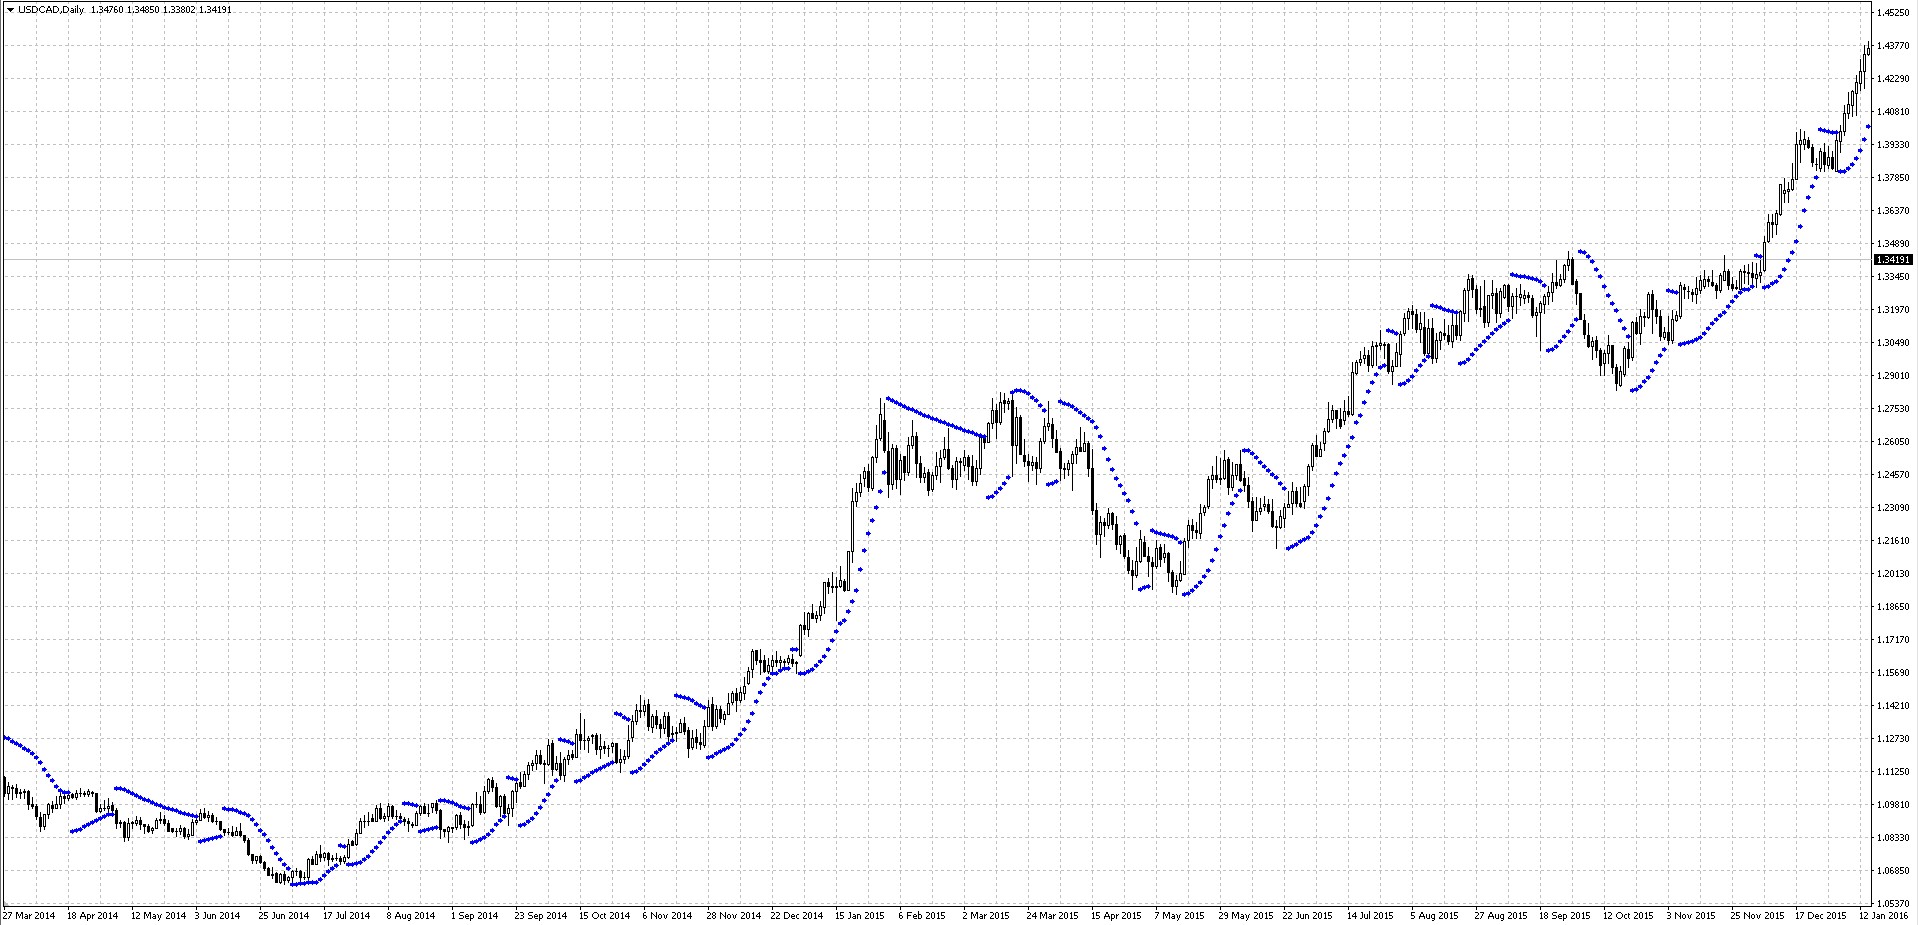
A trail by the indicator Parabolic SAR is also often used. It allows positions to be managed quite effectively in medium-term trading, when there is no task of squeezing everything possible out of the trend.
 The ATR indicator is excellent for setting stops. If you try to use this indicator to work with trailing stops, you will get a good option that will pull the stop quite effectively at moments when the price accelerates. During high volatility, such a stop will stay at quite a large distance from the price and in the event of sharp fluctuations it will not be hit.
On the contrary, when the market has gone quiet and volatility is very low, such a trailing stop presses close to the price and, during unexpected bursts of activity, will not let you lose much. And as you know, after acceleration the price quiets down, the market gathers strength for the next dash. If this dash happens not in our favor, we will be protected by an ATR trailing stop.

Another of the most common options is trailing by candle shadows. This method consists of the following. A given window is taken, say, 10 previous candles, and the minimum low for buys and the maximum high for sells are determined:
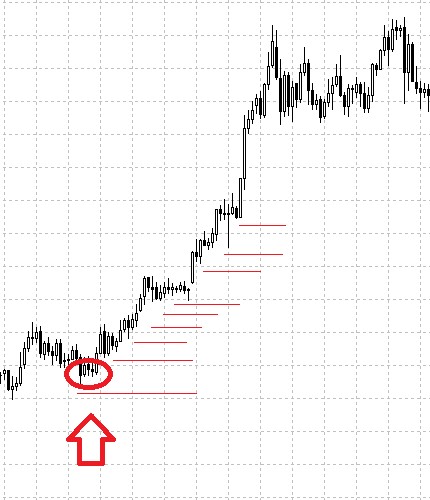 On each new candle, recalculation takes place in such a way that exactly the last 10 candles participate in the calculation. This type of trailing performs well on periods from H4 and higher, since there is too much noise on lower TFs.
Conclusion

Today we became acquainted with the main, most common ways of managing open positions. There is also a large number of less common and more sophisticated methods, for example, the "noose" trailing stop, the description of which I left outside the scope of this article.
Besides becoming familiar with these techniques, you need to understand that it is very important to use sets of these methods together, in combination with one another. The fact is that in certain situations some methods work better, while in other situations others do. For example, an exit on a volatile day (a day whose price movement range exceeds 3-4 ATR levels) will never work just like that on an ordinary trading day, but it will save you when other indicators have failed to notice serious changes.
Trailing by a moving average will prove effective when urgent news appears, which will entail a sharp price change, while trailing by the ATR indicator will be somewhat far from prices. But when the market quiets down, trailing by the MA will be far away, and by ATR it will be exactly where it is needed.
All these methods should be applied together; in this way, your system of exits and position management will be as effective as possible, and you will be ready for any surprises.
Respectfully, Dmitry aka Silentspec Tlap.io
