
Affine Transformation in the Forex Market: What Is It and Is There Any Benefit to It?

It is no secret that currency pairs Forex, like any other instruments, possess so-called "historical memory." Movements during periods of local and global crises often coincide almost to the point of mirror-image symmetry, which allows analysts to draw analogies successfully and forecast future market movements. Corrections from resistance and support levels work according to the same principle as well.
Today we will try to sort out a very unusual topic. We are ready to bet that you may have heard about affine transformation, but you probably never suspected its use in the context of trading. And there is something to see there even for seasoned currency speculators)
An ideal example of such constant coincidences is the chart of our service of seasonal Forex fluctuations, which makes it possible to forecast global trends with a high degree of probability.
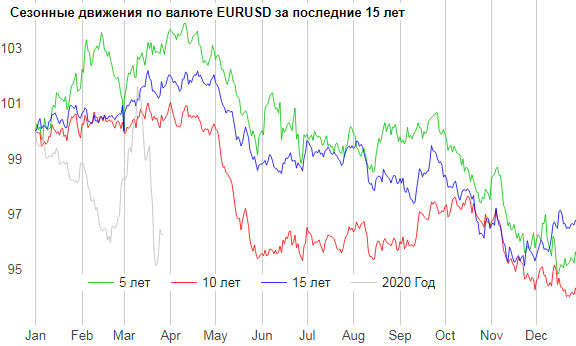
It is inconvenient to match and compare the movements of currency pairs in the past and at the current moment; they can be replaced by simple elements of geometric figures: horizontal and sloping lines in the form of price channels. If the historical memory of the market is considered a proven fact, then the resulting figures are subject to affine transformation, capable of carrying out graphical analysis in advance on the "future" section before the price appears there.
Affine Geometry in Trading

Affine geometry describes methods of transformations and projections of figures, the mandatory condition of which is the preservation of their shapes and properties. Simple examples of affine transformation are: a straight line projected onto another plane as a parallel or intersecting line; a square stretched into a rectangle; and so on. Preserving proportions in affine geometry is not required; the only important thing is that a square will never turn into a triangle.
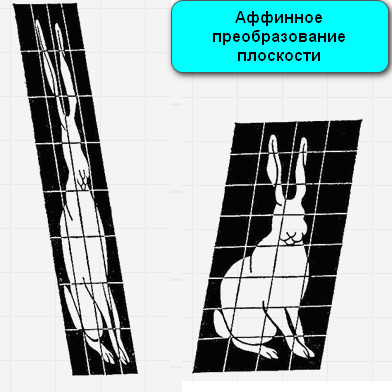
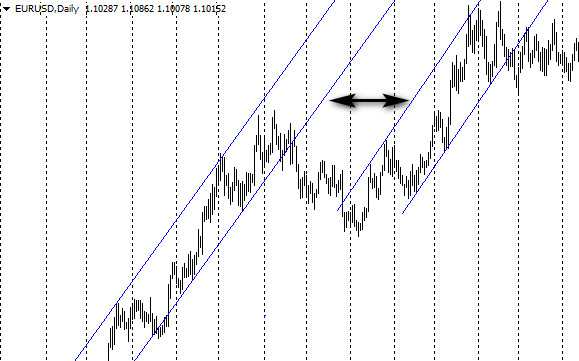
Affine geometry works in trading, starting with simple examples of transferring price channels, when quotes break through boundaries and shift to a new level into another area of the chart.
More complex examples are Elliott waves, various chart patterns (Gartley and similar figures), and candlestick analysis. A trader each time looks on the chart for exactly similar combinations of candles, rising and falling waves, without paying attention to their proportions.
Identification and projection of patterns makes it possible to determine entry points, levels for taking profit, and limiting loss. Methods of graphical analysis are far from suitable for all traders; beginners are especially often confused:
- Making mistakes in construction because of ambiguous rules for depicting figures;
- Missing patterns because of insufficient experience;
- Showing inattention under emotional stress.
The last factor is a major trading problem, on which many books have been written, including by Van Tharp and Mark Douglas. It is difficult for a trader to concentrate on a "working" chart and not notice the changing dynamics of candles. Affine transformation solves these problems, because the lines are built on a "clean field" in the future period of the chart, transferring price corridors from the past without changing the sizes of the channels built automatically.
Trading System Characteristics
Platforms: any with a package of graphical tools present
Currency pairs: any
Timeframe: D1
Trading time: beginning (end) of the session
Recommended brokers: Alpari, RoboForex, TickMill
Trading System Description

On the chart of daily candles divided into monthly segments (the CTRL+Y key combination in MT4), we find sections of rising and falling trend.
We describe the nearest uptrend and downtrend found using linear regression (LRI). We transfer the resulting channels one month forward in the form of a grid. As price appears on the empty section of the chart with our grid of quotes, we trade breakouts and countertrends according to the rules described below.
Grid Construction Rules

The price corridors described by the LRI are built within the rigid limits of the month. For convenience in construction, the starting and ending points are provided by period separators, which can be enabled on the "Common" tab in the chart properties window opened through the right mouse button menu, or by the quick access option (F8 key).
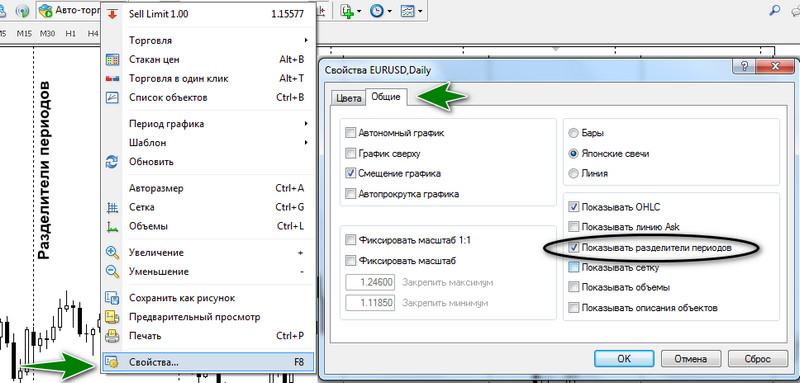
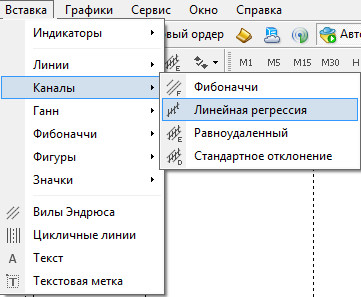
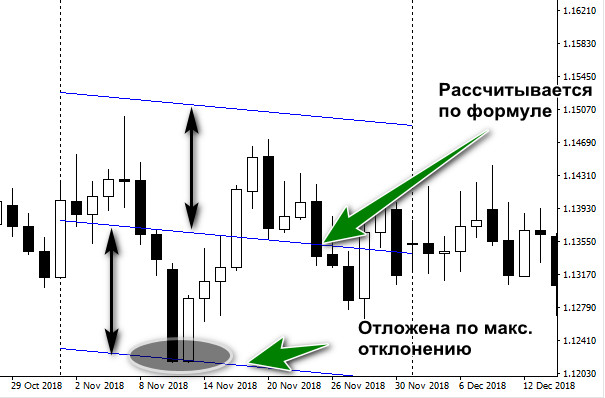
Linear regression is located in the "Insert" menu under the "Channels" option. This is an automatically calculated tool based on a formula that determines the angle of inclination and the position of the middle line. It is removed at an optimal distance from all candle closing prices in the section selected by the trader.
One of the LRI boundaries is set at the level of the maximum deviation of the currency pair rate in either direction. The second is built at the same distance parallel to the middle line.
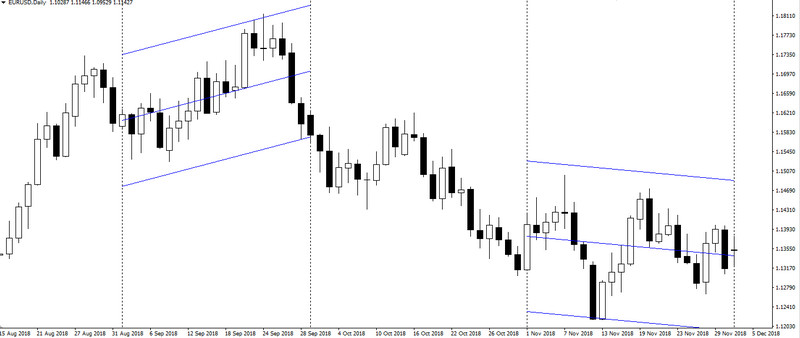
On the last candle of the current month, the trader draws the first linear regression channel. The next step is to search for and build a channel opposite to the first trend. In the figure below, there was a downtrend in the last month, which means it is necessary to look for the nearest upward section; in the example it was two months ago.
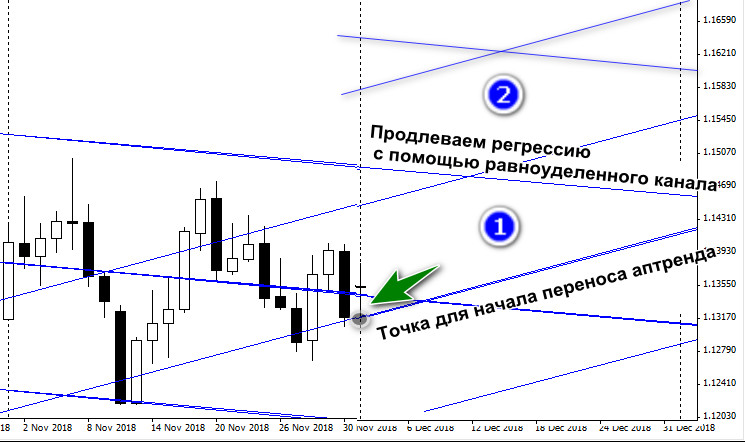
Both linear regressions should be transferred (affinely transformed) to the still-empty section of the future month. A mandatory condition is that it is necessary to preserve the distance between the parallel lines using equidistant channels.
The lines of the current LRI can be extended using the "equidistant channel" tool. In the same way, the ascending regression can also be copied by building its middle line from the closing minimum of the last candle of the month.
The resulting grid is built 2 cells up and down from the middle line; this is related to the principle of the normal distribution of a random variable (σ), used in Bollinger Bands and other indicators. Within 2σ are 95.45% of the values of a random variable, which gives a high probability of a correction at the second constructed level.
Strategy Operating Rules

The rules for working with the strategy are standard: the levels transferred earlier can be used for trend and countertrend trading.
A short position is opened if the slope of the linear regression in the previous month was downward, the tail of a rising candle touched the upper boundary, but the close remained inside the channel.
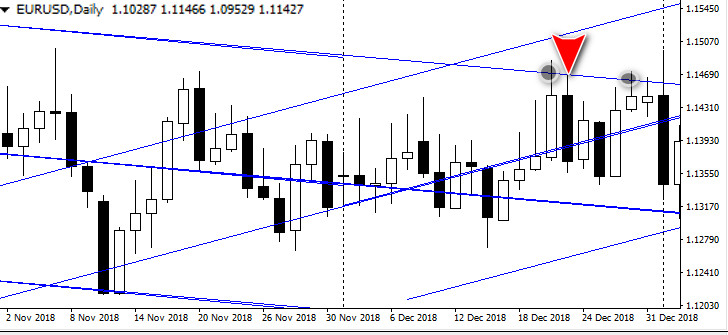
If the regression in the previous month was directed upward, then a long position is opened under the same conditions.
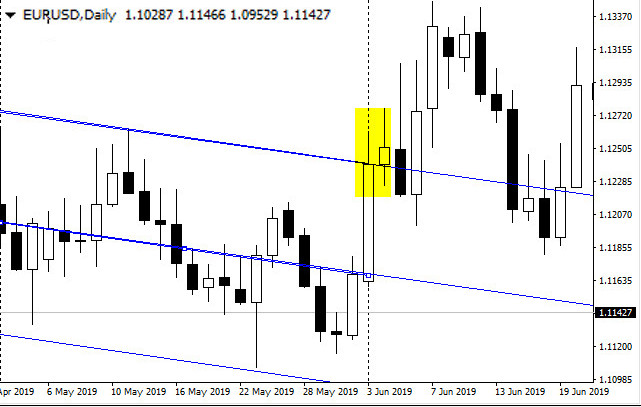
A short is also opened when a candle breaks the line of the descending channel, if the next candle closed below the upper line. A long is opened under "mirror" conditions.
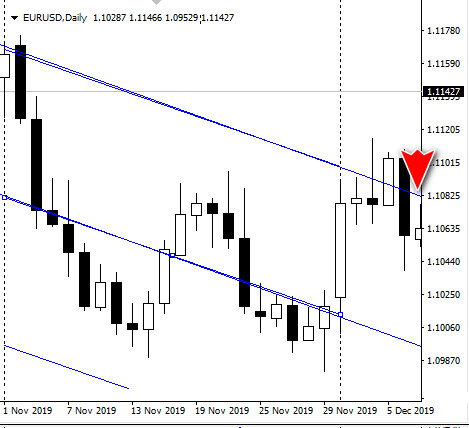
Trend trades are canceled by two consecutive candles with a closing price above or at the level of the linear regression channel of the previous month. In the case of a long, the situation is the opposite: the ascending channel must be broken by two falling candles.
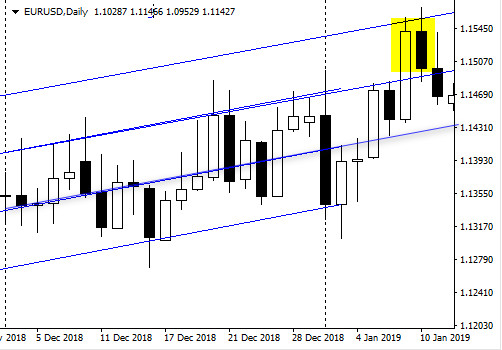
Countertrend trades are made by approximately the same rules, but on the second superstructure. The figure below shows the strengthening of the trend, shifting quotes to a parallel second level of the previous month's regression that matches the ascending channel in size.
A rising candle breaks the upper boundary with its tail, but closes inside the channel; this is a signal for a short.
Strategy Money Management

The transferred channel lines are ideal targets for take-profits. When trading with the trend, a trader can partially lock in the position at the second channel levels or close the trade when the regression lines are broken in the opposite direction (the two-candle rule).
Trend and countertrend trades are accompanied by a stop-loss at the high/low of the candle whose tail broke the channel, or on the second candle that returned to the channel.
Conclusion

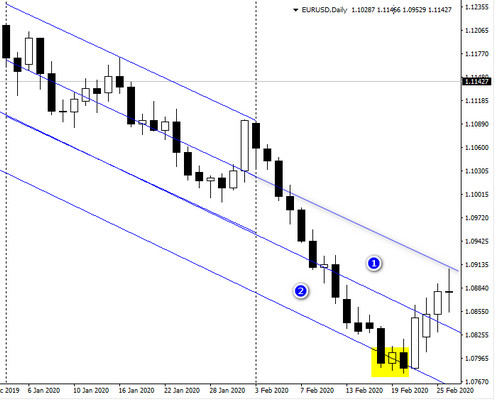
The linear regression of the range of the nearest month allows the trader to quickly take into account changes in volatility. The figure below shows that during a crisis, the sharp strengthening of the US dollar in the EURUSD pair could not break through the second zone of linear regression.
The reverse movement in the form of the strengthening of the euro and an even greater increase in the volatility of the trading daily range also "fit" into the linear regression channel.
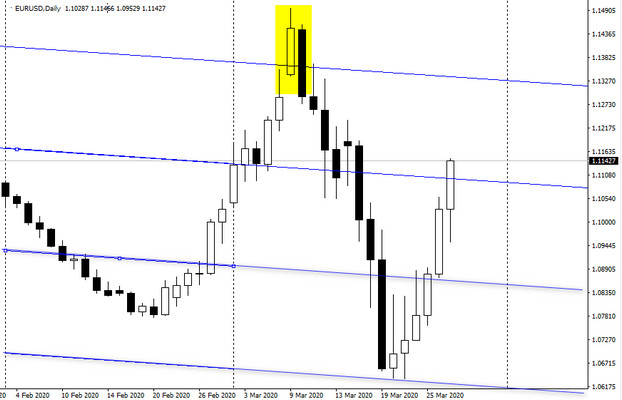
This shows that such a methodology has a right to exist and can be used by currency speculators in Forex trading.
Sincerely, Ivan Petrov
Tlap.io
