
123 Pattern - Secrets of Profitable Trading

Hello everyone. Today we will get acquainted with the well-known forex 123 pattern. It is based on the classic definition of a trend and occurs quite often. However, in order to trade it successfully and extract solid profit, it is necessary to know the nuances of determining the quality of the 123 setup and apply special tactics for exiting positions. This is what we will talk about.
Pattern 123 is a reversal chart pattern that occurs quite often on charts and is a fairly good signal for entering the market.
123 patterns occur at the end of trends and sharp fluctuations in the price chart and indicate a change in the direction of the trend. They can also occur within the boundaries of a trading range and sometimes arise at the end of corrections of the current trend.
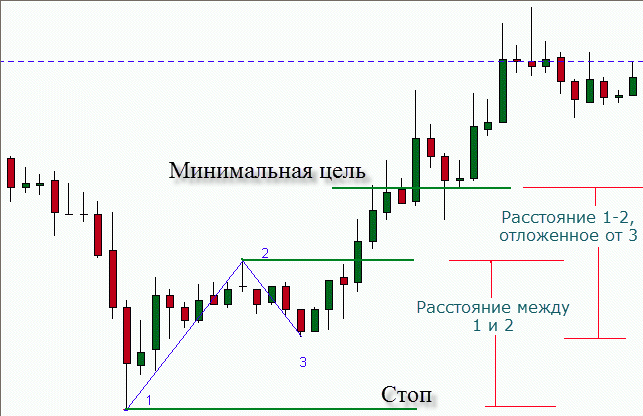
In the example above, a typical 123 pattern formed at the bottom, at the end of a downtrend, is demonstrated.
The price chart draws a new low (point 1) and makes a bounce upward to a high (point 2), from which a correction downward begins. After that, the price chart draws a second low (point 3), which is located somewhat higher than the previous one (point 1).
Then from this higher low (point 3) the price chart resumes its upward movement, which confirms the change in the direction of the trend. A breakout of the level of the previous high formed at point 2 is a signal to open a long position.
Such a simple pattern is very easy to spot on a fading trend, and it is a signal confirming a change in the direction of the trend.
Formation of the 123 Pattern

If we consider the main reasons for the formation of this pattern, then we will be able to understand why it works so well. The gradual formation of this pattern will look as follows:
• A pullback of the initial downward price movement serves as a signal for a change in the direction of the trend.
• The inability of the price to show a new low.
• A repeated return of price movement upward, creating the expectation of a reversal.
• A breakout of the level of the previous high, confirming the reversal.
At this moment all traders expect the appearance of additional signals for an upward trend.
This is due to the fact that traders who expect the continuation of the downward trend would place their stops above point 2 in this pattern. And if their stops are taken out, these traders will immediately close their short positions and open long ones, seeing how the price chart confidently goes upward.
Take Profit and Loss Limitation Levels
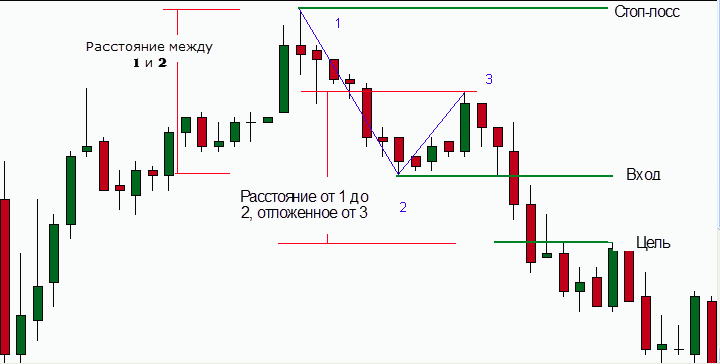
As soon as the 123 pattern has formed on the chart, it is necessary to decide on very simple rules for trade management.
Entry point. The ideal entry is considered to be a breakout of the level of point 2 - the level of the previous high (or low, depending on the situation in which such a pattern is drawn). It is worth entering with pending orders.
Stop loss. The stop loss must be set below / above the level of the low / high (depending on the bullish or bearish 123 pattern) at point 1. Aggressive traders may even set the stop below / above point 3, however, in any case, it will be better if we give the price enough room to move without touching the stops.
Take profit. As long as this model does not give us the opportunity to forecast a large target (more details in the video), the minimum target guideline can be set according to the following concept:
Calculate in this formation the interval between points 1 and 2 and measure this value from the low at point 3 - this should be the minimum distance that the price will have to travel.
In the example in the screenshot above, we can see that the price movement chart initially showed an upward trend. Then the price moves downward, and the break of the ascending trend support line gives us a signal that the trend is changing its direction. It is this last price high that we mark as point 1.
In this new downward trend, a price low takes shape, from which the price pulls back again in the direction of the previous trend. We mark it as point 2 of our pattern.
At this stage, although we already have two initial points forming the described pattern, we are still not sure whether this is a correction of the upward trend or a reversal into a downward trend.
Confirmation comes when the price chart forms a new high which, however, is below the level of the first high at point 1 (point 3). This tells us that the price does not have enough momentum to break the level of the previous high, which indicates a change in the trend direction.
If you noticed, we mentioned that this only indicates a change in the trend direction. It may also be a simple consolidation, a stage when the price can pause before resuming the upward trend again. At this stage we wait for confirmation. As soon as the price breaks the low of point 2, we open a short position.
According to our conditions, we place our stops above point 1 of this formation and measure the minimum distance that the price must travel. As we can see from this example, the price easily covers our minimum price target, giving us an opportunity to take a profitable short position.
Aggressive entry
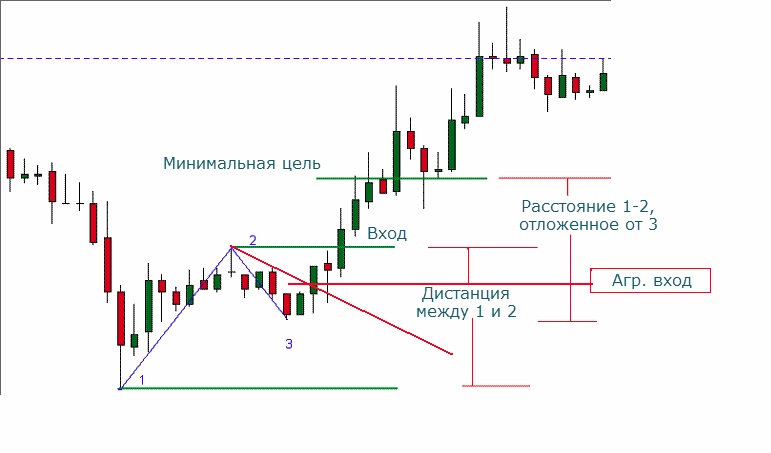
An aggressive market entry can be made on a break of the trend line connecting points 2 and 3.
Although the target and stop levels remain the same, this type of entry should be approached with greater caution, since a break of the point 2 level may never occur.
Additionally

A similar pattern, from point 1 to point 3, may be formed from 4 bars, or it may contain 20 bars. Nevertheless, the rules for working with the pattern remain the same.
It should be kept in mind that the greater the number of bars forming this pattern, the larger the expected upcoming price movement. This is not a clearly established rule, but most often this concept is valid.
Before entering the market, confirm the presence of this formation. If point 3 is formed below point 1, then this pattern cannot be discussed.
Likewise, to confirm that in this case we are dealing with a 123 pattern, the price must break the high level at point 2.
There are cases when the price consolidates in the interval between points 2 and 3, giving no signals about the upcoming direction of its movement. It is better to wait out such moments until the price movement confirms its direction.
Defining a quality pattern

I marked one of the setups on the chart below, it is labeled with points 1, 2, 3. There was a bullish trend. A high formed. Then a downward movement occurred. A low formed. This became point 2 for us. Then the price tried to form a new high. But it failed. The price reversed, and we saw a move downward.
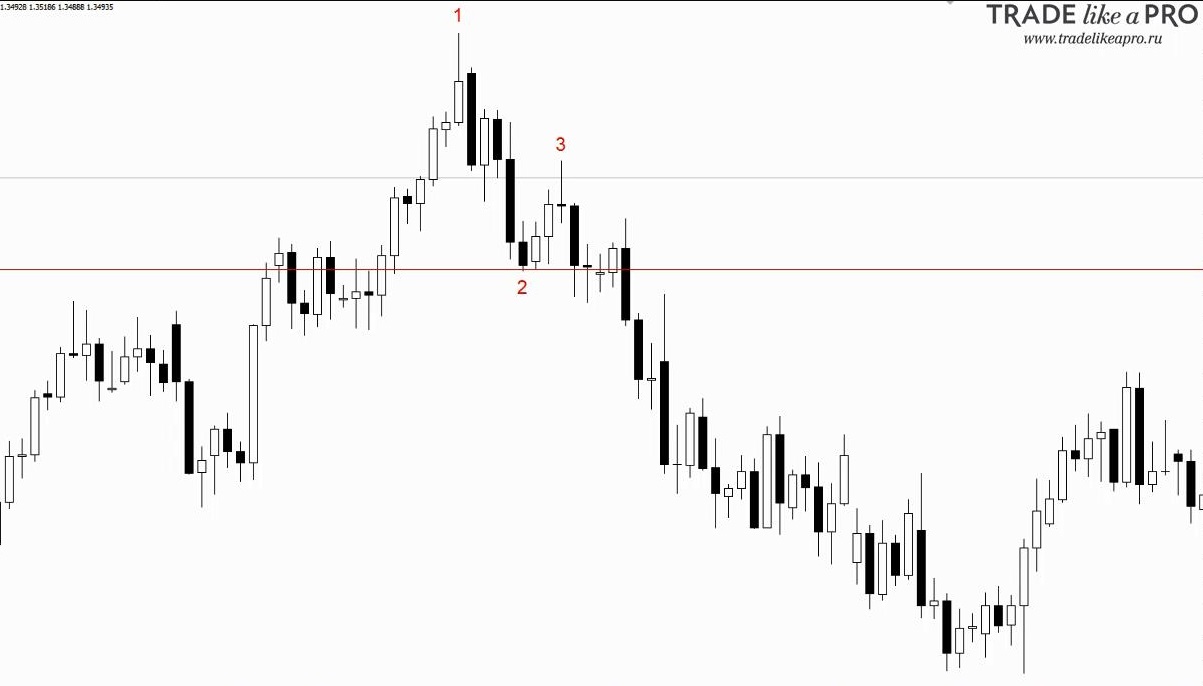
Until we have confirmation, until we have a break through line 2, that is, in this case, a break of the last local low, we do not enter sells. We do not enter before point 2. We always wait for confirmation. We always wait for the break of point 2.
Next. The larger the size of the pattern, the greater the distance from point 1 to point 2 and to point 3, the larger the movement we can later expect.
It is highly desirable that the candle marking point 1 has a tail, and the larger it is, the better. Ideally, it should be a pin bar. But if there is no tail, this is a sign that most likely the pattern will not work out. The larger the tail at point 1, that is, on the candle, the better. Naturally, it should be in the direction opposite to the one in which we are going to enter. In this case we are going to enter downward, because this is a bearish setup.
And accordingly, the tail of the point 1 candle is directed upward. This confirms for us the crowd's intention to reverse as quickly and as sharply as possible. Naturally, we are not going to sit by the monitor and wait for the price to reach point 2 and break it. We will simply place a pending order to sell or to buy. In this case, naturally, to sell.
If after the price forms at point 3, the price goes into a flat, consolidation starts jumping around and the price does not really go anywhere, then, accordingly, we do not enter the market at all. Because the market ignored the "1, 2, 3" pattern, or simply forgot about it. And accordingly, we should forget about it too.
For those who use indicators, the "1, 2, 3" pattern can be combined with overbought and oversold conditions on an oscillator. Let us take the same stochastic as an example. It is worth paying attention to point 1. If, when point 1 was forming, the oscillator was in the overbought zone, if this is a bearish setup, as in our case, then this serves as confirmation for our further entry into sells.
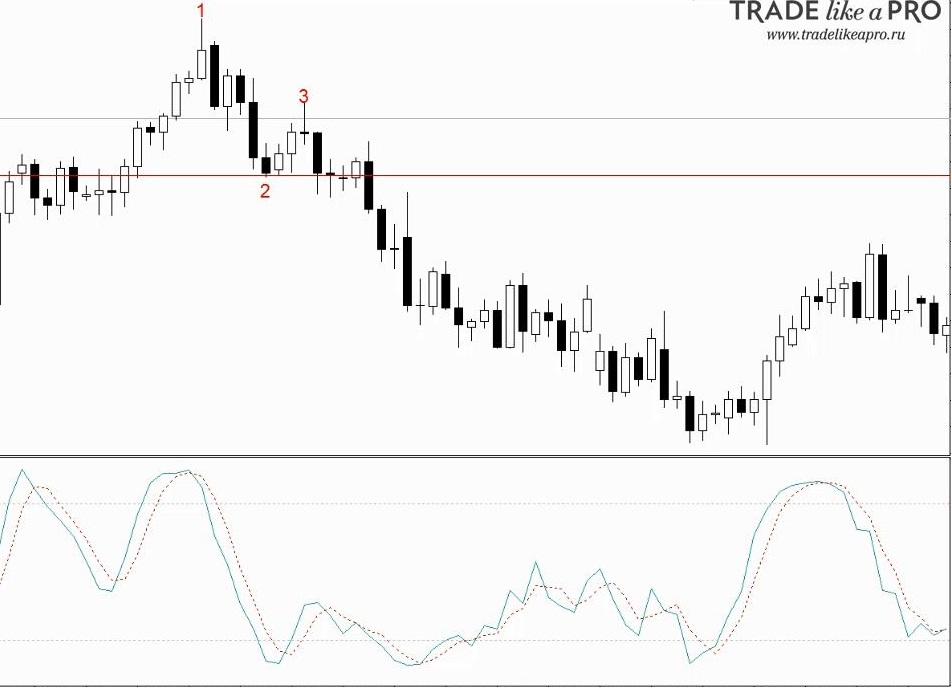
If point 1 formed and the oscillator was somewhere in the middle, then this is a sign that the pattern will most likely work out weakly, or will not work out at all. If the pattern forms the other way around, that is, if it is a bullish setup, then we watch for point 1 to coincide with the oversold zone of the oscillator. This will serve as confirmation for further buys.
For those trading intraday: we will look for setups only during the American and European sessions. If desired, you can find a "1, 2, 3" setup on almost any chart. But it must be clear, well displayed, and easy to see. Several criteria contribute to this. First, there should be at least 2 candles between points 1 and 2 and between 2 and 3.
You see, point 2 formed, then 2 candles follow and after that point 3. Point 1 comes, then 4 candles, and only after that the candle with point 2.
It happens that point 2 formed, and then the price barely moved, but it seems to have formed a new high, or a new low if this is a bullish pattern. And it seems that the "1, 2, 3" pattern has formed, but naturally, it is not worth entering it, because it is very, very weak.
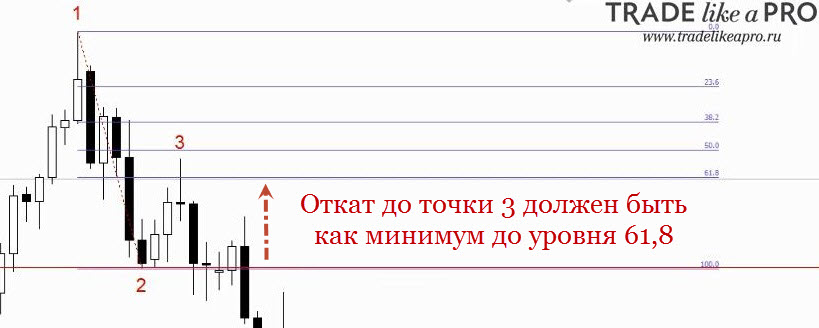
How do we determine whether the pullback before point 3 was sufficient, whether the price pulled back enough to confidently call this point 3? This is determined very simply. Between points 2 and 1, we build levels. We stretch a Fibonacci grid. And the pullback to point 3 must be at least at the 61.8 Fibonacci level. If it is somewhere farther, then even better (but not above point 1). It is always worth checking this, because this is a very important point in determining whether it is worth entering this setup or not.
If you trade, like I do, on daily timeframes, then if some gap formed at the beginning of the week, pay no attention to any patterns or setups, we trade gaps. Many people overlook this, start building some systems, looking for something. When there is a gap, we trade the gap. When there is no gap, we trade by the system we trade by.
Of course, these are far from all the nuances of evaluating and working with the forex 123 pattern. Everything else, including trade examples, can be found in the video lesson at the beginning of the article.
123 Pattern Indicator
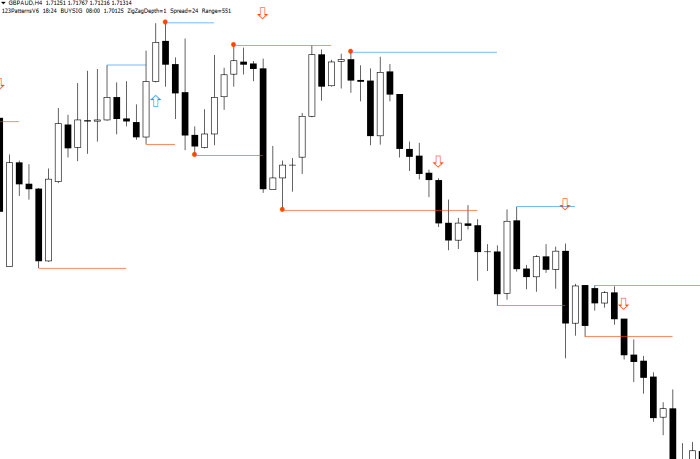
At first, it is difficult for beginners to identify the 123 pattern on a chart "by eye." Therefore, a special indicator for Metatrader 4, which automatically identifies 123 setups, may be useful to them. But it is worth understanding that this is a machine, and you will still have to check any setup found by the indicator against the rules described in the video lesson at the beginning of the article. There is no other way.
P.S. The indicator for identifying the 123 pattern is installed according to the standard instructions.
Download the Indicator

Respectfully, Pavel
TradeLikeaPro.ru