
Indicators for Identifying Wolfe Waves - Are They Any Good?

In technical analysis, Wolfe Waves are a natural trading pattern characteristic of nearly any market type and condition. The pattern consists of five swings that reflect the tendency of supply and demand to reach an equilibrium state. The pattern can form in both the short term and the long term, from minute timeframes to weekly ones. Wolfe Waves help determine the moment of a reversal of the current trend, in which direction the price will move, and how long it will take to reach the intended destination.
On the web, many infobusiness sellers try to sell beginner traders indicators that help identify Wolfe Waves on the chart. But are these indicators actually useful? Or is the good old "manual" method better? The TradeLikeaPro.ru editorial team tried to figure it out.
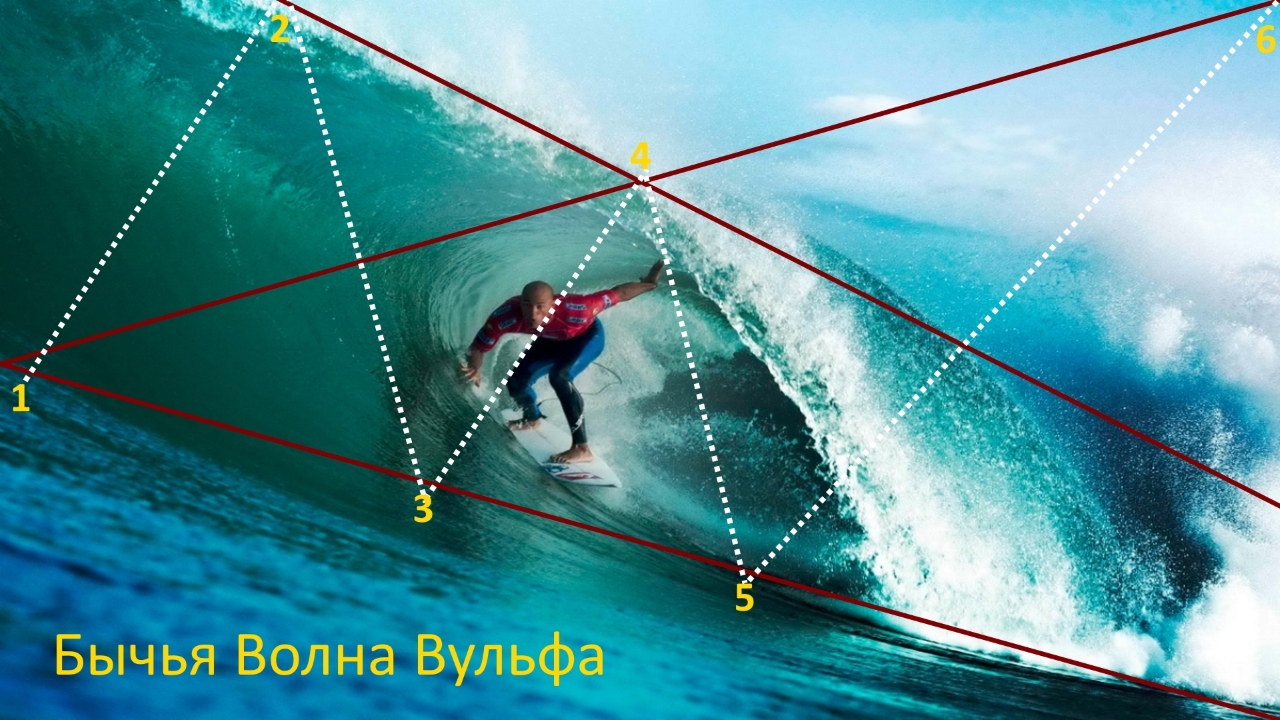
Rules for Forming a Bullish Pattern:
- Point 1 is the first of the three defining points of the pattern;
- Wave 1-2 is the basic foundation of the pattern. The whole pattern is its continuation;
- Point 2 is the first peak of the oscillating price movement. It must be above point 1;
- Point 3 is the second of the three defining points of the pattern. It is the low reached after wave 1-2. It must be below point 1 on the chart;
- Wave 3-4 is the second wave in our pattern;
- Point 4 is the high of the second wave of our pattern. It must be below the second point and above the third point;
- Point 5 is the third of the defining points of the pattern. It is the low reached after wave 3-4. It lies on the line drawn from point 1 to point 3. It must be below the third point. This is our entry point. It is upon reaching it that the pattern is considered acceptable for starting trading;
- Points 1-3-5 lie on one line;
- Point 6 is our target. It lies on the line drawn from point 1 to point 4. Upon reaching point 6, all positions are closed and the pattern is considered complete;
- Wave 5-6 is the strongest and the only tradable Wolfe wave;
- Points 1-4-6 lie on one line.
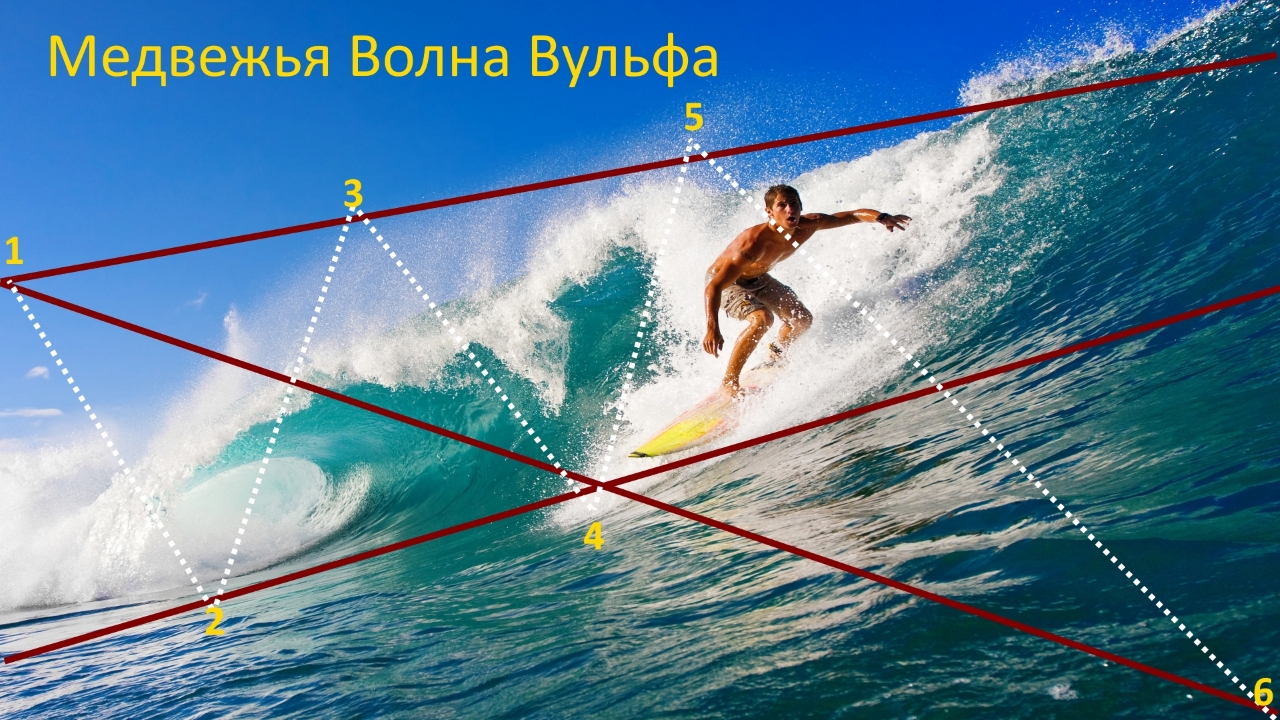
Rules for Forming a Bearish Pattern:
- Point 1 is the first of the three defining points of the pattern;
- Wave 1-2 is the basic foundation of the pattern. The whole pattern is its continuation;
- Point 2 is the first peak of the oscillating price movement. It must be below point 1;
- Point 3 is the second of the three defining points of the pattern. It is the high reached after wave 1-2. It must be above point 1 on the chart;
- Wave 3-4 is the second wave in our pattern;
- Point 4 is the low of the second wave of our pattern. It must be above the second point and below the third point;
- Point 5 is the third of the defining points of the pattern. It is the high reached after wave 3-4. It lies on the line drawn from point 1 to point 3. It must be above the third point. This is our entry point. It is upon reaching it that the pattern is considered acceptable for starting trading;
- Points 1-3-5 lie on one line;
- Point 6 is our target. It lies on the line drawn from point 1 to point 4. Upon reaching point 6 all positions are closed and the pattern is considered complete;
- Wave 5-6 is the strongest and the only tradable Wolfe wave;
- Points 1-4-6 lie on one line.
To understand which automated tools traders currently use to find Wolfe Waves, let us look at three of the most popular ones.
Wolf Wave Finder Indicator

A fairly simple indicator in principle: Wolfe Waves are built from ZigZag extremes. The indicator begins construction from the first peak (or trough), after the previous wave structures have played out. Additionally, the indicator marks the key points of the pattern with numbers and draws two lines: the breakout line and the target line.
On the one hand, the idea of using ZigZag as a basis is quite reasonable, since it greatly simplifies the development process. In essence, all that remains is to determine whether the price extremes correspond to the rules for forming Wolfe Waves. Unfortunately, in practice this approach does not perform at its best. The problem is that the patterns identified by the indicator depend too heavily on the ZigZag settings. You will have to spend a long time going through parameters to make the indicator work as required.
But this is not the only problem with this indicator. The shapes produced by Wolf Wave Finder are far from the concept of Wolfe Waves. That is, on the chart we can see anything at all, just not Wolfe Waves. Specifically, the indicator does not preserve the periodicity of peaks and troughs: the waves can be located at arbitrary distances from one another. Also, the correct placement of the points relative to each other is often not observed.
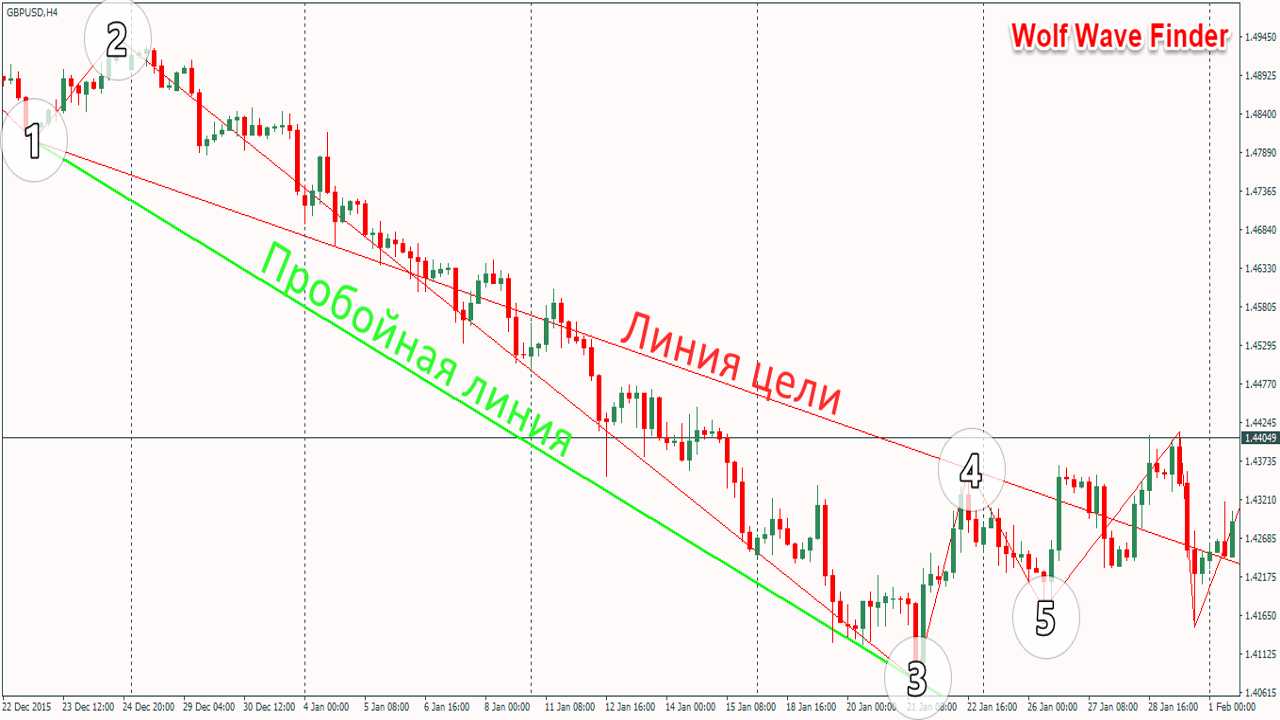
The indicator is suitable perhaps only for a schematic designation of the pattern. Although finding a real-life use for it will be difficult. Despite the fact that there is a sound idea inside it, it does not perform the assigned task. Perhaps the indicator will suit those who are just beginning to study this topic and have not yet learned to identify key price extremes on their own.
Settings
- ExtDepth is the ZigZag depth value;
- ExtDeviation is the ZigZag deviation value;
- ExtBackstep is the ZigZag Backstep value;
- ExtNumbersColor is the color of the numeric labels on the chart.
PZ Wolfe Waves Indicator

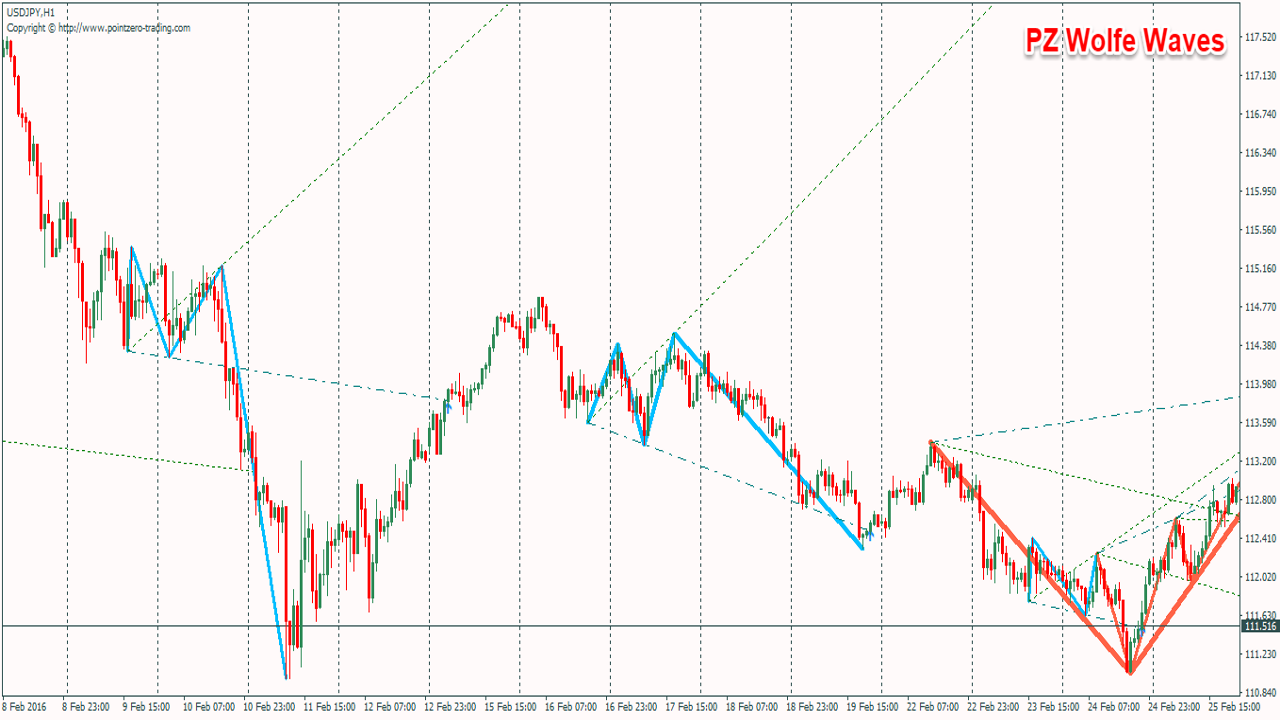
At the very first launch of the indicator, its main problem becomes clear: the indicator creates a dense curtain of multicolored lines, and Wolfe Waves fill the entire visible space. If you are lucky, from time to time you will be able to see the price chart, but most of the time it will be hidden from you.
At the same time, the visualization itself is not so bad. The pattern itself is drawn starting from the first or zero point with a thick blue line. The breakout line is drawn as dash-dot, and the target line as dotted. Before generating a signal, the indicator waits for a breakout in the direction of the wave and draws an arrow of the corresponding direction and color on the chart. Incidentally, the lines are cut off in time when they meet price, without turning the chart into an impenetrable web of rays.
When using the indicator, be sure to enable the StrictWaves parameter: this will reduce the number of false patterns. But, as can be seen in the example, the chart is still for the most part filled with unrealistic figures that have nothing in common with real Wolfe Waves. In some places point 4 goes beyond the maximum of point 2, creating targets that are impossible to reach. Properly speaking, such results should be ignored. In the end, the indicator produces something similar to Wolfe Waves, but in fact they are not.
Settings
- SmallWave - the size of the small wave;
- MediumWave - the size of the medium wave;
- BigWave - the size of the large wave;
- StrictWaves - accounts for the zero point when building the pattern (improves signal quality but reduces their number);
- MaxHistoryBars - the number of historical bars analyzed;
- DonchianFilter - accounts for Donchian channels on the breakout;
- DonchianPeriod - indicator period;
- AlertCaption - alert title;
- DisplayAlerts - enables notifications about new signals;
- EmailAlerts - email notifications;
- SoundAlerts - sound notifications;
- SoundFile - notification sound.
Wolf Waves Find Indicator
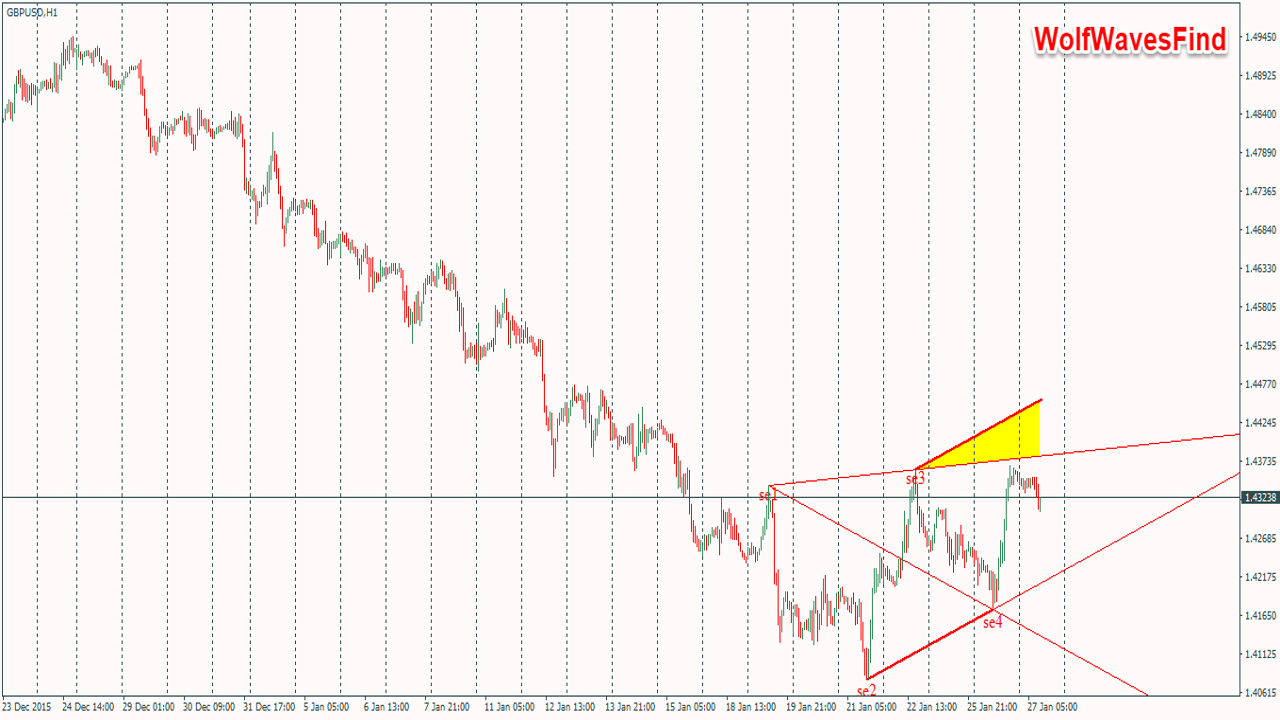
Let us move on to the most interesting indicator in the selection. The operating algorithm of this indicator makes it possible to adjust the wave size quite flexibly while preserving the proportionality of the figure, one of the pattern's most important characteristics. When the price enters the "sweet zone" (the yellow zone on the chart), a price label appears, which is a signal to open a position. The color of the label depends on the presence or absence of MACD divergence at the moment the signal appears. Red color (parameter WolfBeerColor) means there is divergence, blue means there is no divergence (WolfBullColor).
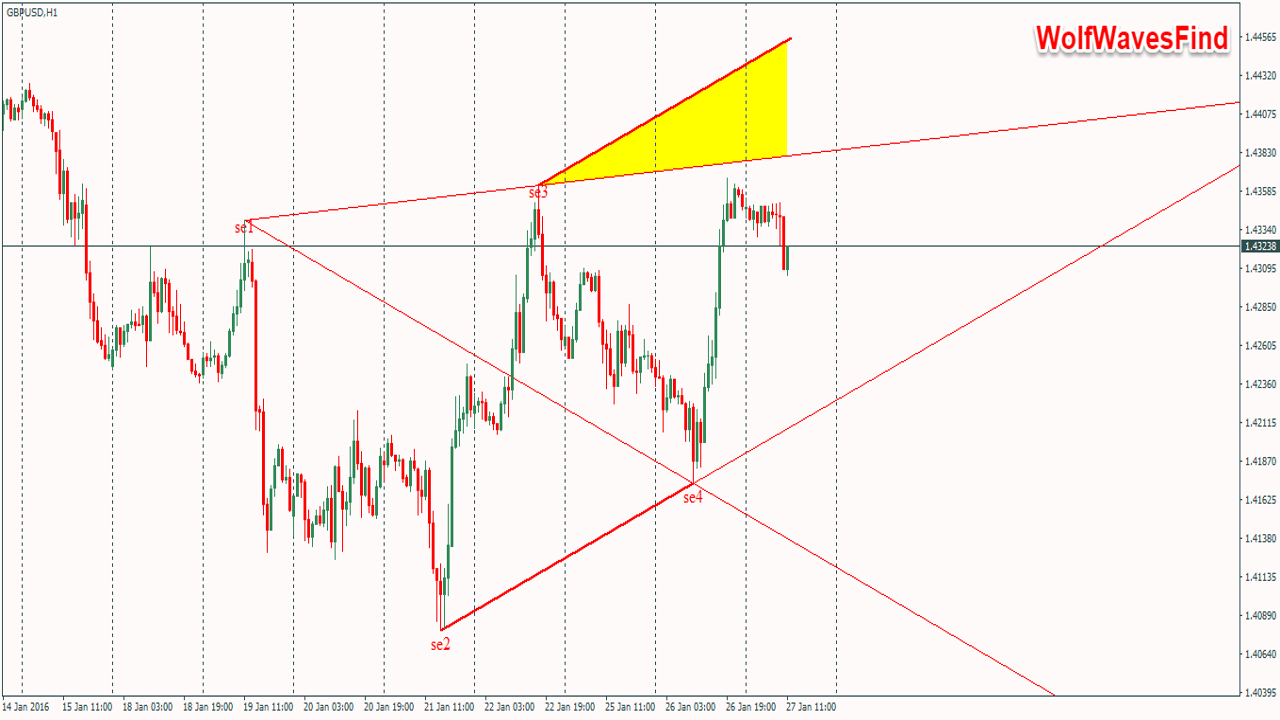
At the same time, the indicator does not take the previous trend into account, as a result of which instead of a reversal pattern we may get a continuation pattern:
It is worth noting several of the most interesting features of this indicator compared with its analogs:
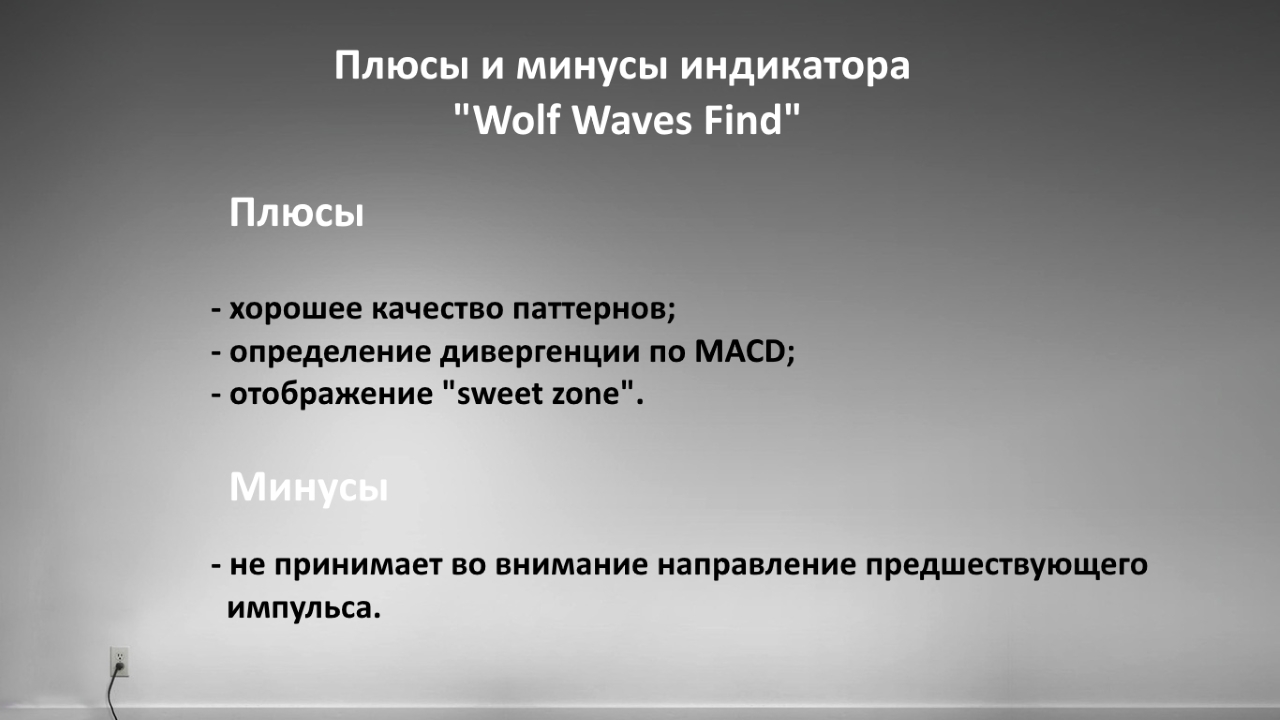
- The OpenWindows_5Point parameter, set to TRUE, brings the chart window to the foreground when an entry signal appears. This function requires permission to use DLLs ;
- The indicator analyzes MACD divergence and measures the strength of the signal depending on the presence or absence of discrepancies in the oscillator;
- The indicator displays the so-called "sweet zone" in yellow, the place where a position is entered.
It can be said that this indicator is the closest to real use cases, and it can quite reasonably be used as an auxiliary tool for chart analysis. The indicator will help find patterns hidden from the eye, even if you are a professional wave analyst.
Settings
- nPeriod - the maximum size of a peak (trough) in bars;
- FindFor - the minimum size of a peak (trough) in bars;
- Limit - the pattern search area on the chart;
- LabelPoint - label offset in points;
- LabelShow - show labels;
- OpenWindows_5Point - enables chart activation when a pattern is detected;
- OnlyDiver - allow alerts only when divergence is present;
- MACDFastEMA - fast moving average of MACD;
- MACDSlowEMA - slow moving average of MACD;
- MACDSignalSMA - signal moving average of the MACD indicator.
Conclusion

Each of these indicators solves the task of finding Wolfe Waves to some extent, but none of them solves it completely. Even if we do not take pure subjectivity into account, the appearance of the figure is still ultimately affected by a large set of factors. In the real market it is rarely possible to get an ideal figure, which is why the targets often turn out to be too optimistic. To solve this problem, traders draw additional targets by running lines through neighboring extremes or introduce trailing stops. But despite the fact that none of these indicators is intended for standalone use, in each of the developments you can find a unique idea on the basis of which you can learn to identify Wolfe Waves on your own.
Download Wolfe Wave Indicators

Sincerely, Alexey Vergunov
TradeLikeaPro.ru

In technical analysis, Wolfe Waves are a natural trading pattern characteristic of nearly any market type and condition.