
Transient Zones Strategy - Cracking the Source Code of Forex

Forget everything you knew about the market. As you get acquainted with the material below, try to switch off your internal filters and look at the market from a new point of view. Charts are not what they seem.
Hello, dear forex traders! Today we will talk about a very original trading system that deserves thorough study. It is called Transient Zones, or "Transient Zones." At its core lies an extremely powerful idea; once you understand it, you will change your views on trading forever. And although detailed entry rules are given below, the main thing is to understand the idea first, and only then can you move on.
Characteristics of the Transient Zones trading system
Platform: Metatrader 4
Currency pairs: any
Timeframe: M1 - D1
Trading time: around the clock
Recommended brokers: Alpari, Roboforex
Reference section

- How to install indicators
- Pending orders in Forex
- Inside Bar pattern
- Rails pattern
- How to trade Doji
The theory behind the system

Transient and recurrent zones
A transient zone is a zone to which price movement will not return, as determined by the variable h (the number of candles before and after the focus bar).
A recurrent zone is a zone to which price movement will return (THEY ARE NOT TRANSIENT).
Let us simplify this.
- The original definitions by the author of the trading system say that transient and recurrent prices should lie within the high and low of the price bar.
- Therefore, we must somehow separate, or filter out, transient prices from recurrent prices.
- One useful way is to look to the left and right of the bar.
- We look at the bar on the left: does it cross the High/Low level of the current bar.
- We also look at the bar on the right: does it cross the High/Low level of the current bar.
- The crossed area is called recurrent. The remaining area is called transient.
- How many bars to the left and right should be examined? Their number is equal to the value of h.
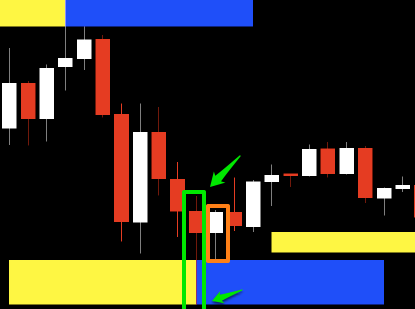
In the figure shown below, we have a central bar, also called the focus bar (in the green rectangle). We need to determine the transient and recurrent zones.
Using the rules above, we can see that to the right of the bar (h=1) we see a bar that lies within the high/low of the central bar.
The remaining area that was not involved can initially be considered transient.
Indicator
Obviously, it will be easier if you use the Transient Zones indicator. The figure shows the construction of the zone.
Take the height of the central bar and subtract from it any bar among the h bars that broke through the High/Low levels of the central bar.
The remaining zone is transient.
Candle tails
Also pay attention to the candle tail. This also indicates that in this bar the price first went lower, then higher, and closed up, indicating that the price did not remain at the bottom. Therefore, the lower prices in this bar were transient. However, from one bar you cannot tell which specific prices were transient or recurrent; to answer this question you will need to move to a lower timeframe.
The value of h
The figure shows that only 4 bars to the left of the central bar broke the levels of its high/low. On the right there were 3 bars that broke its high/low.
Thus, we could conclude that we have a transient zone consisting of more than 4 recurring prices, where 4 is the maximum number of bars that broke its high/low level.
So what does that mean?
The previous reasoning showed how a transient zone is determined on a price bar. If you determine a transient zone, then you also determine a recurring zone.
If you use the Transient_Zones indicator, then everything is quite simple. A recurring zone is any zone located outside the rectangle.
Let us simplify it even more. If you use the Transient_Zones indicator, then the rectangles outline the transient zones.
Why is this so important?
A trading opportunity is the area we marked, INTO WHICH THE PRICE IS PROBABLY NOT GOING TO RETURN within h bars.
If this is probable, then we can open a position in one of two directions:
- Trading in the direction away from the transient zone
- Trading in the direction back toward the transient zone AFTER h bars have appeared on the chart
# 1
In other words, we are betting that the price will not return to the transient zone. If we believe that the price will not return to the transient zone, then we are thereby making an assumption about the direction of price movement. "Transient" means that "there will be no return of price," and we definitely should move in the direction away from this zone.
# 2
Since the original definition by Eurusdd (the author of the method) is that a transient zone exists for a given value of h, we say that there is a time limit for the transient zone. Similar to the ticking of a clock, the price will not return to this zone within a certain time interval. If, for example, you determined that h equals 5, then you expect that the price will not return within the rectangle for at least 5 price bars. If you are working on the hourly chart, this would mean that there will be no return of price for 5 hours. What could you do if you had such information? Think about it.
Multiple timeframes
Experienced traders know this rule: higher timeframes are more powerful than shorter, lower timeframes.
Let us step aside from this discussion topic. It is well known that trends that exist on longer timeframes will always be stronger and will break (cancel) trends on shorter timeframes.
You will not be able to fight an uptrend on the weekly chart even if you open short positions several times on the 5-minute chart. There is a high probability that prices will move higher because an uptrend is present on the weekly chart. The same applies to a downtrend.
This opens a topic that can become quite complex because of the nature of time/price. What is meant is not "time or price," but the combination of price and time.
I say this because if I say that the EURUSD currency pair bottomed at 1.2495 on the weekly chart, then I must also specify the time, because the exact coordinate on the chart is (x, y), where x = price, and y = time. You cannot mention one without the other. The same is true for the 15-minute chart: if I simply say the price 1.2495, then I probably should tell you the date and time when that price was reached.
This is because time/price is fractal in its nature. This means that it can be divided into smaller parts, and these parts form values equivalent to the larger parts.
For example, 1 hour equals four 15-minute segments, which is quite logical. For charts, this would mean that 1 hourly bar would represent 4 price 15-minute bars.
This creates both opportunity and challenge to the extent that technical charts are connected with transient zones and with the value of h.
Since h is time, h represents the number of bars on the chart. But if you want to analyze where prices are transient, you will need to decide on which timeframe we will determine them.
When performing standard timeframe analysis, I strongly recommend that you identify transient zones on all timeframes.
You should always check transient zones on all timeframes in the following order. Start with the monthly timeframe and then descend: weekly, daily, 4-hour, hourly, 30-minute, 15-minute, and 5-minute.
"The day" is, in my view, the purest form of a time fractal, because 1 day can be defined as 24 hours. There are no other adjustments in this definition. Based on this definition, the largest value of a "day" can be divided into 24 hours and then the time interval can be further divided into hours and minutes (1 hour equals 60 minutes).
Thus, theoretically, one can say the following:
1 day = 24 hours
1 day = 1440 minutes
This means that on any minute chart you can use 1440 candles as a parameter equivalent to 1 candle on the daily chart.
With simple mathematical operations, other charts can also be easily represented: hourly, minute, etc.
If we needed to move from a lower to a higher timeframe, then a week should be defined as 5 days.... And speaking of the monthly chart, it does not necessarily contain 4 weeks; here you need to go by calendar months. Months contain 30-31 days, and they include holidays.
Thus, any timeframe longer than the daily one is more difficult to define into fractals.
So why is it so important to consider all timeframes?
In light of the above, the key effect of checking different timeframes is that the value of H most likely has different outcomes for the analysis.
What should the value of H be?
A frequently asked question is: "What should the value of H be?"
The answer is: "It depends on..."
It depends on your trading goals.
It depends on your trading style.
A scalper will probably choose a smaller value of h.
A position trader, or a swing trader, will probably choose a larger value of h.
Or something in between.
That is how h acts as a filter for the original thesis: prices will not return to a certain level within a given period of time.
Therefore, when applying the variable h, it is necessary to take into account the timeframe on which you are working, as well as any equivalent timeframes on which your strategy relies.
For example, traders usually prefer to look at 15M and 1H charts.
Therefore, it would make sense to use the value of H on the 15M chart in the time equivalent of 1 hour.
But what if you actually work on the 4-hour chart and want to use the hourly chart? On the hourly chart, the value of h should equal 4. On the 15M chart, that same value should equal 16.
Experiment with this and look at the results. The idea is that you should now begin to feel what the price does after transient zones appear.
Entry Rules

First of all: You need to determine the exact entry and exit algorithms yourself! Depending on your trading tactics and trading style.
Secondly: You must not enter "randomly" just because a transient zone has started to form!
So, the methodology described above can serve as one of the filters for your trading system, or as the basis for creating a new one. Using the indicator for mindless entries by arrows is unreasonable. The author of the strategy himself does not give specific parameters for entry/exit/stop-loss/take-profit. Therefore I will not either. You will have to use your own head.
Possible strategies for working with Transient Zones:
- Enter when Price Action setups form near transient zones
- Combine with the VSA methodology
- Enter on a breakout of the transient zone on a pullback to it, or with the trend (depends on your goals)
- Place pending orders above and below the transient zone
- Look for places where the transient zone coincides with support/resistance levels and trade them
- Trade the return to the transient zone, using it as a target
- Combine with another strategy of your choice, or with separate indicators
- Your option
I also suggest paying attention to a competent interpretation of the method from our forum member Mamotaro:
Conclusion

The Transient Zones forex strategy undoubtedly represents an interesting subject for study and experimentation. The main thing is to understand the idea that underlies it. And then try to combine it with your own views on the market and trading tactics. The results obtained may exceed all your expectations.
Download Indicators for the Transient Zones Trading System

Discussion on the Forum
Respectfully, Pavel Vlasov TradeLikeaPro.ru
Forget everything you knew about the market and try to look at it from a new perspective: charts are not what they seem.