
Technical analysis on cryptocurrencies for 27.10.2017
BTCUSD
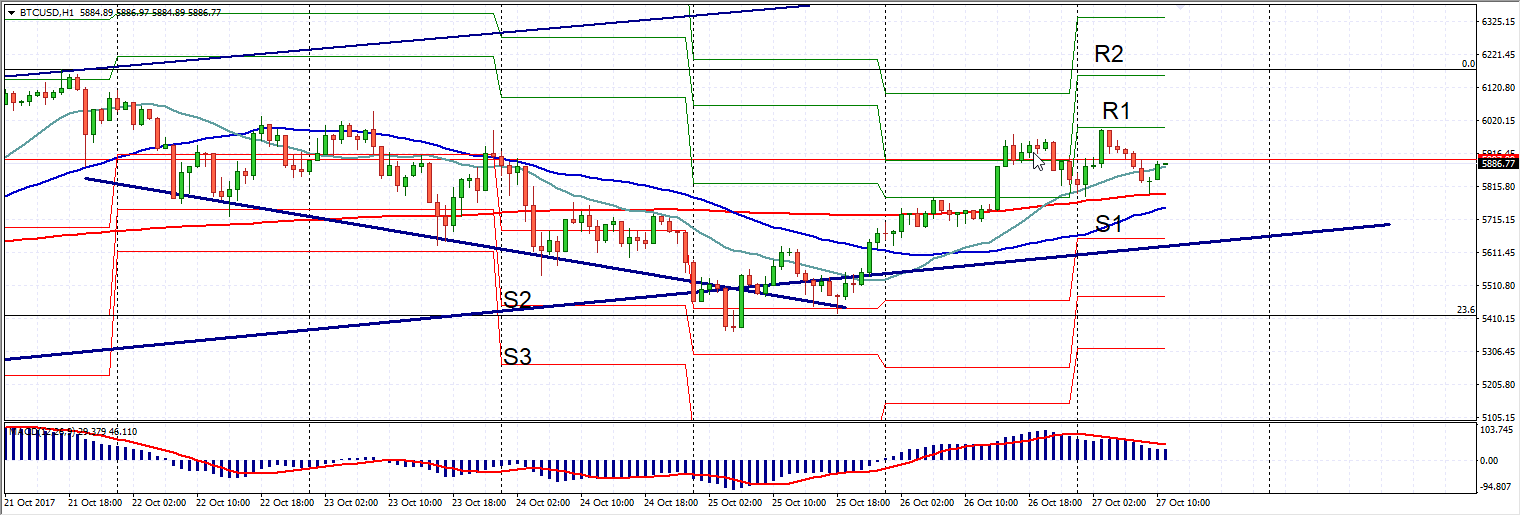
Judging by the dynamics of the last two trading sessions, bitcoin clearly does not want to accept the fate of a crypto outsider and, instead of extending the downward rally, has recovered to the levels from the beginning of the week. At the moment, BTCUSD is circling the $5851 level, clearly plotting something. The absence of sharp moves is explained by low liquidity and very modest trading volumes; however, nowhere in the world does the situation change as quickly as in the cryptocurrency market.
Analyzing the technical picture and comparing it with the situation described in the previous review, all that remains is to be glad that we never ended up in shorts. The technical picture has changed radically. Instead of leaving the ascending channel behind, the asset returned to it again, breaking away from the downtrend line. Bitcoin managed to push beneath it the entire cohort of moving averages, as they say, from the smallest (EMA25) to the greatest (EMA200). Moreover, the BTCUSD pair confidently leaned on the key market pivot point from which we project the Pivot levels and, apparently, has set its sights on another all-time high. It is too early to say that bitcoin will be able to reach the upper boundary of the ascending channel at $6400 without obstacles, but it may consolidate above the first Pivot resistance at $6050. We recommend waiting for another retest of EMA200 at $5793 and only then opening longs.
DSHUSD
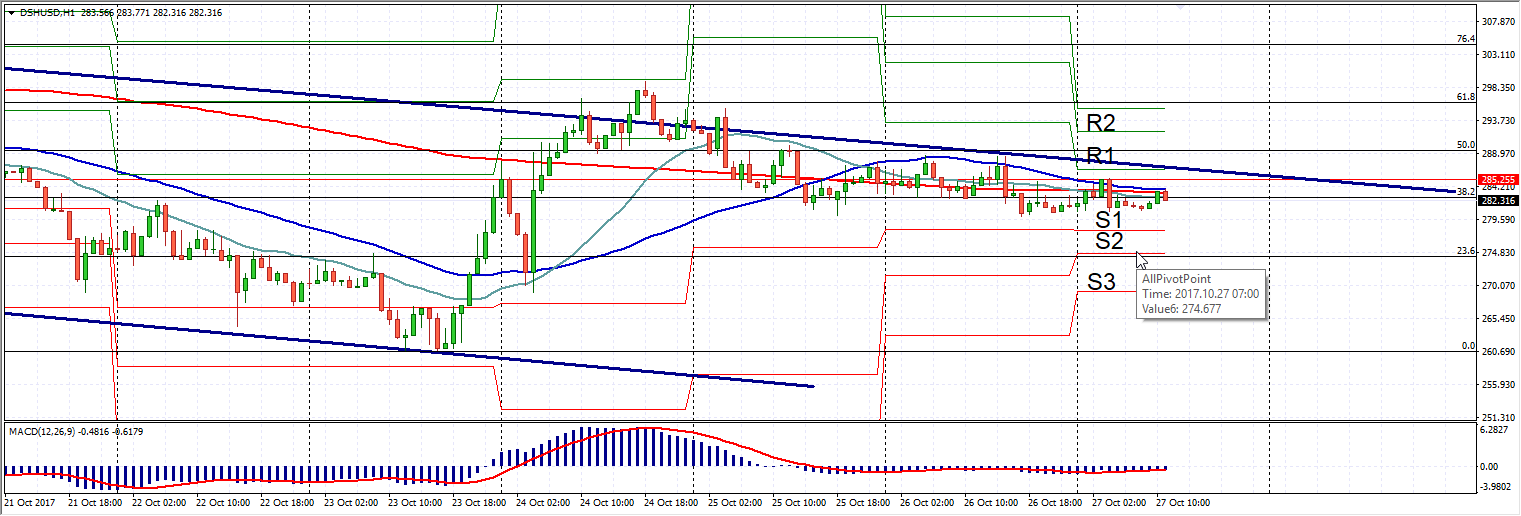
Dashcoin continues to slide along the upper boundary of the descending channel, monotonously developing corrective dynamics. Despite the fact that the asset has not suffered serious losses since the middle of the week, it is the bears who control Dash. The previously identified opportunity to sell it after consolidating below the 38.2 Fibonacci level proved justified. Over the last 20 hours, DSHUSD transformed this mark into support and resistance three times, but still could not move any farther. Trading is extremely sluggish, but, as in the case of bitcoin, volumes may appear at any moment. Dashcoin remains below the fast and long moving averages, which a priori serves as a good support for maintaining the current downward trend. There are, of course, questions about the stubborn support level at $280, and the main one is why Dash is not being allowed lower. However, I am afraid it is rhetorical. I suppose the bears need an additional technical trigger. MACD may well cope with this function, as its bars are about to cross the signal line below the zero mark. As long as Dash stays within the descending channel, one can count on testing at least the median Pivot level (S2), located at $274.6.
ETHUSD
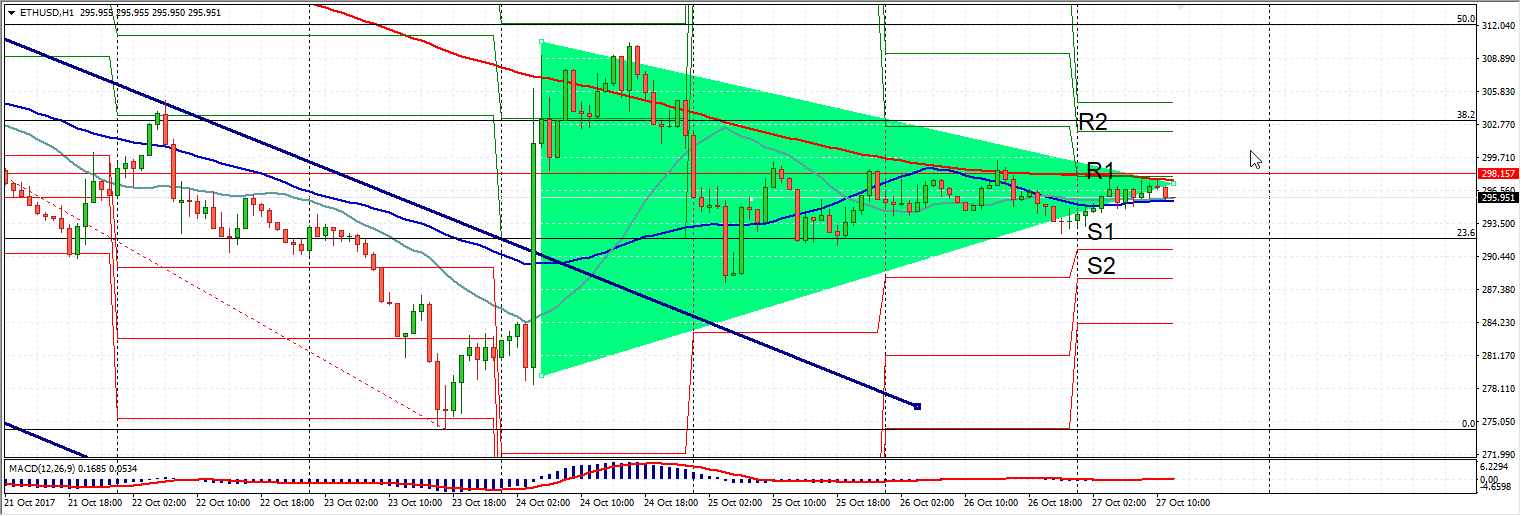
Some apathy is also characteristic of ether. Over the last two days, the asset's volatility has not even exceeded $6, which is completely uncharacteristic of one of the most dynamic representatives of the crypto industry. We still see sufficient grounds for ETHUSD to please buyers. After the powerful bullish impulse on October 24, ether entered a phase of prolonged consolidation, forming the technical pattern of a triangle. As can be seen on the chart, the culmination in the form of the price breaking out of it is already close. Given the specifics of this figure, the probability of a spike upward is high. This scenario is also supported by the pair's reluctance to return to the confines of the descending channel, the rebound from the 23.6 Fibonacci level, as well as the consolidation above the key daily Pivot. In addition, continued growth is also signaled by MACD, which managed to move into positive territory several hours ago. Given the above, we recommend looking at buys with a target at Pivot R2 302.11, near which the next Fibonacci resistance passes.
Material provided by the analytical department of AMarkets
Judging by the dynamics of the last two trading sessions, bitcoin clearly does not want to accept the fate of a crypto outsider and, instead of extending the downward rally, has recovered to the levels from the beginning of the week.