
Technical Analysis for Cryptocurrencies on 25.10.2017
BTCUSD
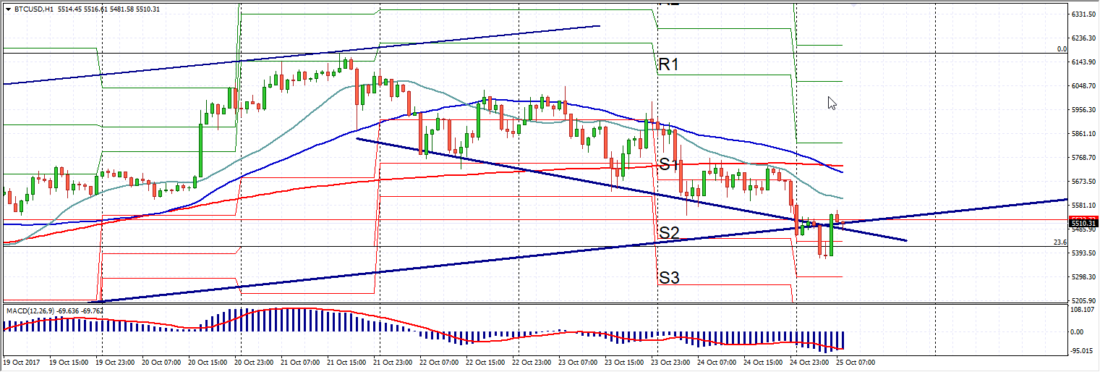
The founder of the entire crypto industry started the week on a minor note, having lost more than $370 or 6.5% of its total value by the Asian session on Wednesday. The current dynamics are clearly not in favor of traders accustomed to the enviable regularity with which bitcoin rewrites historical highs.
Meanwhile, the technical picture indicates that the bears' activity is not accidental, but quite justified. The BTCUSD pair has now been developing a local bearish rally for the 5th trading session in a row, relying on a downtrend line capable of taking the asset much lower. A few hours ago, bitcoin on elevated volumes broke through the lower boundary of the ascending channel in which it had been staying since mid-September. An even more alarming signal is the consolidation below the fast and slow moving averages, accompanied by a negative MACD drawing new highs below the zero mark. On the buyers' side there is only a rebound from the first Fibonacci level of 23.6, which, you will agree, is not much. We recommend waiting for a retest of the S2 $5450 support, projected from the daily Pivot support point, and if it consolidates below, opening short positions with the nearest target at $5250.
DSHUSD
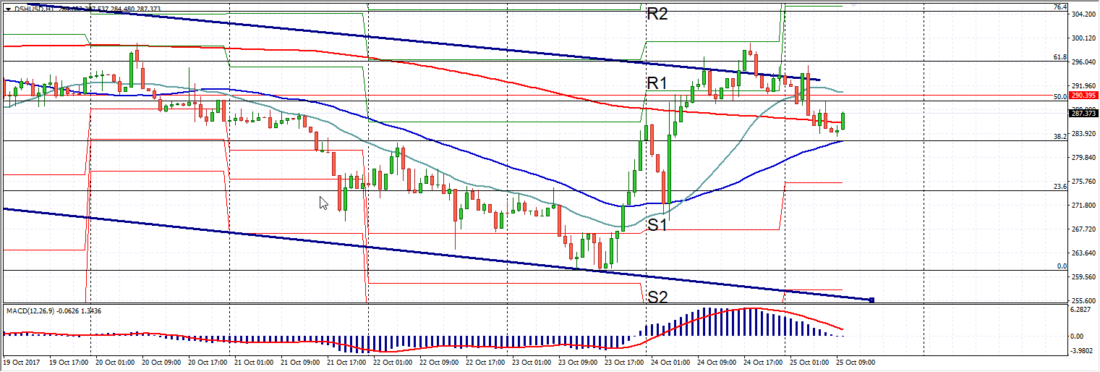
Unlike bitcoin, Dashcoin started the week in a brisk mood, recovering from $270 to $300. Because of the 10% growth demonstrated by the asset in less than two days, many lost vigilance and believed in a continuation of the rally. However, technical analysis began giving completely opposite signals in advance. Seller activity intensified as the DSHUSD pair tested the upper boundary of the descending channel developed since the beginning of October. And when just above that level a reversal candle formed with a high at 299.19, traders immediately remembered Bill Williams' classic, according to which a pin bar with angulation is almost always a signal of a trend change. After that, the market indeed moved along a bearish trajectory, picking up several more signals on the way in favor of preserving the downward rally. We are talking about the asset's return to the bounds of the descending channel, the quick break of EMA200 and EMA25, as well as the consecutive slide of MACD not only below the signal line, but also toward the zero mark. Since it is very difficult to talk about convergence in such a situation, we recommend looking at sales immediately after Dash consolidates below the Fibonacci level of 38.2. The target is the lower boundary of the descending channel at $255.
ETHUSD
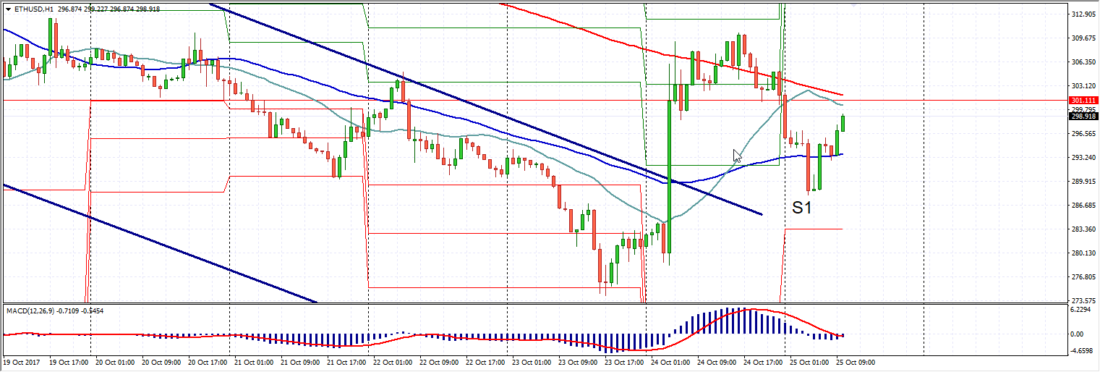
Ether clearly looks better than Dash and bitcoin. Having started the week near the $290 level, the asset is one step away from testing resistance at $300. If not for the high volumes with which buyers approached that level, one could complain about insufficient momentum for a move higher. However, the current development of the situation indicates that the round number may quickly be left behind. It is worth noting that the continuation of growth is supported by Ether's confident exit from the descending channel with one powerful bullish candle. Despite the fact that this happened back on Tuesday morning, the bears still did not seize the initiative, and ETHUSD continues to climb upward. Two hours ago, Ether seemed to lean on the fast moving average, strengthening the upward rally. It is important to note that this time the EMA25 level coincided with the daily Pivot level, indicating the preservation of the current dynamics. MACD, which has almost made it into positive territory, also speaks in favor of buying. Taking the above into account, we recommend buying Ether, but only after it consolidates above EMA200 at 301.80.
Material provided by the analytical department of AMarkets
The founder of the entire crypto industry started the week on a minor note, having lost more than $370 or 6.5% of its total value by the Asian session on Wednesday.