
Technical analysis on cryptocurrencies for 01.11.2017
BTCUSD
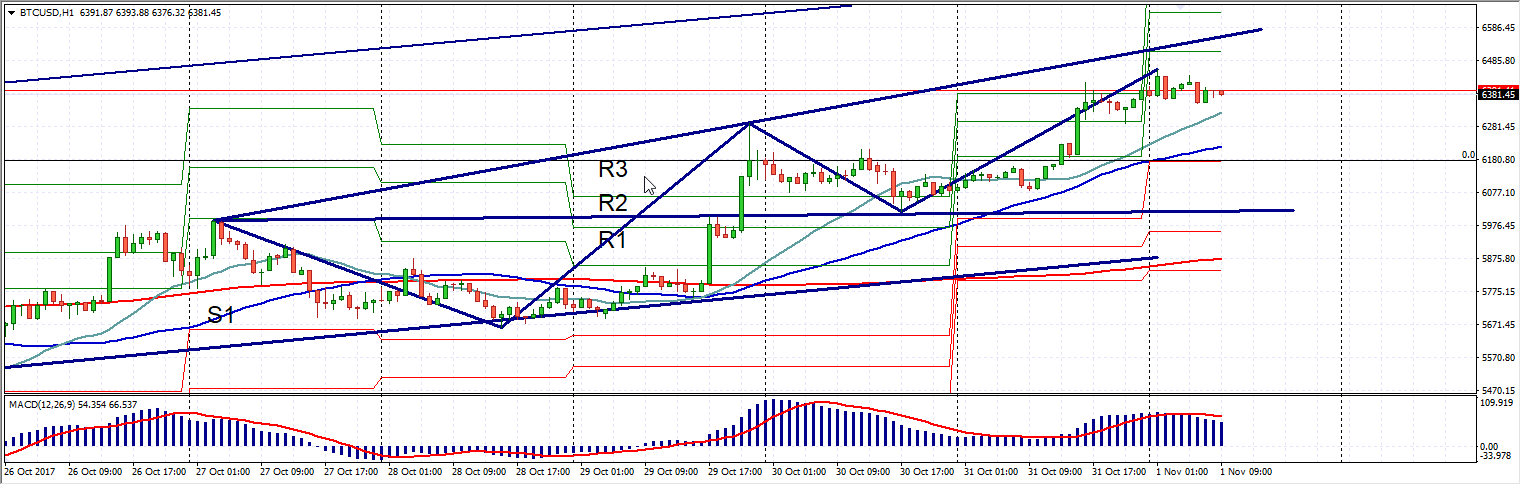
The first half of the week for bitcoin proved to be a worthy continuation of the productive weekend, as BTCUSD once again renewed its all-time high, accumulating more and more liquidity. On the one hand, increased demand is the basis for further growth; on the other, the slightest fundamental negativity and we will not avoid a correction of universal proportions.
Nevertheless, one should remain committed to technical analysis, which has repeatedly pointed to the right price landmarks. The situation is as follows: bitcoin continues to be quoted within a long-term ascending channel, while the precision with which it respects its boundaries is even frightening. Moving averages remain below, indicating continued growth. MACD has been in positive territory for the fourth day, and its bars correspond to the volume at which bitcoin renewed its all-time highs three times. However, there is also a bearish signal based on wave analysis. According to Wolfe theory, the BTCUSD pair is finishing the formation of wave 5, after which a correction is quite likely. If this scenario is realized, bitcoin will first show a new high at $6550, from where a decline to the level of $6015 is already possible. Given the strength of the signal, it should not be ignored.
DSHUSD
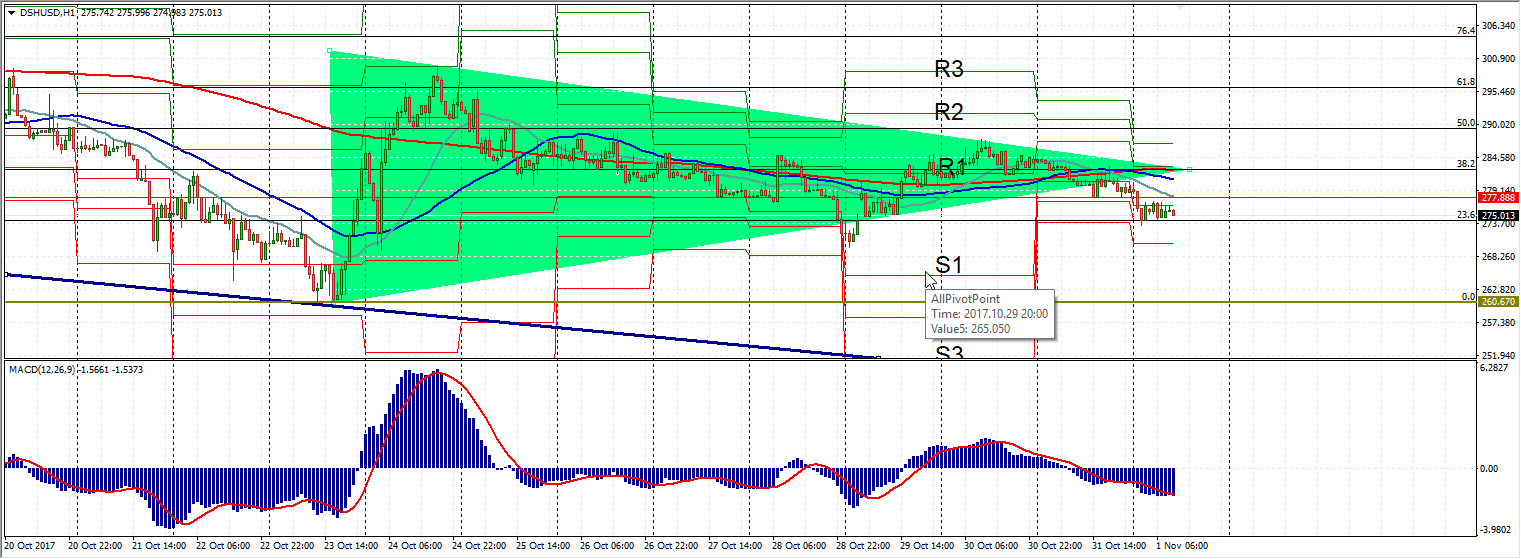
Dashcoin is interesting to sellers again. The assumption that bitcoin's growth would lead to a burst of bullish activity in altcoins was not confirmed. After reaching a local high at $287.59, dash entered a correction phase, declining for the third session in a row. Apparently, Dash is clearly unhappy with the growth in the market capitalization of the founder of the crypto industry, bitcoin. Technical analysis also continues to support sellers. Since October 23, DSHUSD had been developing a symmetrical triangle pattern, a confident breakout from which took place just a few hours ago. The completion of this formation may take the asset to the support area of $260.50. Sell priority is also due to the price settling below EMA200, EMA100, and EMA25. In addition, MACD remains in negative territory. At the current stage, DSHUSD is testing the 23.6 Fibonacci level. Considering how quickly the previous threshold at 38.2 fell, it is unlikely that the bulls will seize the initiative here either. We recommend waiting for the asset to settle below $273.00, and then taking short positions with a target of $260.
ETHUSD
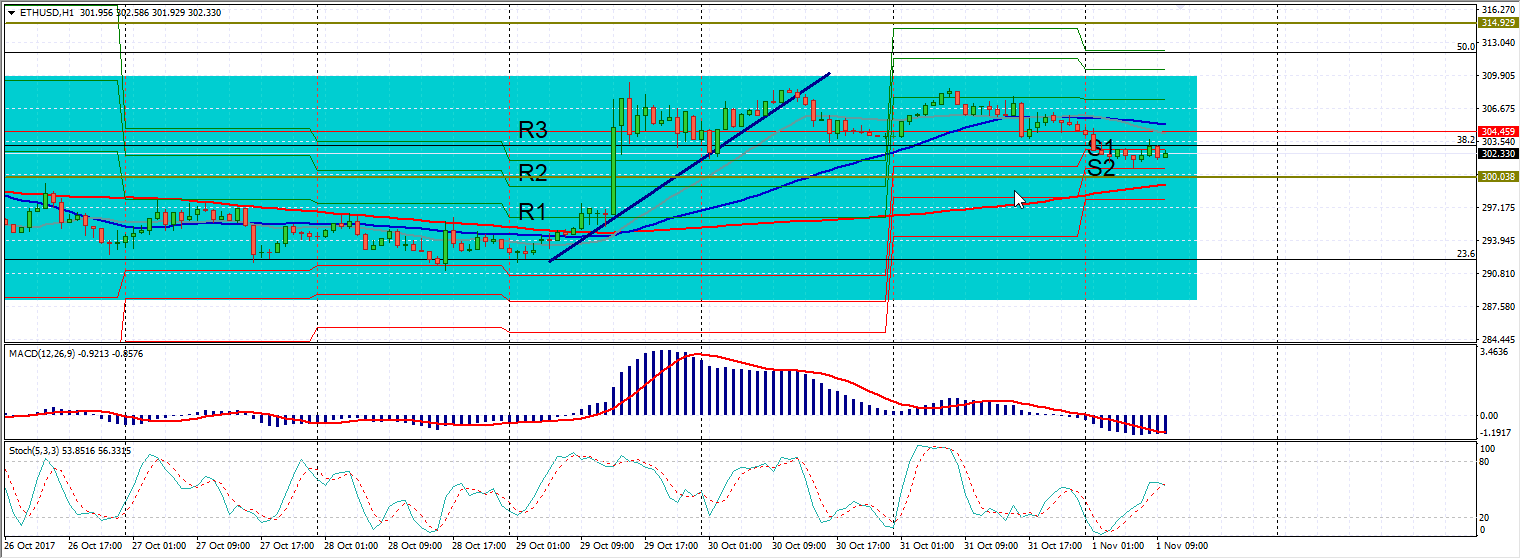
The situation for ether remains unchanged. The asset is still capable of developing bullish momentum with the potential to move above $310. The confusion traders have faced in recent days is due to contradictory technical analysis signals. Earlier, ETHUSD perfectly worked off a triangle, then developed a flag formation, but the expected breakout upward never followed. Ether continues to hold above the long moving average EMA200; however, the faster EMA100 and EMA25 are already above the price, signaling continued downward momentum. Even MACD, which remains in the negative zone, conflicts with the stochastic, which points to the asset being oversold. However, despite all this, there are still more supportive factors on the buyers' side. ETHUSD has been unable to settle below the 38.2 Fibonacci level, which has already turned prices upward on more than one occasion. Moreover, this threshold also coincides with the first Pivot support (S1), which will not be easy to overcome at current volumes. Considering the above, as long as the $300 level holds, ether is better bought.
Material provided by the analytical department of AMarkets
The first half of the week for bitcoin proved to be a worthy continuation of the productive weekend, as BTCUSD once again renewed its all-time high.