
Moving Average of Oscillator - what are the advantages of the indicator?

Moving Average of Oscillator is better known as OsMA in the package of technical analysis tools as an oscillator of moving average lines. The developers used MACD data to calculate it, graphically displaying the difference between the histogram and the signal line of the popular indicator. You will learn what came of this from our material.
Indicator characteristics
Platform: Any
Currency pairs: all instruments
Timeframe: D1
Trading time: around the clock
Recommended brokers: Alpari, Forex4You, Instaforex
In the figure, where both oscillators are combined, it can be seen that the OsMA histogram grows as the distance between the signal line and the MACD bar increases. At the point where MACD and the signal line intersect, it will be equal to zero.
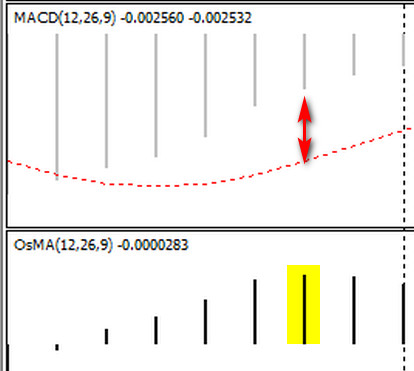
The meaning of such calculations becomes visible on the chart: OsMA turns somewhat faster than MACD, not to mention the much earlier crossing of the zero line, a classic signal for trades on all types of oscillators.
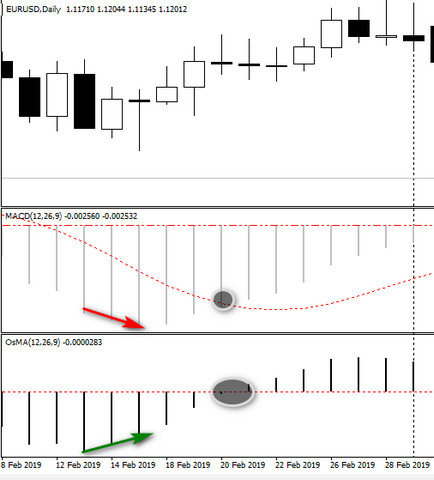
Technical analysts appreciated the idea of averaging MACD differences, including Moving Average of Oscillator in the standard package of indicators of most standard trading platforms. However, traders rarely use this derivative, preferring to include the "classic MACD" in strategies. The article will help the reader grasp the idea behind the tool's calculation and understand the advantages and disadvantages of OsMA.
Description of how the indicator works

One of the most widespread trend-following strategies to this day is considered to be the technique of entering on crossovers of the "fast" and "slow" moving average lines. This was only one trading signal until Gerald Appel created MACD, supplementing the curve signals with a histogram, the length of whose bars showed the degree of divergence between moving averages of different periods:

The maximum divergence between the curves could be interpreted as an overbought or oversold condition of the asset analyzed with two EMAs. Gerald Appel proposed identifying these zones by plotting on the MACD indicator a curve of the average values of the EMA (MACD) bars with a period of 9, the so-called signal line.
Overbought and oversold zones were determined by the positive or negative values of the bars crossing the signal line. As soon as they became smaller, the trader received an entry signal much earlier than the crossover point, which was also displayed on Appel's indicator.
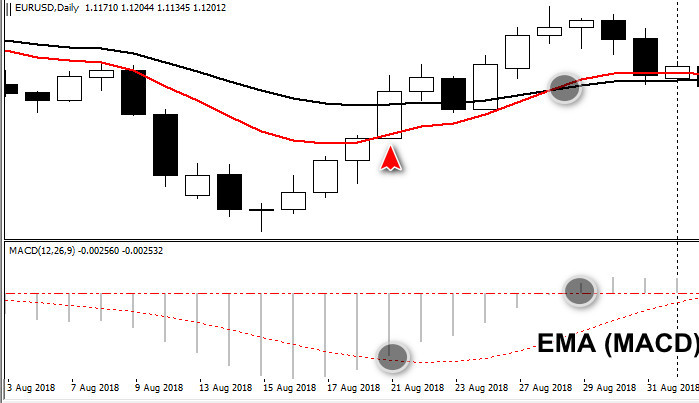
OsMA accelerates these signals by the method of finding the difference:

The picture shows that the OsMA histogram, obtained from the second derivative of the difference, more accurately displays market lows and highs one candle earlier, while preserving the entry signal in the overbought/oversold zone.
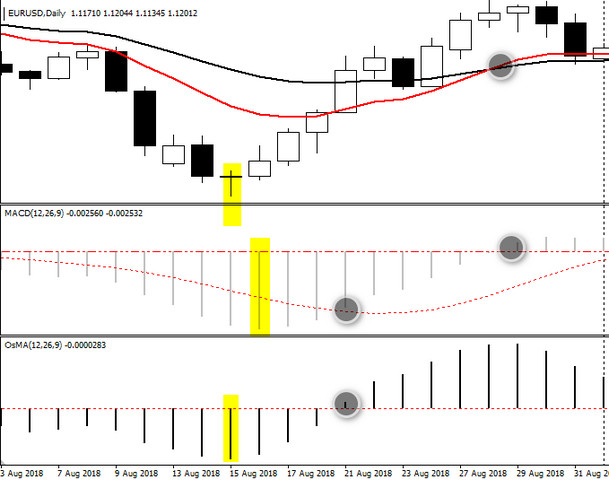
The lead gives an advantage in divergence signals and shows points for additional trades with the trend to build a pyramid.
Using the indicator in trading

OsMA is recommended for use on the daily timeframe as part of trading systems with other indicators. In the classic standalone interpretation, the oscillator gives signals:
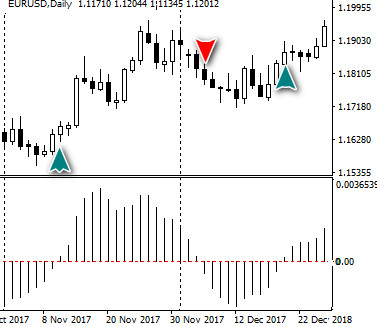
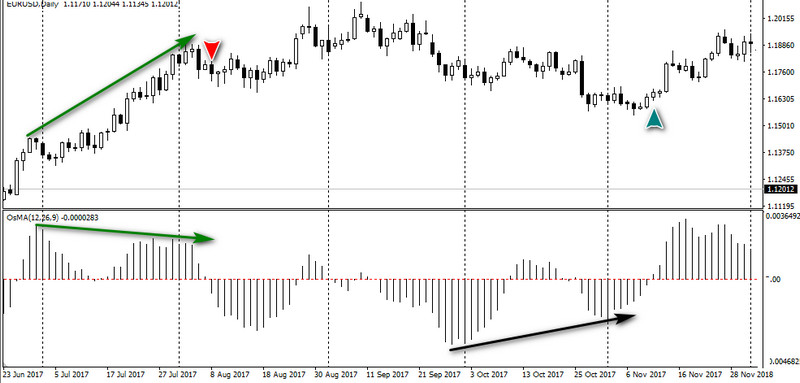
The detected divergences do not change the tactic of entering a trade; it is executed when the zero mark is crossed at the first change of the histogram value from plus to minus or from minus to plus.
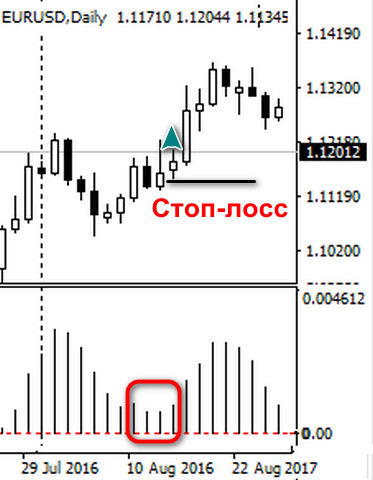
Another common option for an additional entry is provided by the situation of trend resumption. It is preceded by the successive approach of the histogram bars to the zero value, when each subsequent bar becomes shorter but does not cross the horizontal line. Instead, after reaching the minimum, the same successive increase of the histogram begins.
The entry signal is given by the second value from the minimum under the mandatory condition that the histogram readings did not change sign. This indicates the end of the correction and the preservation of the current trend direction.
Installation and description of settings

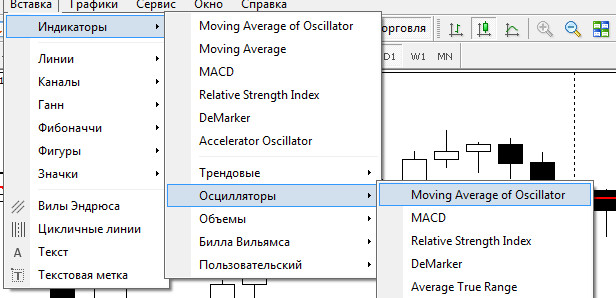
OsMA is located in the Metatrader trading platform in the "Oscillators" section, the "Indicators" option, the "Insert" menu. The program displays the full name of the tool, Moving Average of Oscillator.
The first installation on the chart will open a settings window exactly matching the MACD "Parameters" tab. This explains the default values: two EMA moving averages with periods of 12 and 26 and the averaged difference of these values with a period of 9.
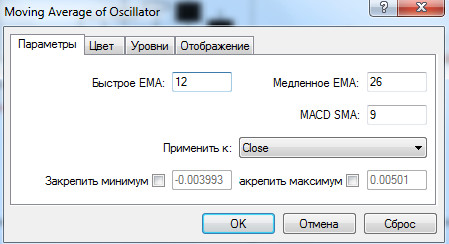
Gerald Appel selected the above values for the daily candle range; settings for a smaller timeframe can be found in trading recommendations for MACD.
Conclusion

Moving Average of Oscillator provides a leading signal relative to MACD readings, but testing did not reveal an objective advantage in the form of a higher number of profitable trades. Modifying the formula had a positive effect on identifying divergences and signals of trend continuation.
With respect, Alexey Vergunov
Tlap.io

Moving Average of Oscillator, better known as OsMA in the package of technical analysis tools, is an oscillator of moving average lines.