
LWMA: another fast moving average

Among dozens of moving averages, the linear weighted moving average (LWMA) holds a special place. Unlike its "slow" counterparts, LWMA reacts as quickly as possible to the latest price changes.
On the chart, LWMA looks modest: just a single line that slides together with price. But behind this line stands an important idea: the latest bars should influence analysis more strongly than the old ones. That is why LWMA is often perceived as "faster" and more sensitive to the current price move than a regular SMA.
LWMA does not have a single "inventor," unlike some well-known indicators. It is more accurate to speak of the evolution of technical analysis: a CFA Institute review notes that moving averages were already widely used on charts in the 1950s, and in the 1960s analysts began applying more complex mathematical versions, including weighted and exponentially weighted averages. LWMA is part of that evolution: an attempt to preserve the simplicity of the MA, while adding more response to fresh price action.
In its educational material, TradingView places LWMA in a separate class of moving averages alongside SMA, GMA, TMA, and EMA, while Investopedia explains it as an average where fresh prices receive greater weight.
In this article, we will find out how the LWMA indicator works, what the advantages of this moving average are, review strategies, and find the best implementations on TradingView.
This material is for informational purposes, cannot and should not be regarded as a consultation or advice.
What the LWMA indicator is in simple terms
LWMA (Linear Weighted Moving Average) is a moving average in which the weights are distributed linearly: the freshest price gets the highest coefficient, the previous one gets a slightly smaller one, and so on down to the oldest value in the window. For a 10-period LWMA, the classic scheme looks like this: the latest price is multiplied by 10, the previous one by 9, then by 8 and so on down to 1. This is not just smoothing, but a way to make the line more responsive to the current market.
Calculation formula:
LWMA=∑W(Pn∗W1)+(Pn−1∗W2)+(Pn−2∗W3)...
where P is the price for the period, n is the price n periods ago, and W is the weight of the periods.
Suppose the asset price fluctuates as follows:
- Day 5: $90,90
- Day 4: $90,36
- Day 3: $90,28
- Day 2: $90,83
- Day 1: $90,91
The LWMA calculation looks like this: ((90,90*5) + (90,36*4) + (90,28*3) + (90,83*2) + (90,91*1)) / (5 + 4 + 3 + 2 + 1) = 90,62
How LWMA differs from other moving averages

The key difference between all types of moving averages is the way the weights are distributed across price points.
- SMA (simple): all prices over the selected period are absolutely equal. It is like looking at the situation through a "frozen" slice of history. SMA signals are the most lagging, but also the smoothest.
- EMA (exponential): shifts the focus toward new data, but uses an exponential multiplier for this, and the weight of old data fades smoothly. It reacts faster than SMA, but may be less aggressive than LWMA.
- LWMA (linear weighted): the most "lively" of the three. The weight decreases not smoothly, but strictly linearly: the price 10 periods ago gets a weight of 1, while the latest gets a weight of 10 (with a period of 10). This makes LWMA the champion in speed of reaction to reversals, but also adds "nervousness" to it, as it generates more false signals in a sideways market.
For convenience, let us present comparative information on the main types of averages in table form:
| Column 1 | Column 2 | Column 3 | Column 4 |
|---|---|---|---|
| Characteristic | SMA | EMA | LWMA |
| Weighing principle | Equal weights | Exponential decay | Linear decrease |
| Reaction speed | Slow | Average | Fast |
| Lag | High | Average | Low |
| Noise level | Short | Average | High |
LWMA should not be considered unambiguously the best. Its high sensitivity is a double-edged sword. It is ideal for finding an entry point in a strong trend, but it can also force you to open a trade on an ordinary short-term correction.
In one of the open scripts on TradingView, the author notes that LWMA helps react faster to price changes and can be used as a guide for trend, crossover signals, and support/resistance zones.
If you look at behavior in trading, LWMA usually occupies an intermediate position: it is faster than SMA, while still remaining fairly simple and readable.
Strategies for using LWMA
Crossing of the fast and slow LWMA
The most straightforward strategy is to take two LWMAs: a slow one (for example, 10) and a fast one (for example, 20).
When the fast average crosses the slow one from bottom to top, this can be a buy signal; when it crosses from top to bottom, it can be a signal to sell or exit the position.
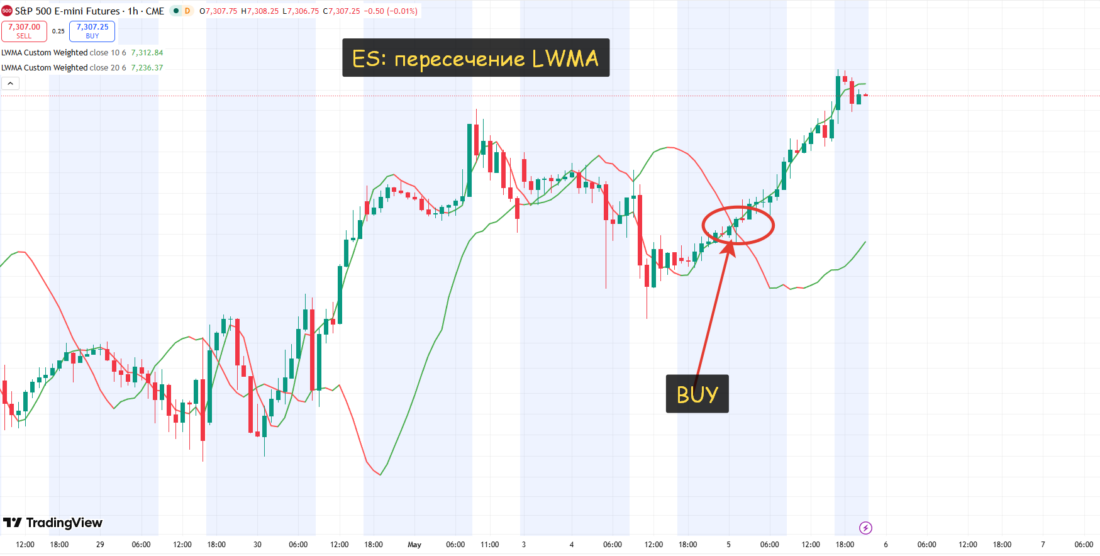
This logic works because the crossover shows a change in short-term momentum relative to the longer background.
Buying / selling a pullback from a rising / falling LWMA
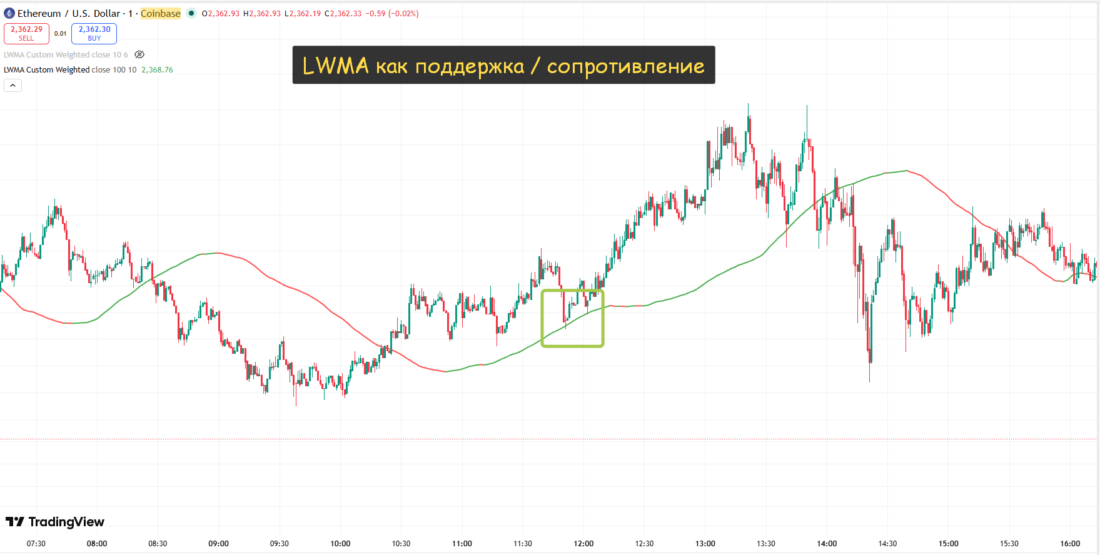
In a trend, LWMA is used as dynamic support or resistance (lookback 100).
In an upward move, the idea is simple: price pulls back to a rising LWMA, then turns up again - this is a convenient point for entering with the trend. In a downtrend, the same scheme works in mirror image.
This strategy is classic for moving averages.
LWMA as a direction filter
Another practical option is to use the slope of the LWMA as a filter.
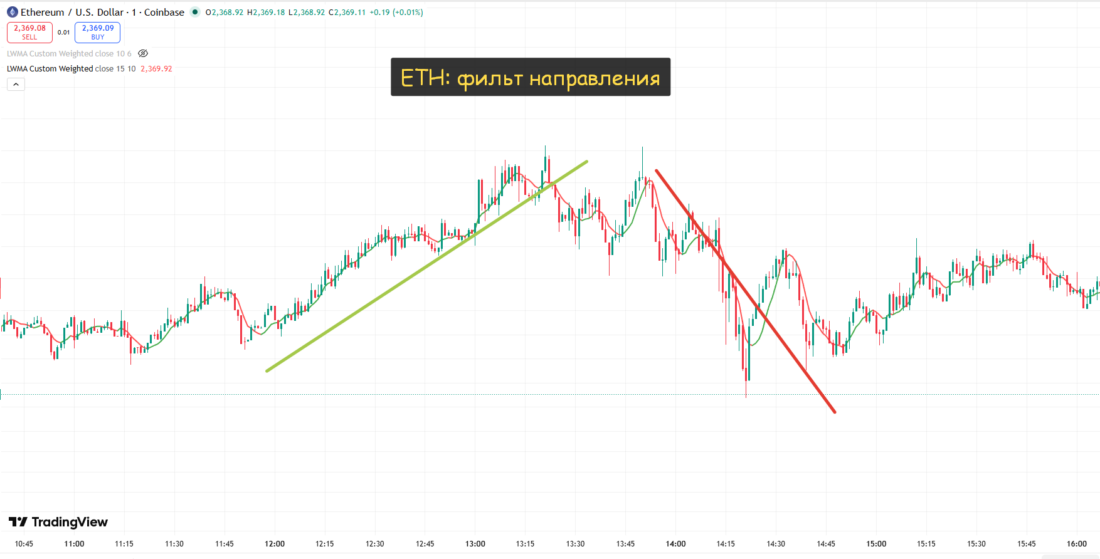
If the average is rising, look only for longs; if it is falling, look only for shorts. This is not a "signal in itself," but a way not to trade against the main move.
On TradingView, the description of an open LWMA script separately warns about false signals and advises supplementing the method with a volatility filter.
LWMA + confirmation from price
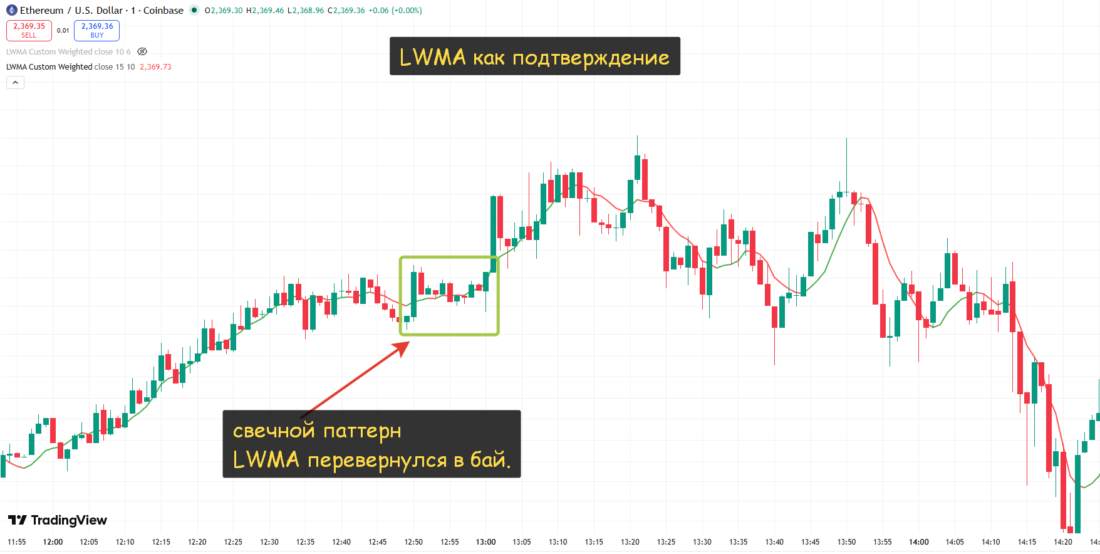
A good training scheme is to wait not only for the crossover, but also for confirmation: a candlestick pattern, a break of a local level, or a return above/below the LWMA after a pullback.
That way, LWMA becomes not a "magic line," but part of a decision-making system. This is especially useful in markets where false breakouts and quick reversals often occur.
Custom indicators with LWMA on TradingView
On the TradingView website, it was not possible to find LWMA indicators with the Editors' Pick badge.
The most popular pure script is LWMA: Linear Weighted Moving Average. The script page has been viewed 35 thousand times since 2020, which is quite a lot. The reviews are positive.
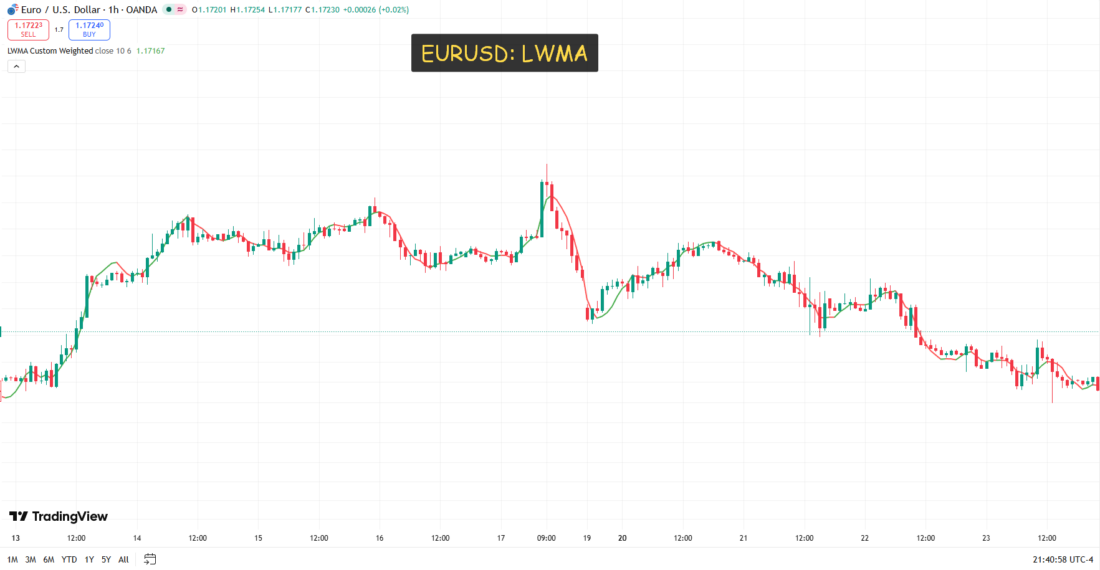
Overall, we recommend looking for scripts yourselves that include LWMA.
Separately, it is worth paying attention to the Normalized LWMA Slope script. It was released on February 16, 2022. Since its release, the page has been viewed only 3.5 thousand times.
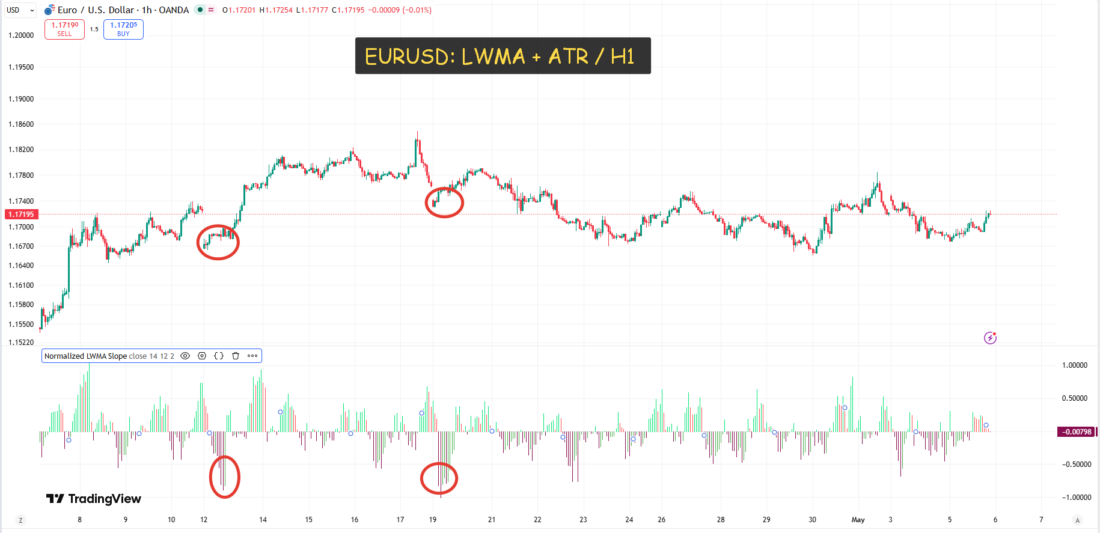
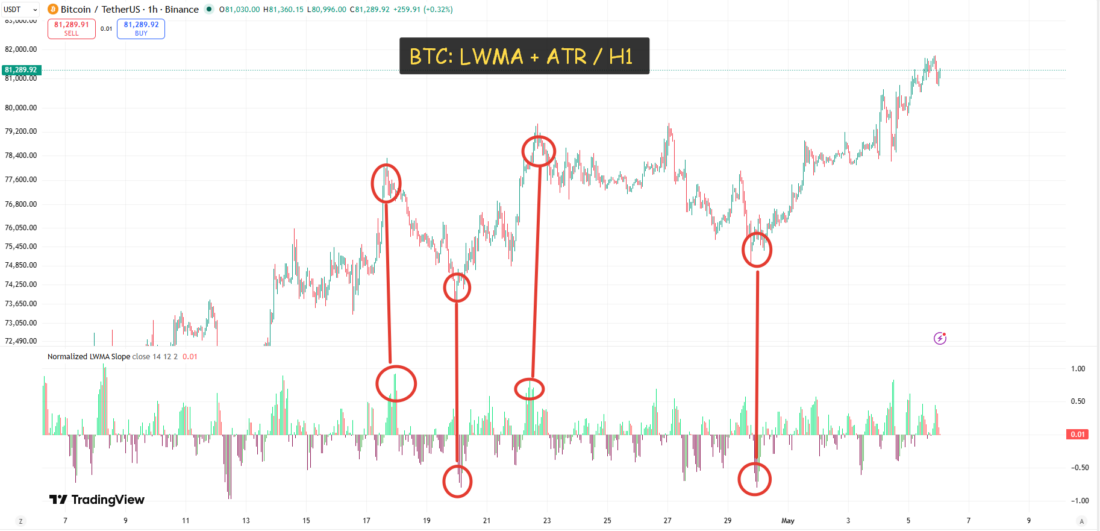
To determine the strength of momentum, you can use Normalized LWMA Slope, which divides the LWMA increase over a period by ATR (average true range). This normalizes the LWMA slope, making the signals comparable across different instruments.
When the indicator value goes beyond a certain threshold (for example, +0.5 or -0.5), this indicates the presence of a strong and sustained trend.
The synthesis of LWMA and ATR gives fairly good signals for the start of a move. Below are examples of the indicator working on EUR/USD and BTC/USDT:
Conclusion
LWMA is a good indicator for cases when a faster reaction is needed than SMA can provide, but without the overload of more complex tools. It is easy to read, clear to set up, and works well in trends: crossovers, pullbacks, and direction filtering.
At the same time, like any moving average, LWMA lags and gives false signals in a noisy market, so it is better to use it together with a trend filter, levels, or volatility.
Naturally, LWMA should not be used on its own - a combination with indicators that help filter out market noise will make it possible to improve the result substantially.