Important information for trading on daily charts
Hello, dear blog readers. I strongly advise you to take the information below seriously: if you trade on daily or 4-hour charts, it can significantly affect the success of your forex trading, regardless of your strategy.
The fact is that the time shown in the terminal differs from one forex broker to another. For charts with a period of 1 hour and below this does not matter, but daily and 4-hour charts will look different depending on the opening and closing times of the candles.
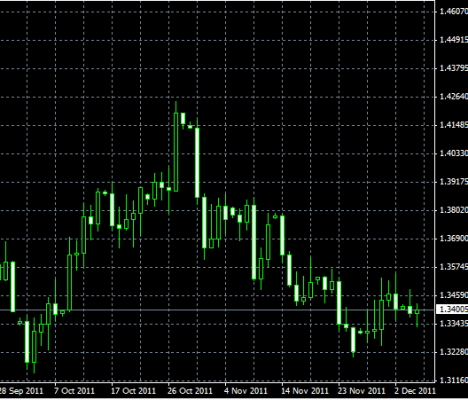
Let us look at an example: the same time period, but on charts from forex brokers with different time zones. Daily charts:
Alpari (terminal time GMT+2):
InterbankFx (terminal time GMT):
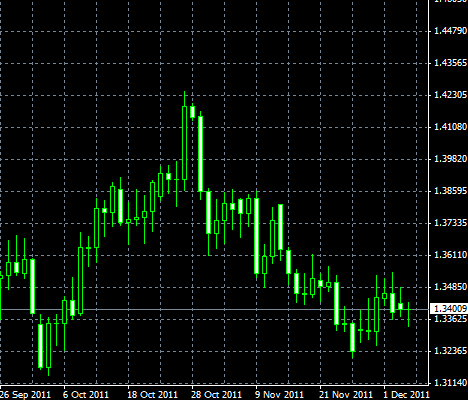
As you can see, the charts do differ, even if not very significantly. What does this lead to, and which chart times are "correct"?
The "wrong" opening and closing time of daily and 4-hour candles leads to distorted indicator readings and also worsens the interpretation of candlestick patterns and chart-analysis formations. This leads to poorly timed trade entries and exits and, consequently, poor results.
So what time should a broker use to give us the most accurate chart for analyzing daily candles? The answer is simple and, if you think about it, obvious: the closing time of the daily candle should coincide with the closing time of the New York session (2 a.m. Moscow time in winter and 1 a.m. in summer). That means we need a broker whose terminal time is GMT+2 in winter and GMT+3 in summer (do not forget that although Russia stopped changing the clocks, Europe and America still switch to winter time).
The following two brokers meet these requirements and also offer adequate trading conditions:
1. Alpari (this is where I trade myself)
2. Roboforex
In addition, some companies show 6 daily candles per week on their charts (one of the candles is Saturday). That should not happen either, so that technical-analysis signals are not distorted.
Kak vy vidite, grafiki ne stol znachitelno, no razlichayutsya. K chemu eto privodit i grafiki s kakim vremenem “pravilnye” ?
“Nepravilnoe” vremya otkrytiya/zakrytiya dnevnykh (i 4-chasovykh svechey) privodit k iskazheniyu pokazaniy indikatorov, a takzhe ukhudshaet interpretatsiyu svechnykh modeley i figur graficheskogo analiza. A eto privodit k neumestnym vkhodam/vykhodam iz sdelok i, sledovatelno, plokhim rezultatam.
Tak kakim zhe dolzhno byt vremya u brokera, chtoby davat nam naibolee pravilnyy grafik dlya analiza dnevnykh svechey? Otvet prost i, esli vdumatsya, ocheviden: vremya zakrytiya dnevnoy svechi dolzhno sovpadat s vremenem zakrytiya nyu-yorkskoy sessii (2 chasa nochi po moskovskomu vremeni zimoy i chas nochi letom). T.e. nam nuzhen broker s vremenem v terminale GMT+2 v zimnee vremya i GMT+3 v letnee(ne zabyvayte, chto khotya Rossiya otkazalas ot perevoda chasov, v Evrope i Amerike perekhod na zimnee vremya po-prezhnemu osushchestvlyaetsya ).
Vysheukazannym trebovaniyam, a takzhe nalichiyu adekvatnykh torgovykh usloviy sootvetstvuyut 2 brokera:
- Alpari (zdes ya sam torguyu)
- Roboforex
Krome togo, u nekotorykh kompaniy na grafikakh prisutstvuet 6 dnevnykh svechey za nedelyu (odna iz svechey - subbota). Takogo tozhe ne dolzhny byt, chtoby, opyat zhe, ne iskazhalis signaly tekhnicheskogo analiza.