
Highest Open Lowest Open Trading System: Intraday Zen

Where the student sees three movements, the experienced master sees one. Bruce Lee Hello, ladies and gentlemen forex traders! Today we will talk about a popular strategy called Highest open Lowest open. It is based on following the natural movements of the market, which you may consider sneaky or unpredictable. Here, we will make money on those very movements. I warn you right away that in this strategy you will have to wait, you will have to maintain discipline, and inattention can be costly.
Strategy characteristics
Strategy idea

This strategy was first published on the forexfactory forum. We express our gratitude to the author of the original thread, TooSlow. Obviously, the thread is quite popular, given the 519 pages of discussions, which means the strategy is of interest.
So, what idea lies at the core of the strategy? If you have been following our site for a long time, then you know that I always say that a strategy should always be based on some kind of idea, that is, on what premise we formulate the rules by following which we try to extract profit from the market.
The idea in this strategy is as follows. There are two prerequisites. Firstly, within a day there are always, at first glance, chaotic zigzag price movements. Secondly, any candle, whether bearish or bullish, will have tails. Thirdly, someone needs to be cut out of the market. As we remember, there are bulls, bears and pigs, as described in many famous trading books. So, pigs usually go to slaughter.
Now, let us try to connect these premises by simply becoming familiar with the strategy, and you will understand for yourself what is what. So, here is the GBPUSD H1 chart and, first of all, in MT4 you should press the Ctrl + Y key combination to display period separators on the chart (candles marking the start of the day).
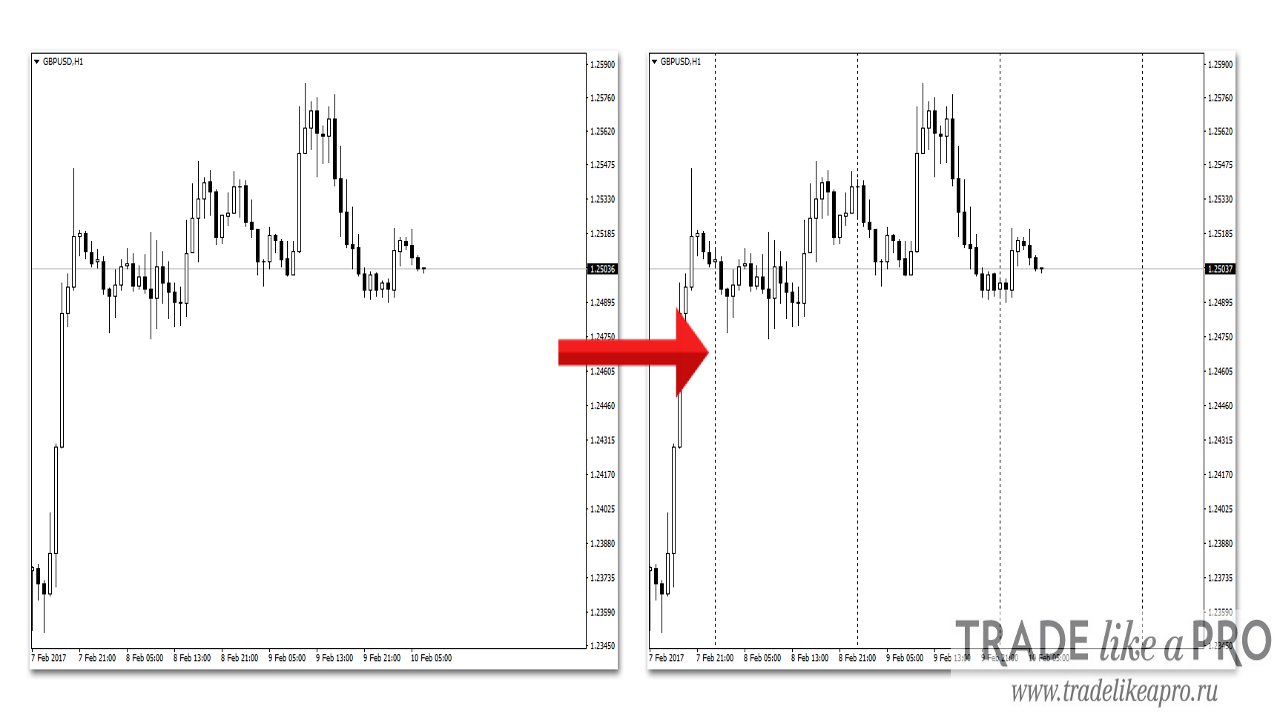
1) So, let's mark the High/Low points of the current day and the previous one on the chart.
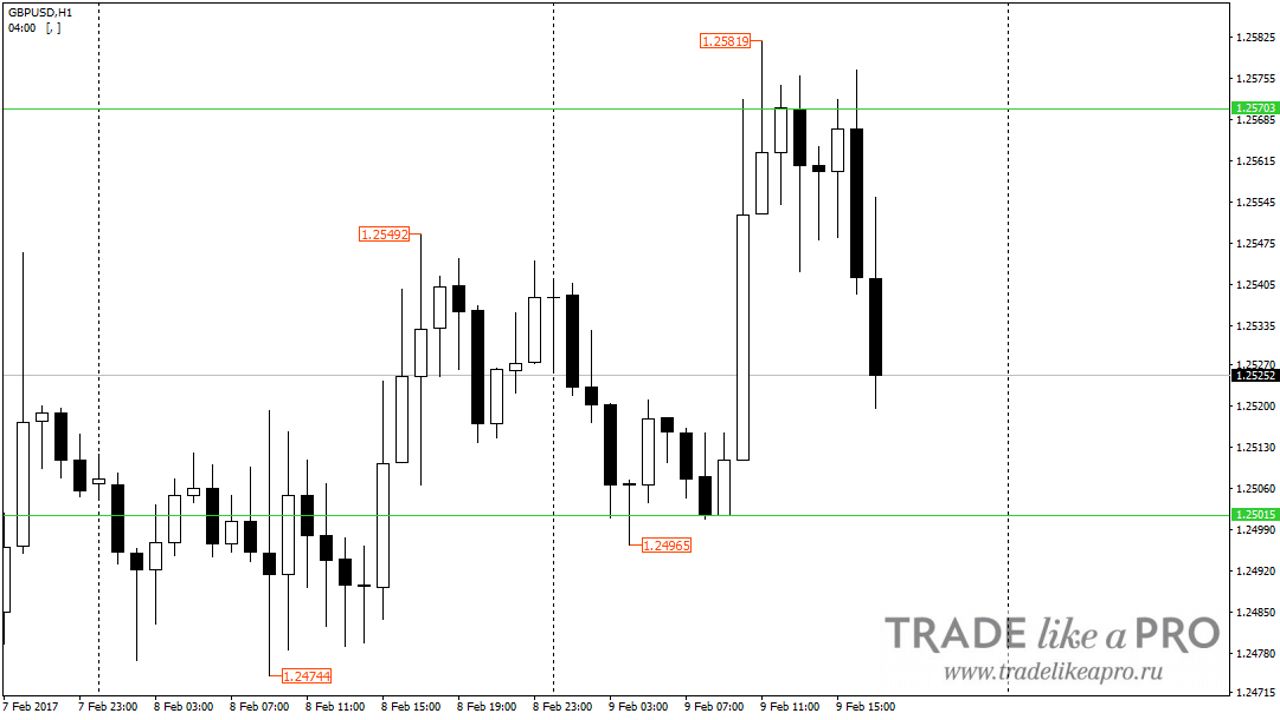
2) After this, on the current day, mark the highest and lowest opening points of the H1 candles. This means exactly the opening price of the candle, and not the high or low. The indicated opening points can and will shift throughout the day, and this is normal. Entries according to the strategy are quite short, and such a shift in markings can occur during the day. At this point (for now) our marking is complete.
Strategy rules

When will we buy or sell? So, we buy when the price moves below the lower line and returns back. That is, when the price is beyond the line (for example, beyond the lower one), we place a Buy Stop order on the line to enter on its breakout. We enter a sell position by the same principle: the price moves beyond the upper line, and we place an order on the boundary, inside the channel. It is not necessary to use a pending order for this; if you want, you can enter at market.
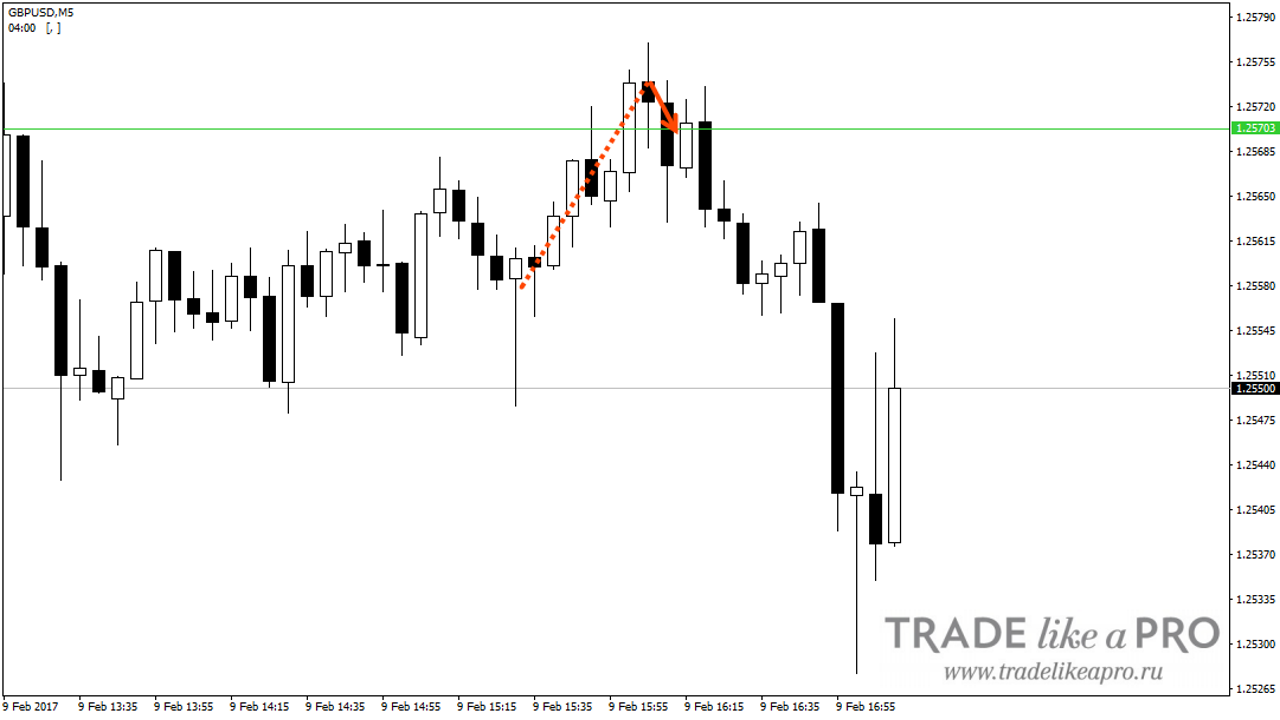
But how can you understand that the price has actually been below the lower level or above the upper level?After all, it may well be that the price breaks the level by just one point, which, naturally, will not be a signal to enter. But, precisely for this purpose, we have the concept of an "entry timeframe", which can be M5, M15 or M1. Following the original thread, the M5 timeframe seems to be the most suitable.
So, when the M5 candle closes above the signal line and, accordingly, a new M5 candle opens, we can enter a sell on reaching the level. The same is true for buying. The M5 candle should close below the signal level, and at the opening of a new candle we place a pending order. Or, we wait until the level is reached and enter at market. At the same time, the opening price should not exceed the high and low of the day!
Trading nuances, TP and SL, money management

- The start time of trading, as already mentioned, is 8 am New York time (16:00 Moscow time). This is exactly how the author trades, but you, in principle, can trade almost any time. Since everyone has different time zones, you can choose the trading time that suits you and the strategy will still work.
- We place the stop loss beyond the daily high or beyond the daily low. Stop loss is simple.
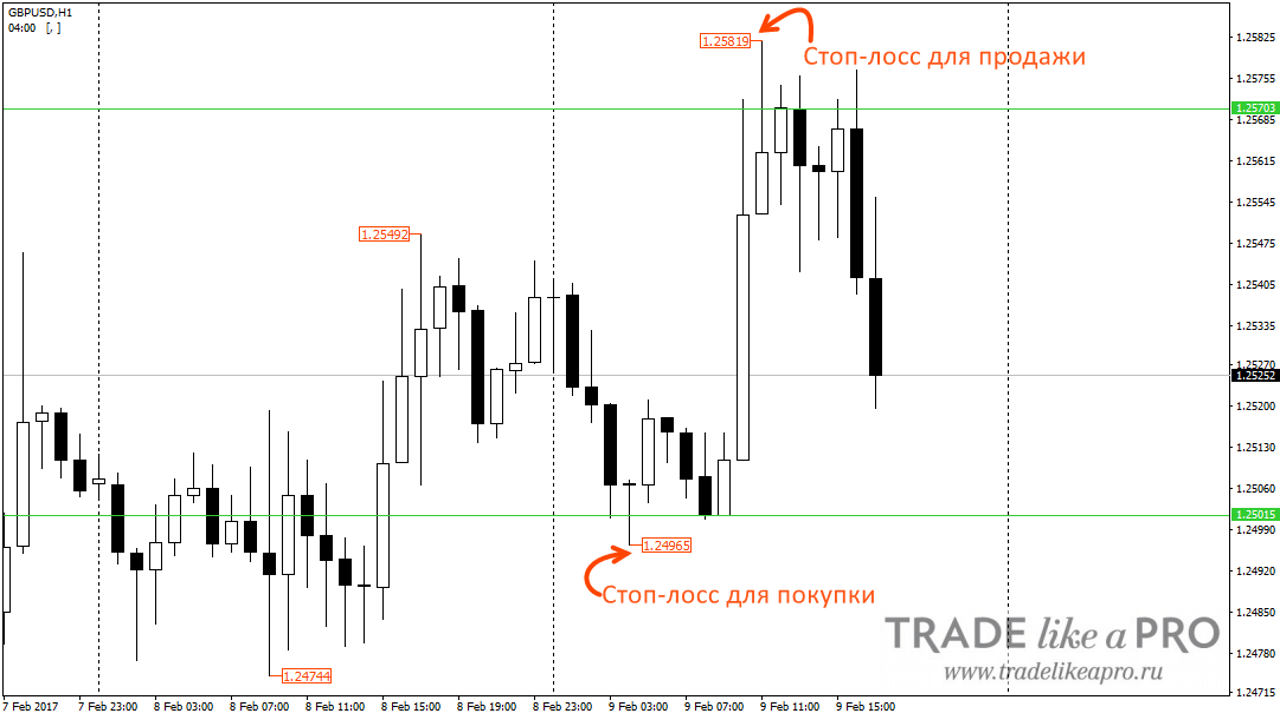
- The method of taking profit may vary. First, there is a basic rule: when a trade is in profit by +5 points, move the stop to breakeven +1 point of profit. To avoid doing this manually, you can use an automatic expert advisor from our site for breakeven management. Second, you can exit with a profit of 10 points, or when profit reaches 10 points or more, move the stop to breakeven +5 points. Also, you can exit the position in parts, which is a matter of personal preference. But it is better to follow the rule of moving the stop to breakeven. You can also apply a trailing stop.
- So, why did we mark the previous day's High-Low? If the previous day's high or low is broken, this means a breakout has occurred and you should be more careful here. It is quite possible that after the breakout the price will run far beyond the marked level.
- Also, a situation with several entries within one hour is quite possible. If the price on M5 constantly breaks the level and returns, you can enter on every suitable signal.
Since in most cases the profit is small, it is better to use pairs with low spreads in trading. This way you can move your stop to breakeven faster.
One more point. If you are going to trade market orders, keep in mind that you need to enter a buy at the Ask price. We enter a sell at the Bid price, which is what is displayed on the chart.
- There can be a lot of entries according to the strategy during the day, especially if you use several pairs. Therefore, there is no particular sense in risking more than 1% of your capital on one trade. Moreover, it is better to use 0.5%. To calculate risk, our website has a lot size calculator in the "Tools" section.
Auxiliary indicator
You can do the markings manually, or use the indicator from the original strategy thread.
On the chart the indicator displays:
- Previous day's low
- Previous day's high
- Lowest opening of the previous day
- Highest opening of the previous day
- Opening point of the current day
- Current High
- Current Low
- Also, opening levels from different TFs are shown.
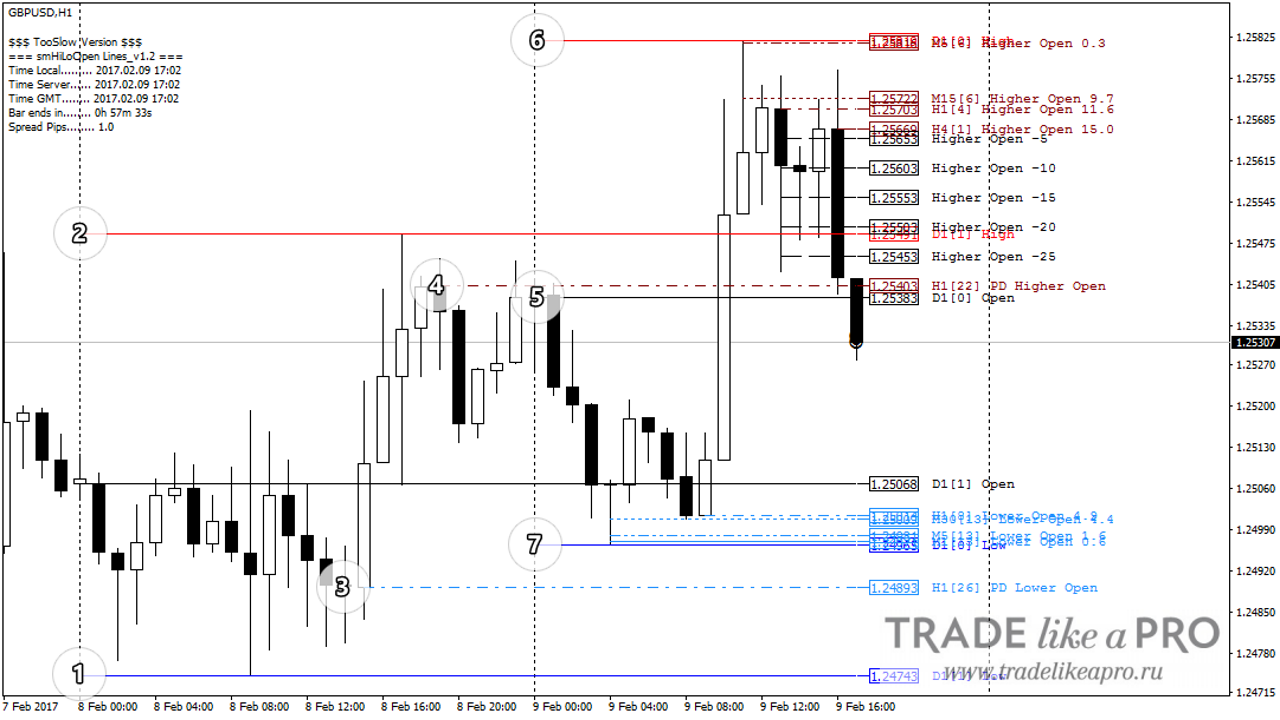
The upper left corner shows local time, server time, and GMT. It also shows the current spread and the remaining time until the bar closes. The indicator settings are intuitive, so unnecessary values can be removed.
Examples
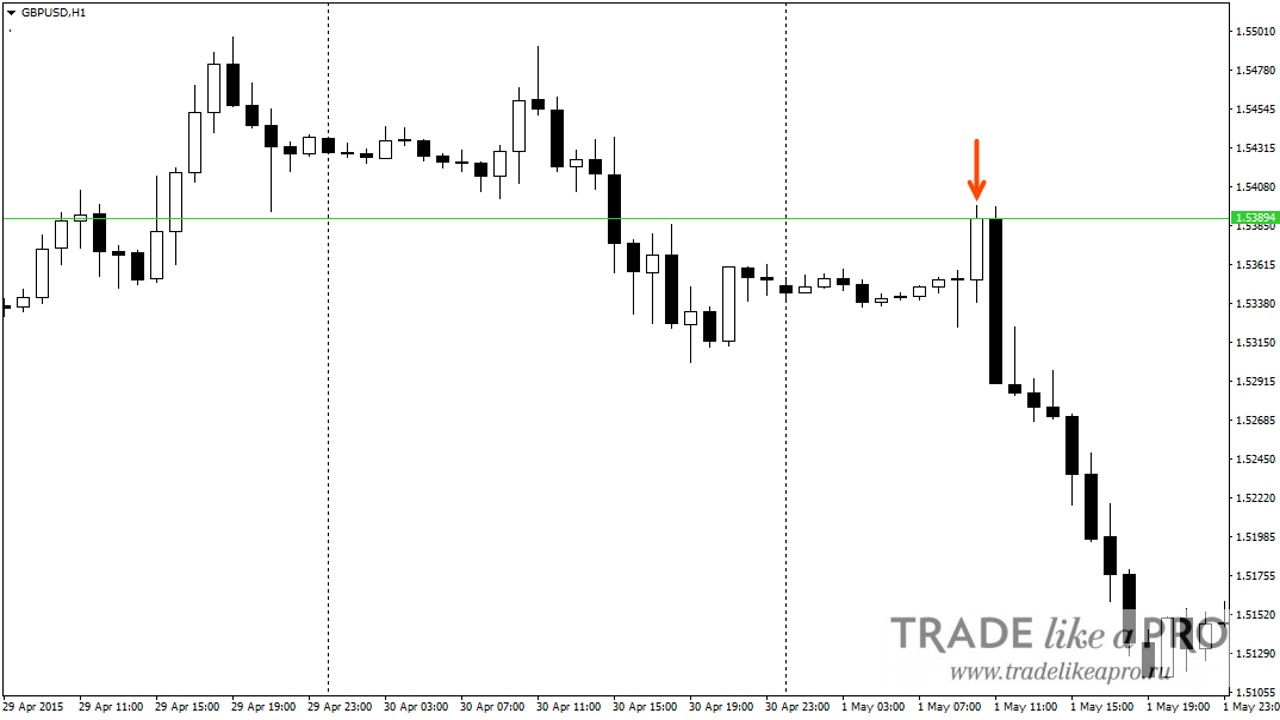
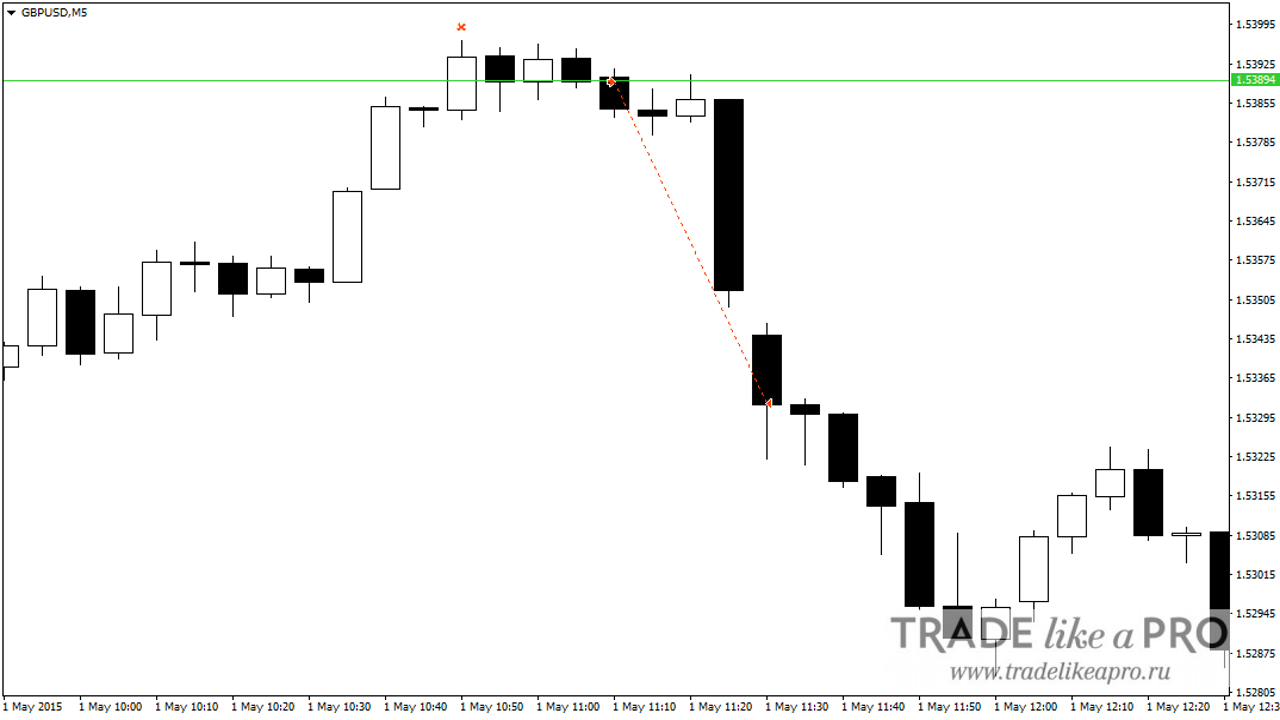
Now let us look at a few examples. On the H1 chart, we mark the highest opening point and move to the M5 chart.
Here, we see how the price closed beyond the level, below the current day's high. On the breakout of the level, we enter a sell. We place the stop-loss slightly above the day's high. Upon reaching a profit of 5 pips, we turn on the trailing stop. In this trade, we would have earned about 50 pips, with an initial stop of 10 pips.
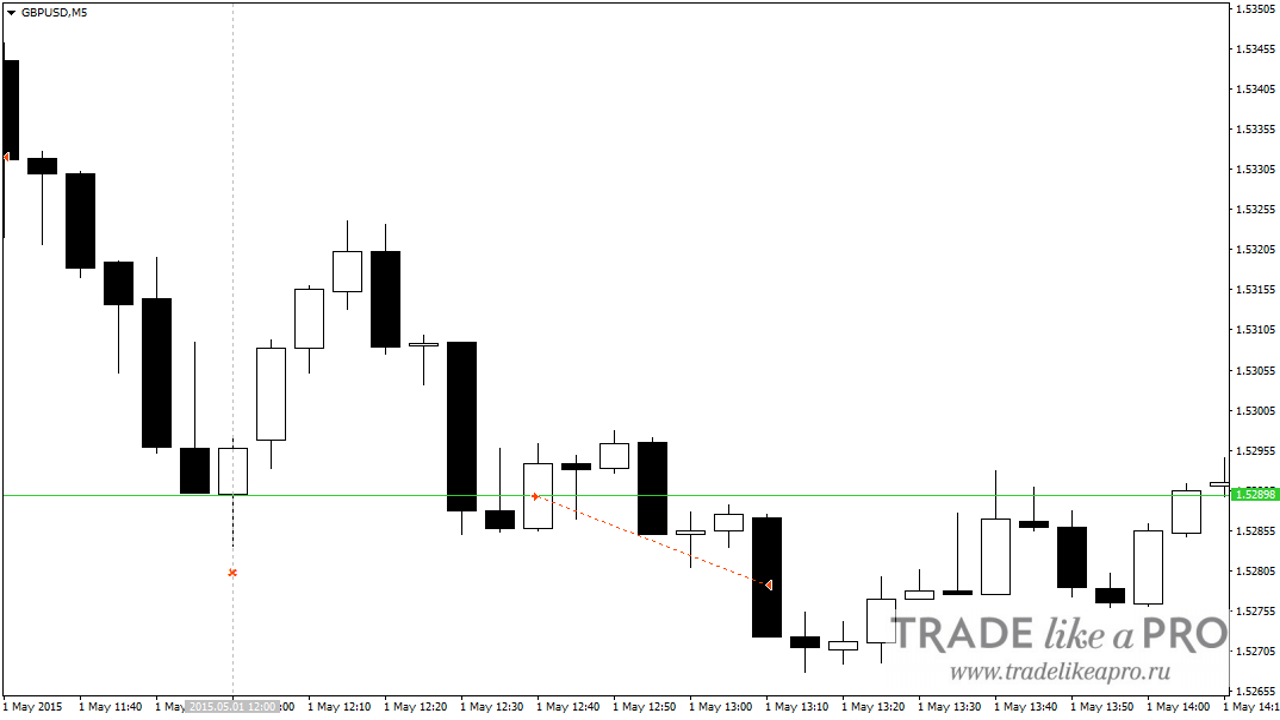
With each new candle on the H1 chart, we check whether it is time to change the markup. In this case, we have a new lowest opening of the current day, so we set the level at the opening of the new hourly candle. The low has also changed. On M5 there is a close below the level, so we enter a buy on the breakout upward. Unfortunately, the trade closed at a stop.
This is what it looks like on H1.
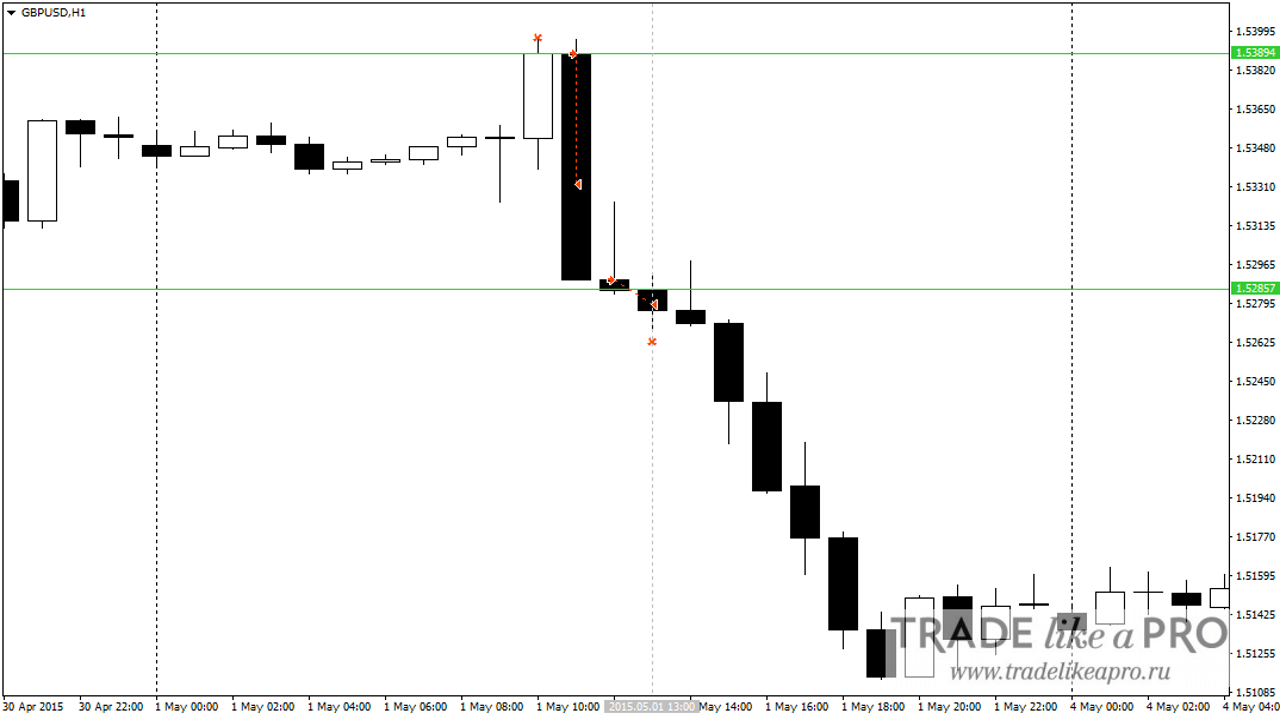
Again, we move the level to the opening of the next candle and wait for a crossing on M5. This, in fact, is what the trading process consists of.
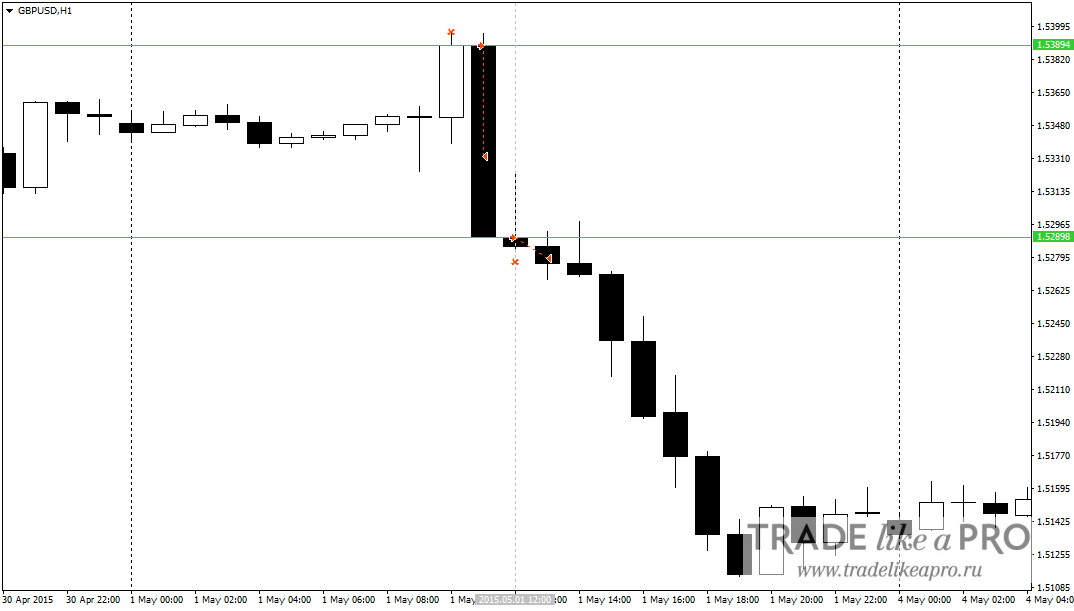
Let me emphasize once again that we are talking about the current daily highs and lows. Thus, if the highest or lowest opening price changes, we move the markup accordingly. Also, when placing a stop, we take into account the current High and Low. If the High or Low of the previous day is broken, it is worth entering with caution, since the price may well surge in the direction of the breakout.
Conclusion

This strategy requires attentiveness, the ability to wait, discipline, and cool, precise calculation. Nevertheless, it is a formidable weapon in skilled hands. The strategy's popularity on the forexfactory forum proves this. The strategy itself is quite simple.
In conclusion, I offer you a challenge that the author of the strategy also proposes. The essence of the challenge is to trade 10 trades on a demo account on one pair with a 0.01 lot fully following the rules of the strategy. Those who do this and post a report in the strategy thread on the forum will receive a special achievement badge. To get the badge, you will need to apply for the award with a link to your post. After all, this is some incentive to follow the rules ;) That's all for now, until next time!
Download the Auxiliary Indicator

Respectfully, Pavel Vlasov
TradeLikeaPro.ru

Today we will talk about the popular Highest open Lowest open strategy, built on following natural market movements and turning them into profit.