
The Hidden Power of Combining Timeframes

Hello everyone!
Today we will figure out how and, most importantly, why to combine several timeframes in trading. We will look at the classic approach and a more modern one that allows you to reduce the stop.
Why combine timeframes?

Usually, a trader works according to a strategy that is strictly tied to one timeframe. On this time interval, the trend direction is determined and the strategy's signals are searched for. Alexander Elder suggested conducting additional analysis and confirming the trend movement on two more higher-order timeframes.
This technique was first described in the book "How to Play and Win at the Exchange" and became a classic, receiving the name "Elder's Three Screens." Combining timeframes was intended to:
- Increase the percentage of profitable trades (winrate)
- Improve entry accuracy
The "Elder's Three Screens" technique is only one of the ways of combining different timeframes in the Forex market. This material compares the classic and modern approaches to working simultaneously with different chart time intervals.
Disadvantages of the "Elder's Three Screens" strategy

The classic "Elder's Three Screens" strategy is described in detail in a separate article on our website. The author's book describing the method of combining timeframes can be found in the section of recommended literature for the trader.
Alexander Elder proposed adding another chart to the "working" timeframe: a screen with a higher timeframe, in order to get the general picture of the trend and determine its direction. And to look for trade entry points on the third screen with the smallest timeframe.
Theoretically, the coincidence of the trend on the two higher timeframes increases the percentage of profitable trades. Moving the strategy algorithm to a smaller timeframe reduces the size of the stop-loss and the recorded losses.
For example, a trader analyzes the overall trend on the daily chart and determines its direction. Suppose this is the growth of a currency pair: the quotes are above the MA (200) moving average.
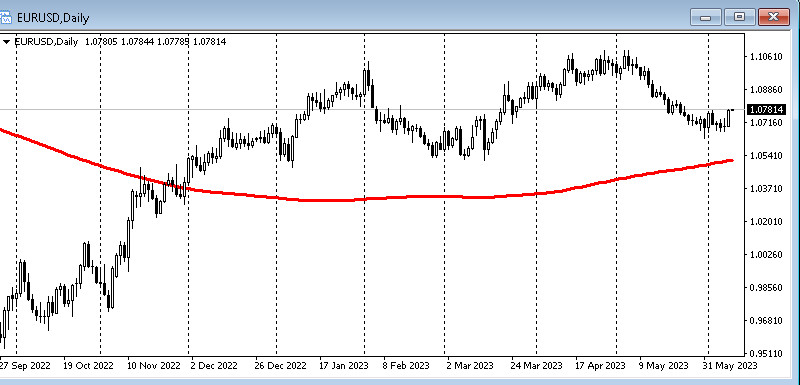
According to the rules of the strategy, one must move to the 4-hour chart and wait for confirmation of the trend on this timeframe. The quotes of the currency pair must also rise above the MA (200).
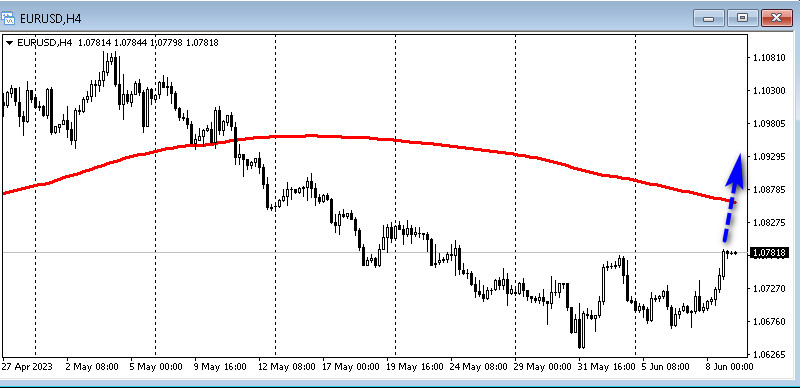
After the trends on D1 and H4 coincide, it is necessary to wait for a similar signal on M15 or M5. Then it will be possible to look for an entry point into a buy trade according to the algorithm of one's own trading strategy.
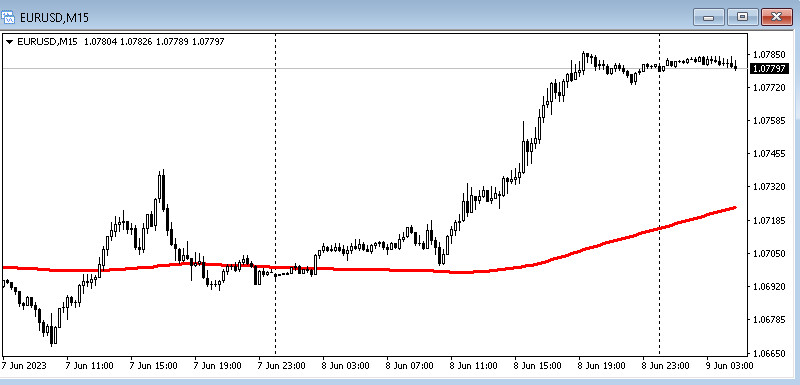
The practical results of combining timeframes according to Elder's strategy do not have significant value. Even if the overall trend on the daily chart is upward, various price movements can occur on a lower timeframe, for example on the 15-minute or 5-minute chart.
Tom Hougaard comes to the same conclusion; quite a few works by this trader have been translated on our forum. To prove it, he conducted a study of the Dow Jones index, known for its more than century-long growth.
Despite the global trend of the oldest American stock index, only 50% of the days over the last 30 years closed above the previous day's closing price. It turns out that the steadily growing Dow index has an even distribution of positive and negative days.
In the Forex market, in general, one can also expect an approximately even distribution, especially if one takes into account the range-bound nature of the currency market, that is, the accuracy of Elder's filter from higher timeframes works 50/50. Therefore, relying only on the trend of the higher timeframe is not recommended for traders who trade intraday (day traders).
However, if such signal filtering gives you psychological confidence, then this tactic can be applied. Psychology and emotional comfort are important components of trading.
How to reduce the stop-loss and increase the effectiveness of a trading system by combining timeframes
There is another approach to combining timeframes in trading that appears in the works of Tom Dante. On our forum, you can also find many useful articles by this trader.
This tactic was developed based on Dante's works and makes it possible to combine several timeframes using structural analysis of price movement. Instead of simply filtering signals, the trader looks for matching patterns on different timeframes, which may indicate more reliable trade entry points.
An increase in winrate and a reduction in stop-losses can be achieved by applying a strategy that works equally well on different time intervals. For example, Price Action is ideally suited to these requirements.
As in Elder's classic strategy, everything begins with an analysis of the overall trend on the D1 chart. Only here the trader is occupied with searching for support/resistance levels, key candlestick formations, and other Price Action signals.
In the example below, a level breakout is observed on the D1 chart. If the trader decides to open a short, then the stop-loss should be placed beyond the candle high or at the nearest resistance level from the broken line.
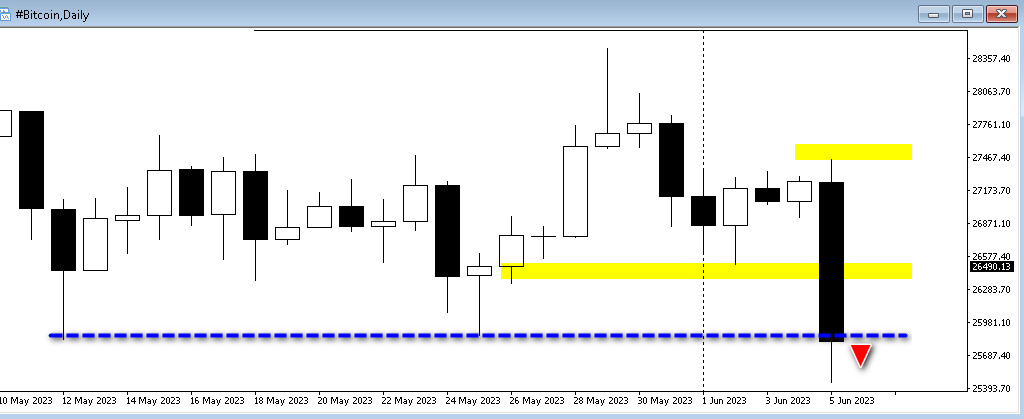
Then one can move to the 4-hour chart and search for structural support or resistance levels that can confirm the overall trend.
And on the H1 chart, one can look for confirmations to enter a trade in the form of candlestick formations or other technical indicators.
Thus, you combine information from several timeframes to determine the moment of entry into the market more accurately. It is not recommended to go below the hourly chart if D1 became the starting point for combining timeframes. The trader can also simplify the combination strategy down to two timeframes, for example, D1 and H1.
In the example under consideration, a bounce from the broken level is observed on the H1 chart, which can be used as a signal to open a short. In this case, the stop-loss will be slightly above the local maximum of the hourly candles, which is much smaller than the size of the stop-loss on D1.
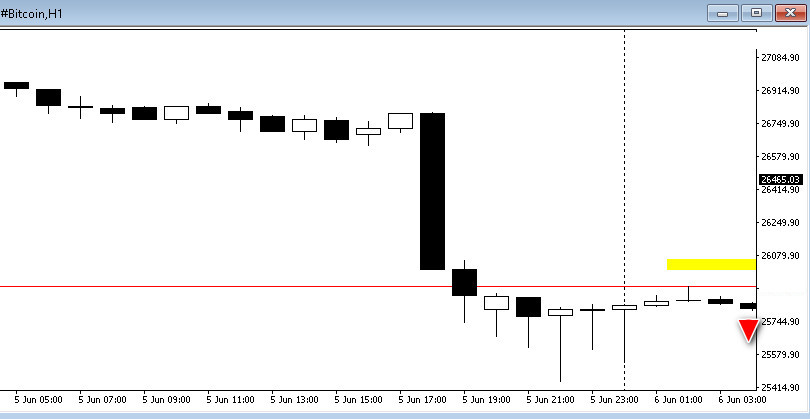
Combining the D1 timeframe with H1 objectively allows the trader to:
- Reduce the stop-loss and increase the order lot size;
- Increase profit by using a take-profit to close the position, which is set according to the D1 chart.
A stop-loss on H1 makes it possible to increase the profit/risk ratio several times when trading on D1. Without combining timeframes, risk and profit would be 1 to 1 or at least 2 to 1.
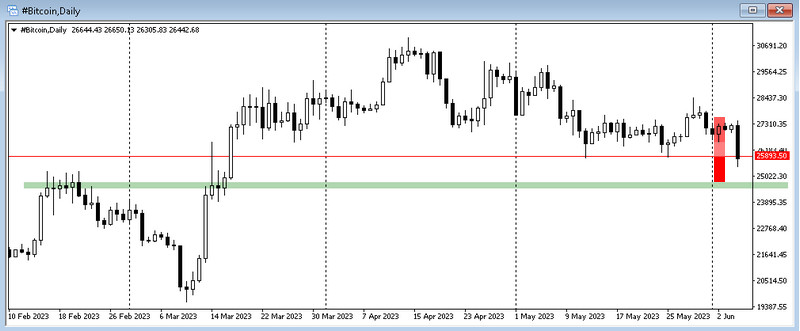
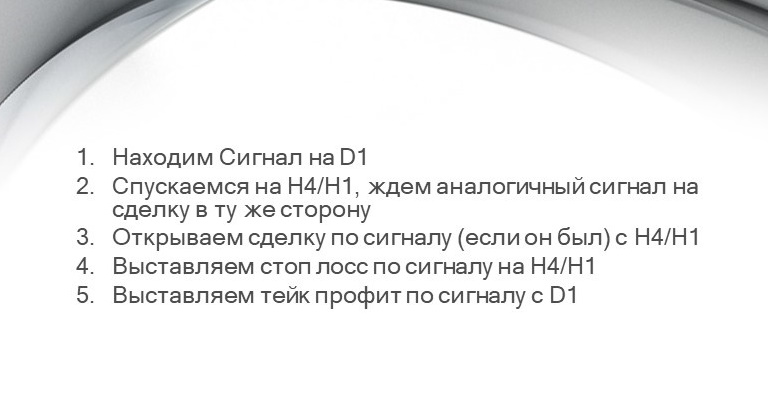
Let us summarize the simple rules of the structural analysis strategy of combined timeframes:
- Find a pattern on the D1 time interval
- Move to H4/H1 and wait for a signal from the same strategy
- Open a trade according to the rules of the strategy on H4/H1
- Set the stop-loss according to H4/H1
- Set the take-profit according to D1
Conclusion
It is worth noting that the proposed strategy will require additional Price Action skills. Searching for patterns requires great attentiveness and patience while waiting for confirming signals on each timeframe. However, this approach can increase entry accuracy and reduce the probability of false signals.
Risk management is the most important aspect of combining timeframes. When using smaller timeframes, you can determine more precise stop-loss and take-profit levels based on higher timeframes. This helps reduce risk and increase potential profit.
Like every new strategy, the idea of combining structural analysis of the market requires practice on a demo account in order to choose more suitable trading systems and practice matching signals.
