
Indicator "FX Forecast" - the future is already here
 Hello, dear readers of tradelikeapro.ru! As is known, all technical analysis is based on the fact that history tends to repeat itself. The trader's task is to identify repeating patterns and use them to build their own trading strategy that has a statistical edge. What does the "FX Forecast" indicator do? It looks for matches in history with the current situation and gives its forecast, the arithmetic mean of price movement in similar past cases, while also displaying the chart of the best match. All in all, it is an interesting thing :)
Installation
Installation of the "FX Forecast" indicator is performed according to the standard instructions. However, for the indicator to work correctly, I advise downloading the quote history for the currency pair on which you install "FX Forecast". How to load the history is described in the video lesson at the beginning of the post.
How does "FX Forecast" work?
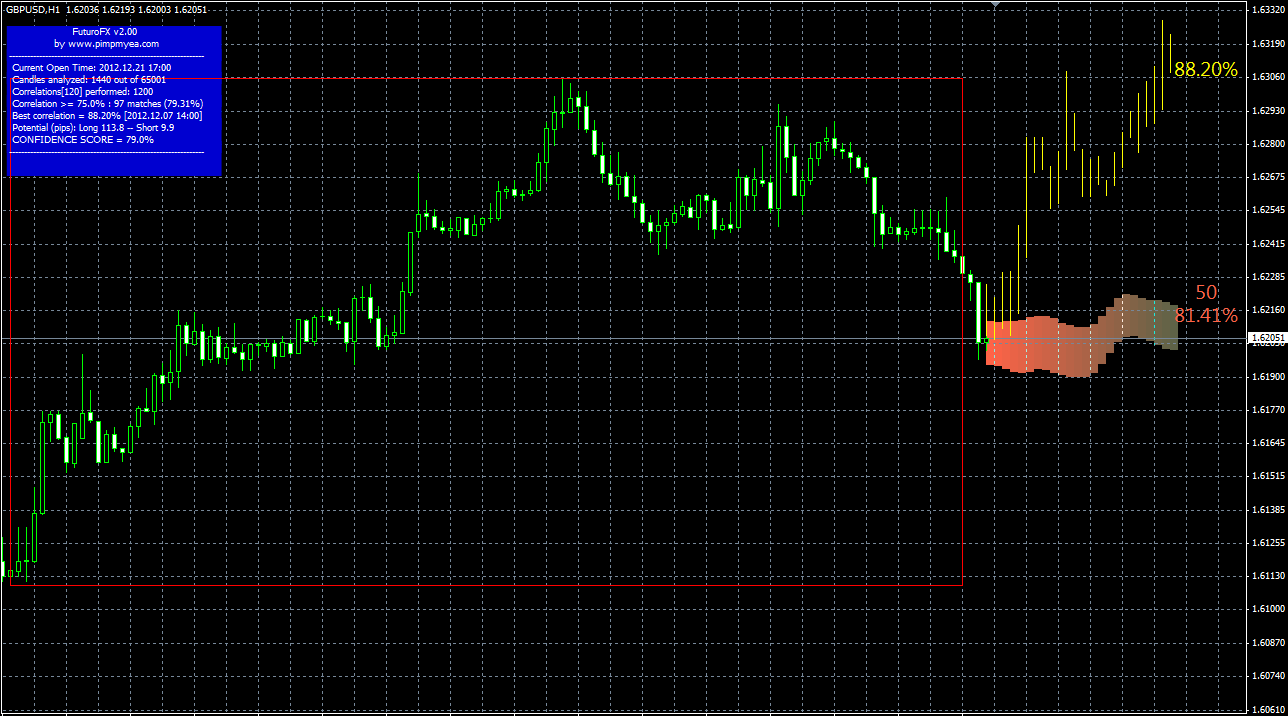
After installing the indicator on the chart (it works on any instrument, on any timeframe), you will see a picture similar to the screenshot below.
click the image to enlarge it
The "FX Forecast" indicator looks at a block of the last N candles on the chart (this can be set in the settings), then searches through history and analyzes blocks with the same number of candles. It calculates the similarity percentage of the similar blocks found and selects only those in which this percentage is greater than or equal to 75% (again, this can be changed in the settings).
Then "FX Forecast" analyzes the price movement that occurred in history after candle blocks similar to our current situation and outputs something like the arithmetic mean of the subsequent price movement in similar cases. This is displayed on the chart as an orange tunnel.
The best match found in history (with the highest similarity percentage) is displayed in the form of yellow bars.
Indicator information window
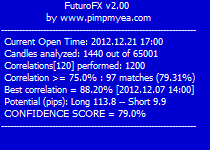
At the top left, "FX Forecast" displays an information window (it can be disabled in the settings) with the following information:
- Opening time of the current candle
- How many candles were analyzed from the entire history available in the terminal
- How many comparisons were made
- How many similar candle blocks were found with a match percentage of 75 and above
- Similarity percentage of the best match
- Potential upward and downward movement in points
- Overall indicator confidence rating for the forecast
Description of "FX Forecast" settings
- Look Back - how many recent candles on the chart to take for comparison with history. The number of bars in the block.
- Look Forward - how many candles ahead to issue the forecast for
- How many candles to take from history for analysis (the most recent data are analyzed). If set to 0, the entire available history will be analyzed.
- Correlation Data - comparison parameters. By default, OHLC is set, which means that the search for matches takes into account the Open, High, Low, and Close prices of each candle, and the resulting data array is summed and averaged. You can add the letters M (Median), T (Typical), W (Weighted). If you do not understand what this means, do not change anything.
- Cor Threshold - the match percentage above which the indicator will take data into account for outputting the average forecast. That is, all matches with a similarity percentage below the value specified in this parameter will not be considered.
- Select Best Correlations - how many matches at most to take into account for calculating the average forecast (the orange tunnel on the chart). If set to 0, all found matches with a high percentage will be taken into account.
- Display Options - the ability to disable part of the indicator interface on the chart. T - information window (blue, top left), A - average forecast, B - best match, R - rectangular highlighting of the analyzed candle block on the chart.
- Avg Projection Color - color of the averaged forecast
- Best Projection Color - color of the best match chart
- Text Size - text size on the chart
- Text Font - font
- Window Screenshot - "FX Forecast" has a function for taking screenshots automatically. If set to 0, the function is not used. If set to 1, the indicator will take a screenshot with each new bar, if 4 - every 4 candles, if 5 - every 5 candles, and so on. Screenshots are saved in the experts/files folder.
How to use "FX Forecast" ?
The "FX Forecast" indicator, like any other indicator, should not be used on its own. It can become part of your system, one of the filters for opening trades. If you still want to limit yourself only to this indicator, then try to combine its readings on several timeframes and enter the market only when the forecasts match across different time scales. More details about the principle of multi-timeframe analysis are explained in the lesson Three Screens of Elder.
Download the "FX Forecast" indicator

Sincerely, Pavel Vlasov
TradeLikeaPro.ru
It searches for matches in history with the current situation and gives its forecast, the arithmetic mean of price movement in similar past cases, while also displaying the chart of the best match.