
Forex Strategy "Cherry Blossom"

At midnight I looked: It changed its course The heavenly river. Hello, forex trader friends! In market trading we use strategies. Strategies, in turn, are based on market vulnerabilities and certain patterns, that is, recurring events. For a system to work well, that is, to be profitable, a somewhat unusual approach to the market is often used, sometimes contradicting logic. But if some approach brings profit, then why not, really? Unlike, say, boxing or figure skating, in trading there are no established rules, which means we can be cunning, using some "forbidden techniques," tricks, and ploys. Today we will talk about the "Cherry Blossom" trading system, which uses one of these very "tricks"
Trading System Characteristics
Platform: any
Currency pairs: AUDUSD, NZDUSD, USDJPY, AUDJPY, NZDJPY, AUDNZD
Timeframe: H1
Trading time: once a day
Recommended brokers: Alpari , Roboforex , TickMill
Trading System Basis

The strategy is called "Cherry Blossom" and, as you have probably already guessed, the main idea will be to use the movements characteristic of the Asian session; as they say, we go east. The strategy is not tied to a specific platform, and specific indicators are not used either. Of the graphical tools, we will only need Fibonacci levels.
One of the main axioms of trading is that a trend always tends to continue. In our case, a trend will be considered a candle that has moved at least 30 points from the opening point to the closing point, that is, there has been at least some directional movement.
As we remember from the Green Red Candle strategy, the probability that the next day the price will move in the same direction as the previous day is somewhat higher than the probability that the price will move in the opposite direction. That is, if we have a bullish candle, most likely the next day we will also see a bullish candle.
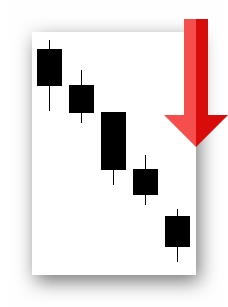
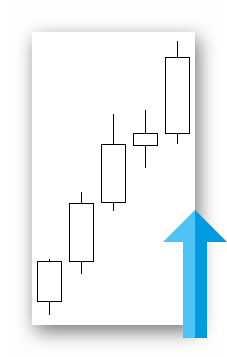
System Rules

Directional movements usually occur during the main trading sessions. That is, during the European or American session. But during the Asian session we usually have either a flat or a pullback in the opposite direction. This is exactly the premise we will use. That is, we will enter during the Asian session, in the direction of the trend of the closed daily candle. There is no trading on Fridays, because the meaning of the strategy is lost; from Friday to Monday, completely different logic applies.
First, open the chart of the currency pair, see the list at the beginning of the review, and turn on the display of period separators, vertical lines that divide trading days. In Metatrader, this can be done with the Ctrl + Y key combination.
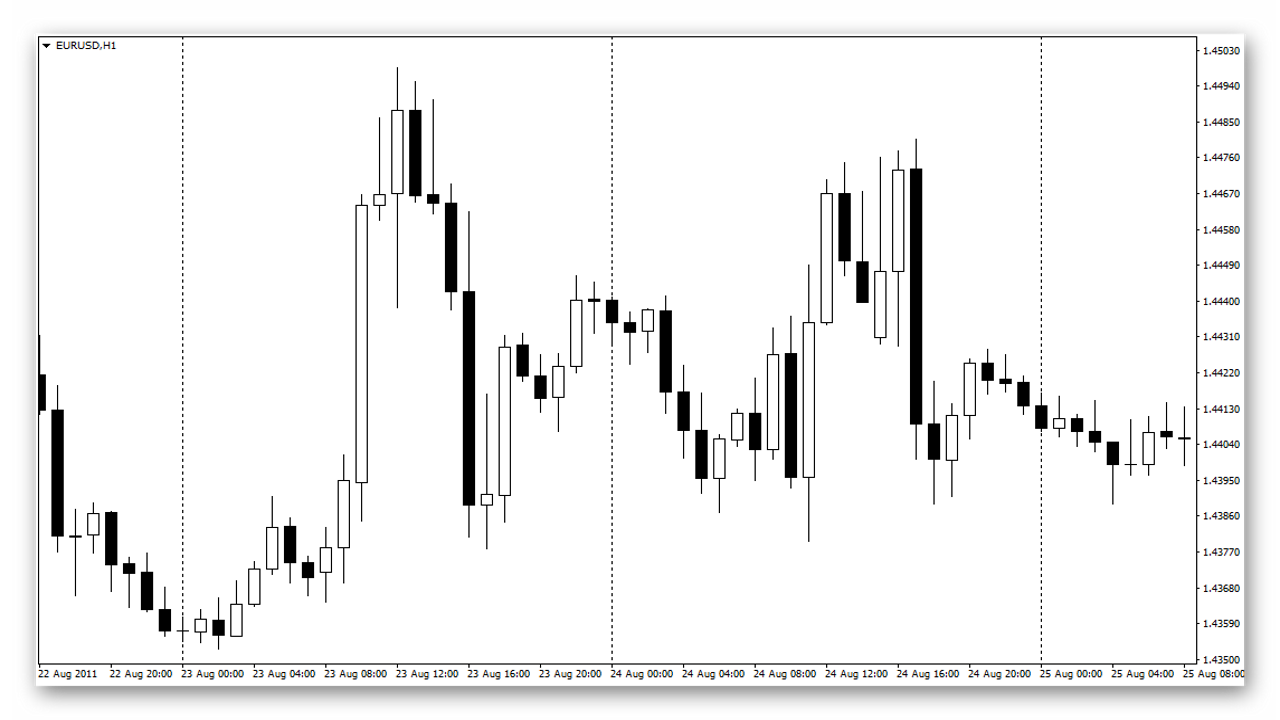
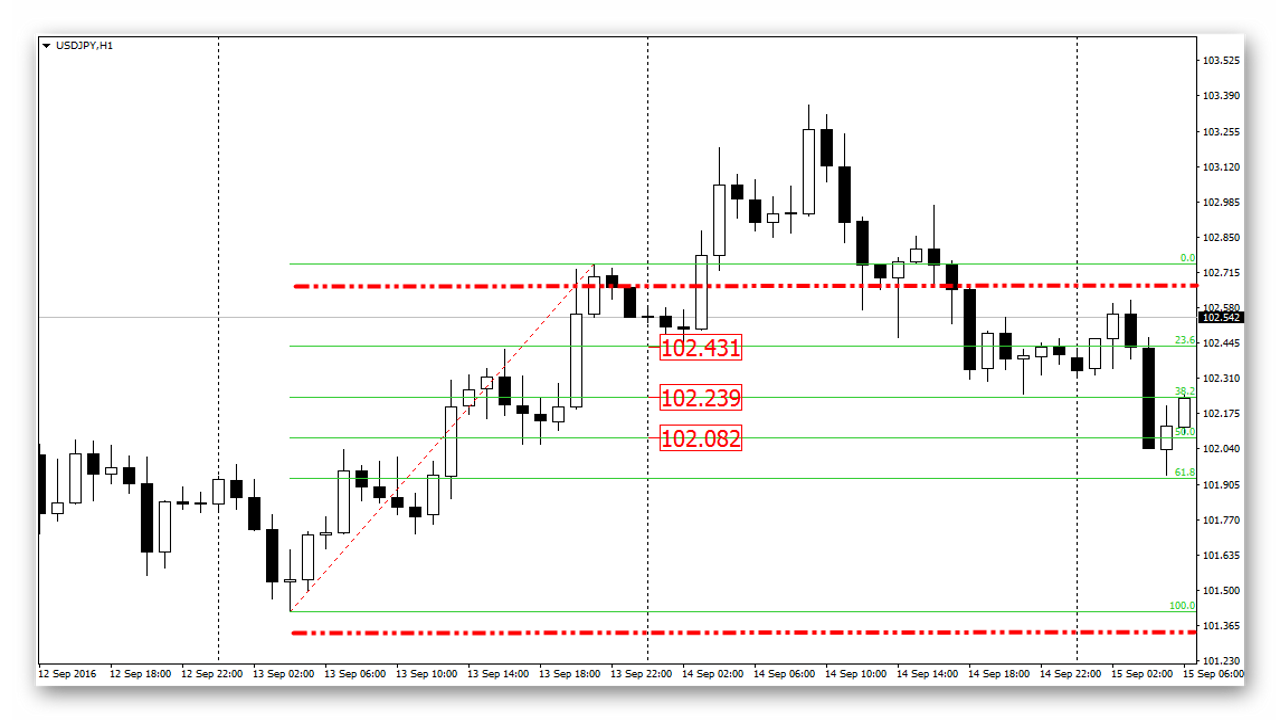
The first thing we look at is the size of the daily candle body. That is, the distance from the opening point to the closing point. The size must be at least 30 points. We will use Fibonacci levels to calculate entry points. In the case of a bullish trend, stretch the grid from the low to the high of the candle, from High to Low.
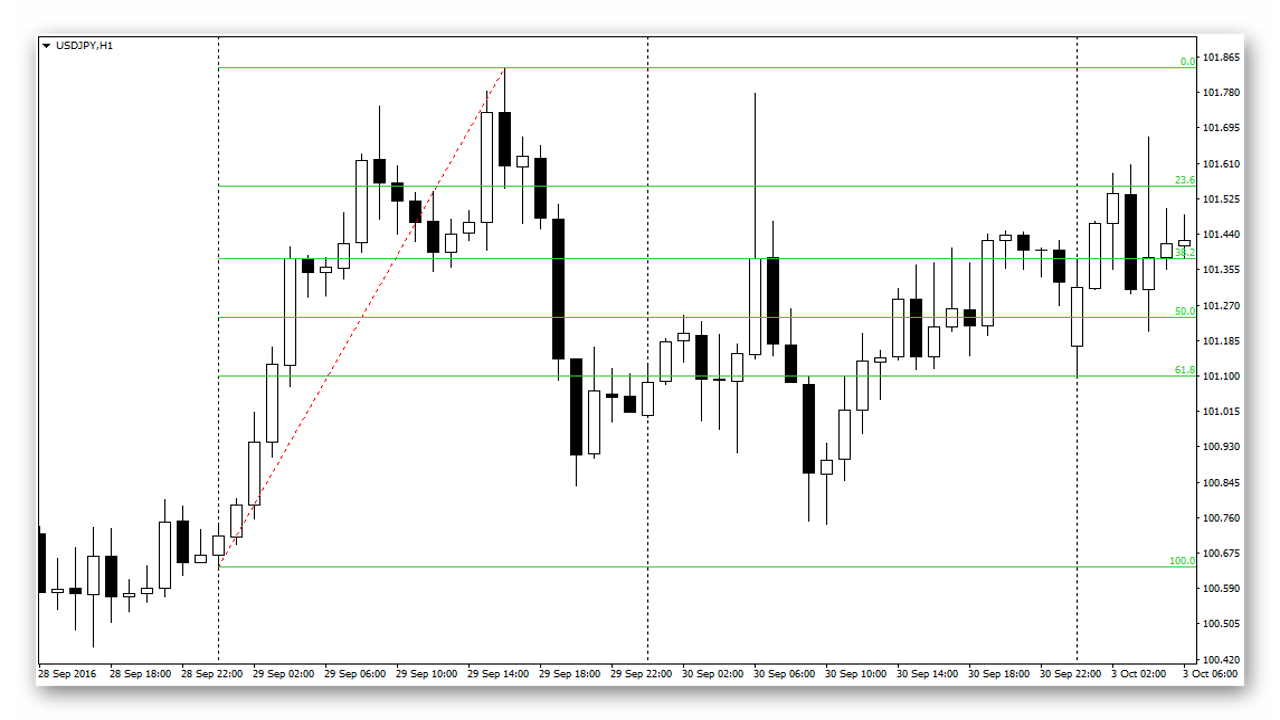
We do all actions at midnight. That is, immediately after the daily candle has closed.
After we have stretched the grid, we begin placing pending orders: buy orders if the candle was bullish, and sell orders if it was bearish. Orders are placed at the Fibonacci levels: 23.6, 38.2, and 50. The type of orders depends on where the price was at the moment of placement. In the case of a buy position, place a Buy Stop if the price was below the level, and a Buy Limit if it was above. For a buy, place the stop-loss slightly below the low of the candle, and the take-profit slightly below the high. Everything is exactly the same, only the other way around, for a sell position.
Additional Rules

- If there is an open position at the end of the day, we simply wait one more day until the orders close by stop or profit.
- If the open positions have not closed after two days, we close them manually, despite the floating result.
- In turn, pending orders that did not trigger are always deleted at the end of the day.
- If the take-profit triggered, the remaining orders, if any, are deleted.
- On Friday, we do not trade.
Money Management

As for money management, as usual you can use the lot calculator, which can be found in the "Tools" menu on our website. I do not advise setting the risk per position, that is, for all three orders, above 2%. That is, for one order the risk will be approximately 0.7%.
Examples
Example 1.
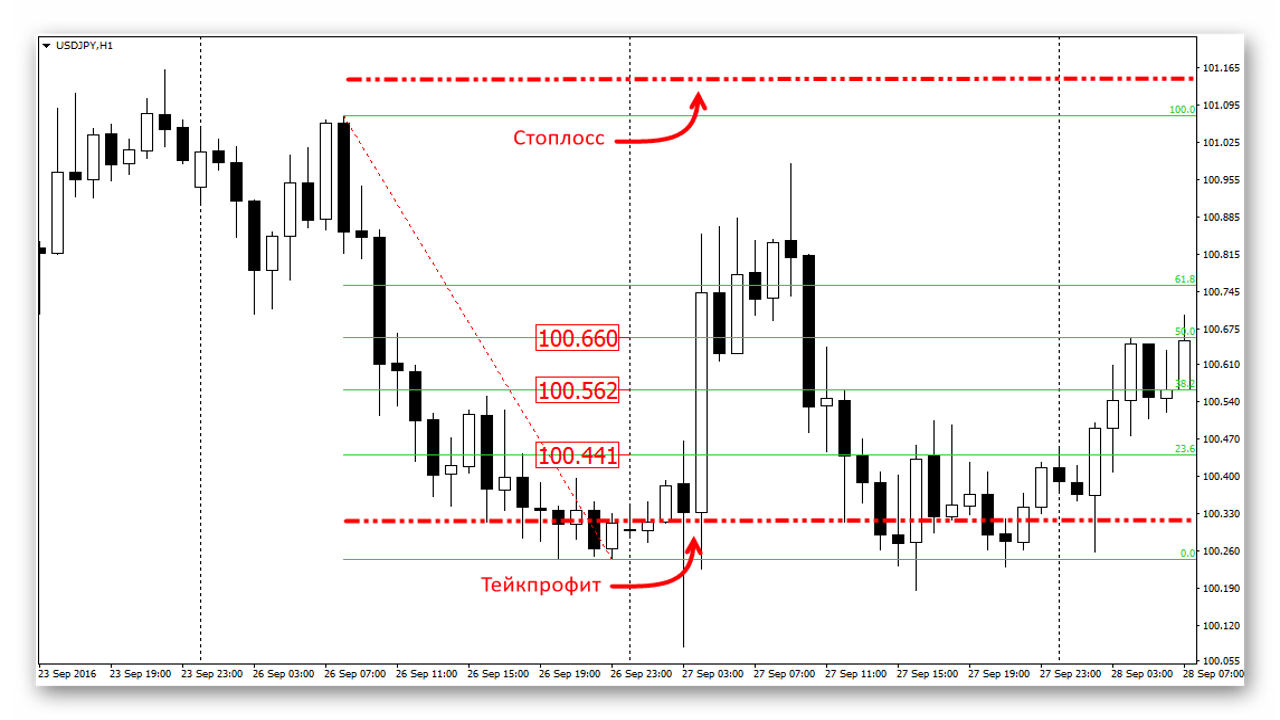
On the chart we have a bearish candle with a body of 70 points, which means we trade to the downside. Since at the time the orders were placed the price was below the levels, we place three Sell Limit orders. We set the stop-loss slightly above the high of the daily candle, and the take-profit slightly above the low. In this case, all 3 orders were activated, and the position closed at take-profit.
Example 2.
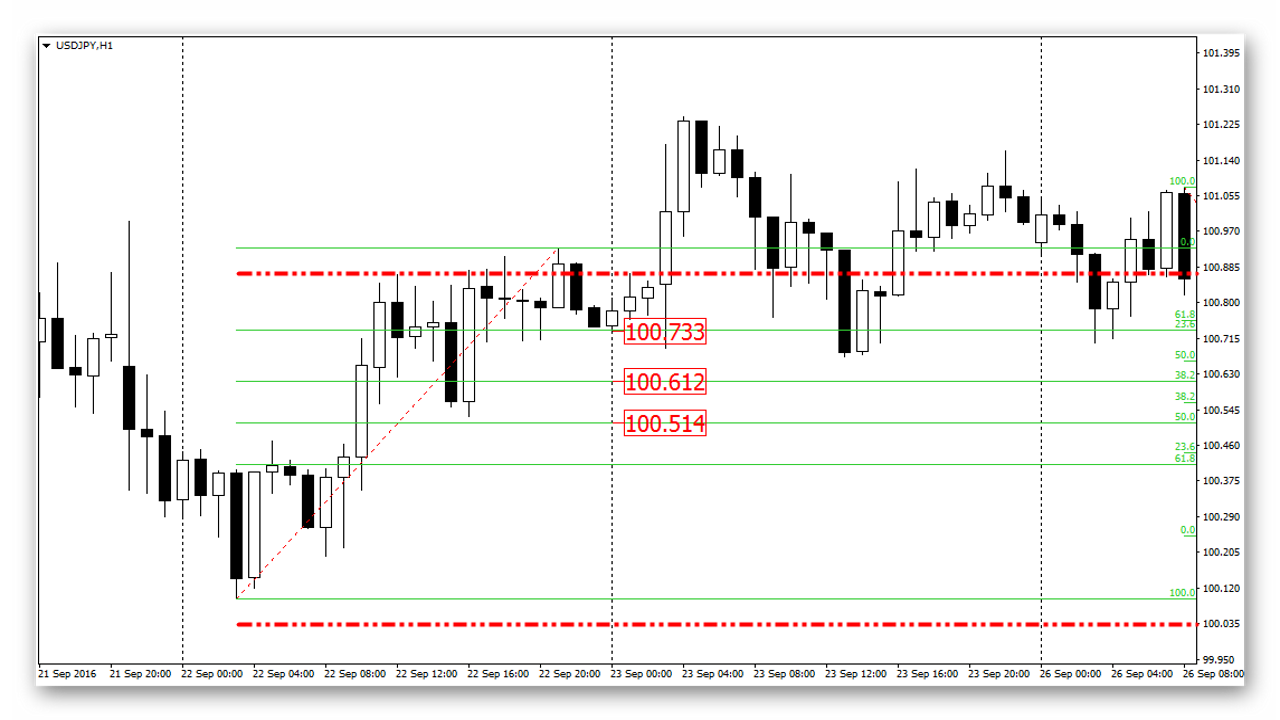
A bullish candle of 35 points. We place three Buy Limit orders at the 23.6, 38.2, and 50 levels. Only the topmost order was activated, after which it closed at take-profit.
Example 3.
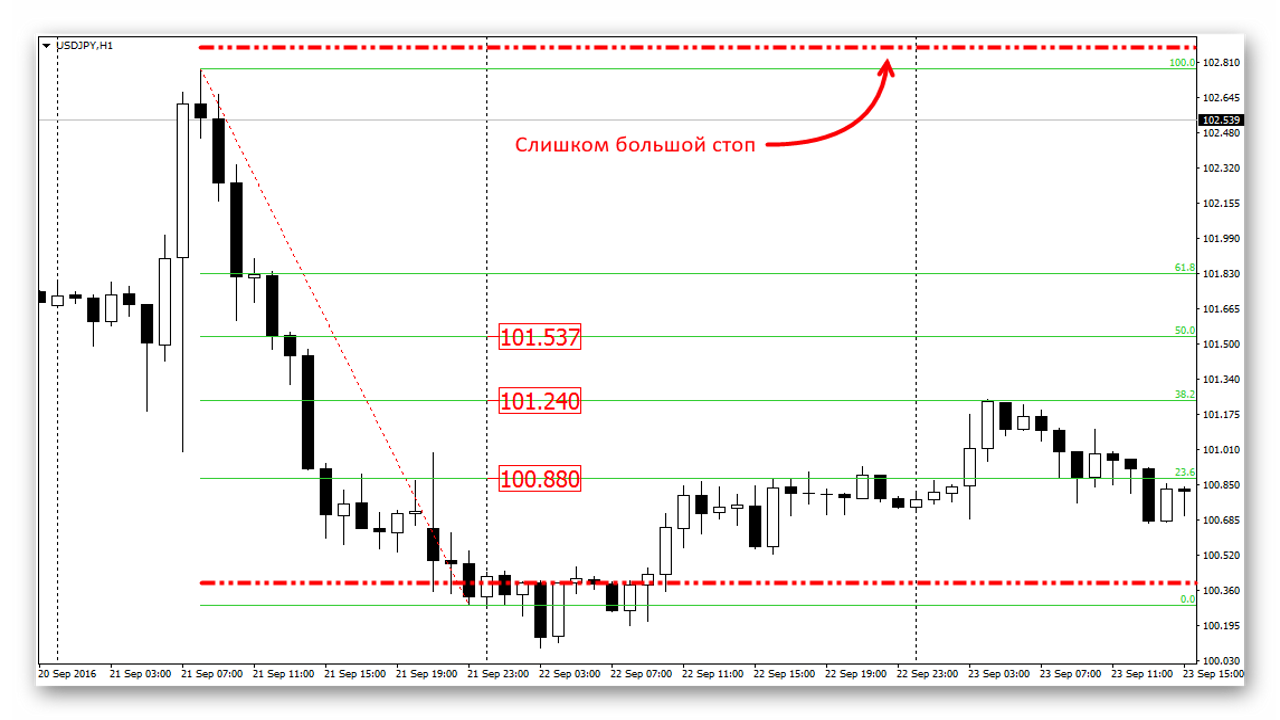
We have an enormous candle with a body of 140 points. Because of this, the stop is at a very large distance from the price; personally, I would not enter in such a case. We would close the only open order on the second day, with a small floating loss.
Example 4.
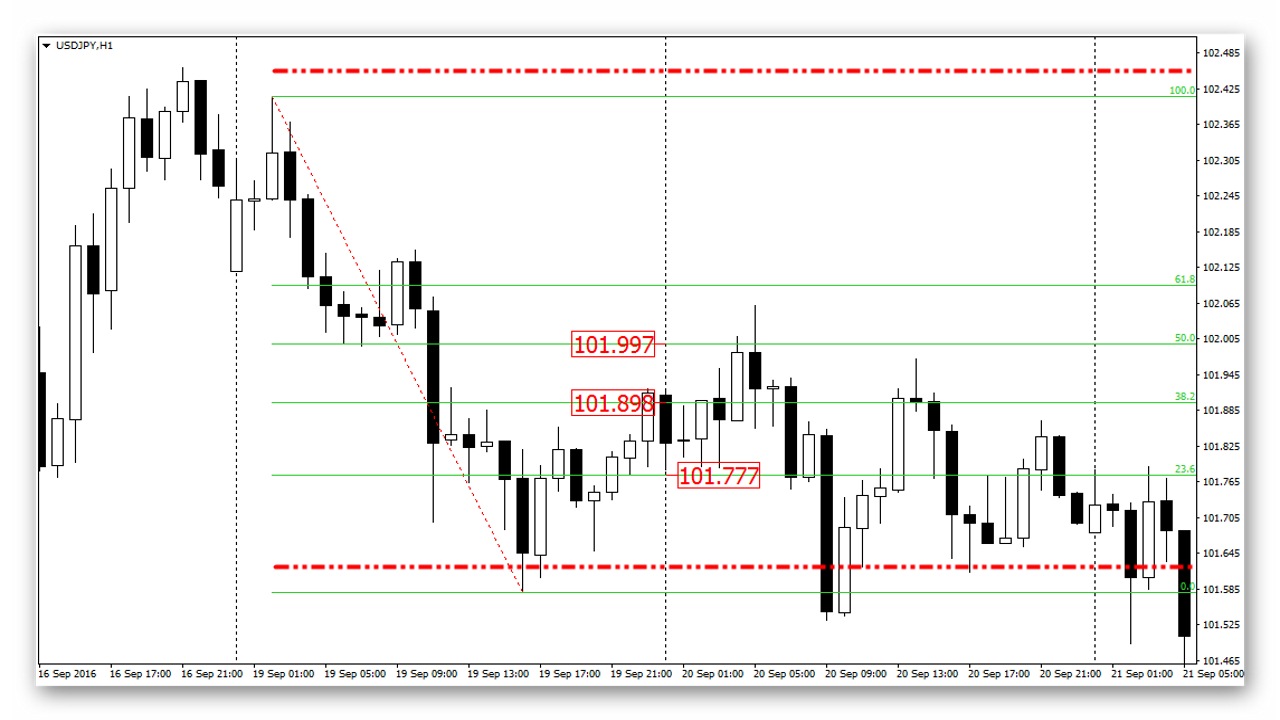
The daily candle is 40 points. In this case, all three orders were activated and the position closed at take-profit.
Example 5.
A candle of 60 points. One order was activated and closed at take-profit.
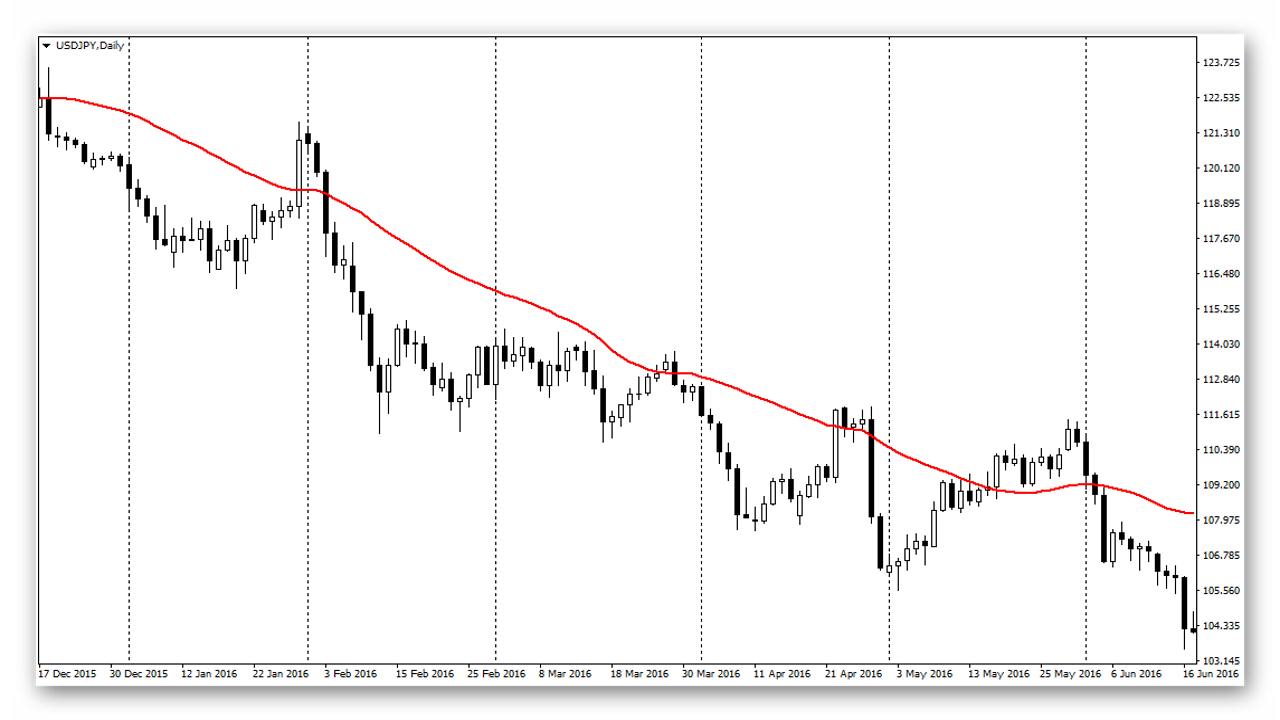
As additional filtering, we can use a trend that is longer-term than one candle. For example, after opening the daily chart, try applying a simple moving average to it. Thus, while the MA shows a downward trend, we ignore all buy signals and open only sell positions. Such a filter can greatly increase the percentage of profitable trades.
Conclusion

Of course, "Cherry Blossom" is not the holy grail, but at times, when it is possible to avoid market reversals and enter pullbacks competently, the strategy really does resemble "the one." The trading system under consideration has interesting points that, I am sure, you will be able to apply in your own trading strategies. Here we observe a sound idea of entering market pullbacks in the direction of the established move, and since the orders are placed after the daily candle closes, it is often possible to avoid particularly fierce daily reversals.
Forum Thread
Sincerely, Pavel Vlasov
TradeLikeaPro.ru
Today we will talk about the "Cherry Blossom" trading system, which uses one of these very "tricks."