
DeMarker: Learn Everything About the Classic Indicator

Among the tools of technical analysis, a special place is occupied by oscillators - indicators whose curve changes within a limited range: from zero to one or to 100. They are indispensable for identifying areas of a possible trend reversal - overbought and oversold zones.
In today's review, we will get acquainted with the classic DeMarker oscillator.
Indicator Characteristics
Platform: Any
Currency pairs: any
Timeframe: D1
Trading time: around the clock
Author's setting recommendations: indicator period - 13 days
Recommended brokers: Alpari, InstaForex, TickMill
Oscillators are often included in trend trading systems as filters that prevent entries at the top of growth or at the bottom of a decline. Some traders use these signals in money management or countertrend trades.
A major downside of oscillators is the prolonged stay of the curve in overbought and oversold zones during a strong trend. A trader loses the ability to objectively assess the current market movement, constantly expecting a trend reversal, which leads to a premature exit from the position.
Thomas DeMark became the first technical analyst to solve this problem with the formula of the proprietary DeMarker (DeM) indicator.
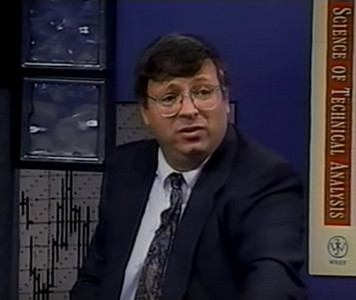
The oscillator first appeared in his book "Technical Analysis - A New Science of the Market." The indicator is present in all standard packages of technical tools on Forex trading platforms.
Description of How the Indicator Works

The indicator curve shows the current price position relative to previous highs and lows over the indicator calculation period set by the trader. Thomas DeMark used in the formula only those extremes that updated the previous high or low. All other maximum and minimum price values that did not exceed the previous peak or bottom were equated to zero.
The resulting series of numerical samples was smoothed using simple moving averages, the calculation of which ensured a "fast" return of the DeM curve from overbought/oversold zones during any, even short, period of flat movement under a strong trend.
In its final form, the DeMarker formula looked like a fraction of the average highs of daily candles MA (D1max), brought to a denominator of MA (D1 max) + MA (D1 min):

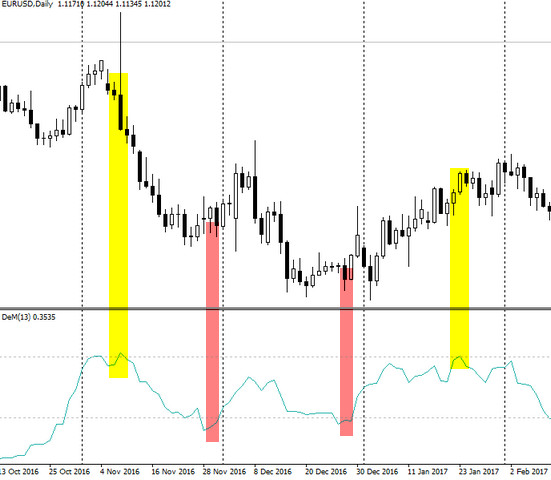
As can be seen from the formula, the fraction limits the indicator's variation within the range from 0 to 100. Thomas DeMark specifically highlighted the 70 and 30 levels as zones of possible completion of trend growth or decline.
Using the Indicator in Trading

The classic signals of the indicator coincide with the traditional strategies for using oscillators. A trader gets the opportunity to prepare in advance for a trend reversal at the first crossing of the 70 level by the DeMarker curve from below upward:
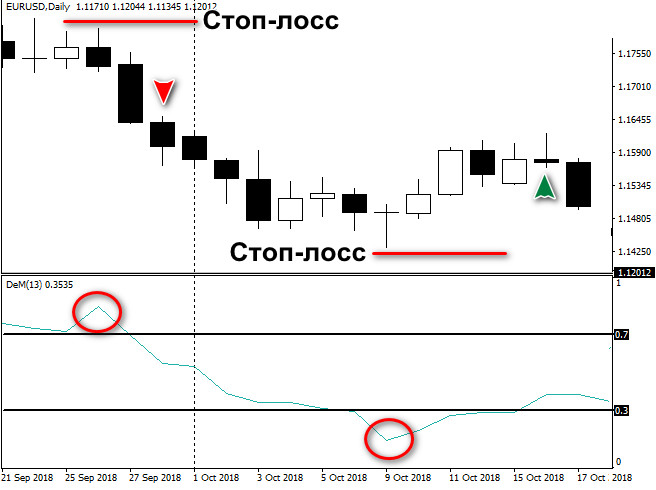
The system provides for a reversal approach, with the position held until an opposite signal appears. In the case of a short, this will be a signal of a crossing of the 30 level; a long can be closed at the first DeM values above 70.
Stop-loss is set at the nearest extremes behind the wick of the candle that coincides with the maximum or minimum DeMarker value in the overbought/oversold zones.
The most effective are considered to be countertrend trades based on divergences - detected discrepancies between currency trends and the direction of the indicator curve. The figure below shows how the oscillator curve steadily rises after a low in the overbought zone. At the same time, the EURUSD rate continues to fall, setting new lows.
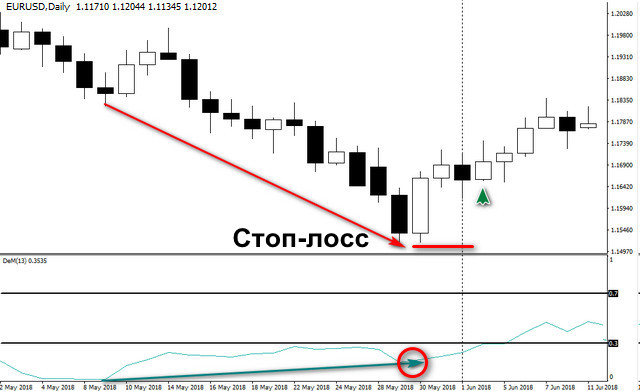
As soon as the DeM curve rises above 30, a Buy can be opened by placing a stop-loss at the nearest indicator low.
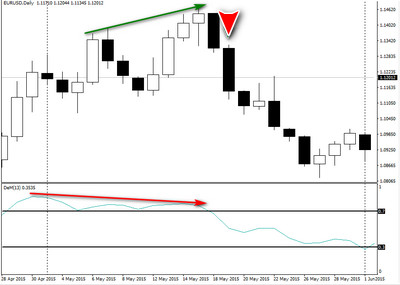
A similar strategy is used when a divergence of the indicator with the upward movement of the EURUSD pair is detected. A SELL order is opened after a new high in quotes, which is higher than the previous extreme at the moment the DeM line falls below the 70 level.
As can be seen from the figure, the DeMarker curve remained in a downtrend in the overbought zone for more than 10 sessions, during which two divergences with the EURUSD growth chart occurred, but the sell signal appeared only on the twelfth candle.
The DeM indicator is rarely used on its own, playing the role of a filter in trend trading systems. The figure below shows a prolonged uptrend identified using moving averages - an EMA with a period of 50 and a fast EMA with a period of 12 days.
The figure shows how DeMarker divergences accurately help identify resistance, trend reversal, and support. After divergences appear, a flat zone emerges where traders, relying on the signals of moving averages, lose money on false signals.
Entry based on the combination of graphical double top and double bottom signals with DeM divergence solves the problem of flat-market losses. An additional advantage of combining DeMarker and trend indicators is the intermediate locking in of partial profit at the intersection points of the 70 and 30 lines.
Installation and Settings

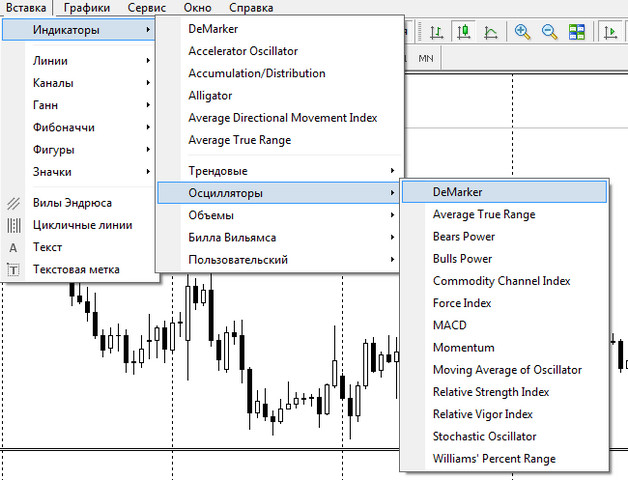
In the Metatrader 4 trading platform, the DeMarker indicator is located in the "Oscillators" section, under the "Indicators" option in the "Insert" menu.
The "Input Parameters" tab of the oscillator settings window offers the trader a choice of period value. By default, the value is set to 14, but Thomas DeMark suggested sticking to the value 13 for the D1 chart.
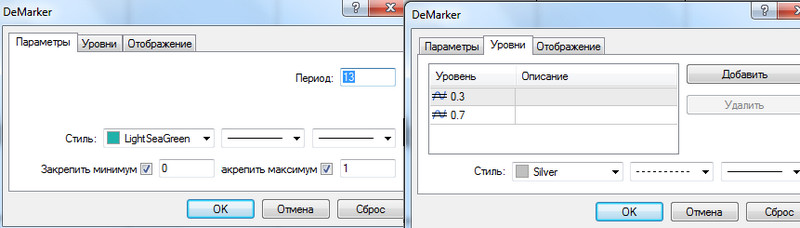
The parameters on the "Levels" tab match the author's view: the overbought zone is defined by the value 70, and the asset is considered oversold when the indicator curve drops below 30.
Conclusion

Replacing local highs and lows that cannot update the previous extreme with zeros has a distinctive effect on the calculation of the moving average, making the DeM line sensitive to prolonged flats at the top and bottom of the market. Very often in these zones, large players build positions in order to reverse the trend.
Among oscillators, DeMarker divergence gives the most effective signal. It was precisely in this way that Thomas DeMark often accurately identified changes in global trends, and the accuracy of his forecasts was repeatedly recognized with various awards. The author's indicators were recognized as some of the best technical analysis tools by Bloomberg Markets magazine in 2012.
Respectfully, Alexey Vergunov
Tlap.io
