
Technical Analysis for Cryptocurrencies on 30.10.2017
BTCUSD
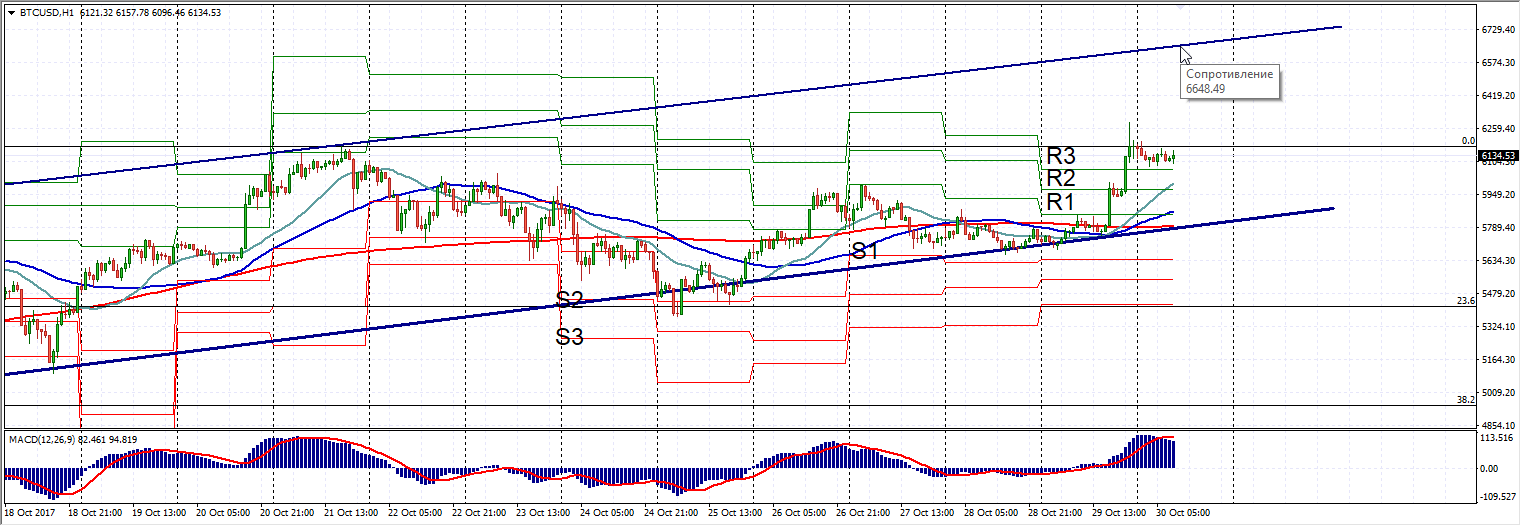
Over the weekend, Bitcoin showed itself in all its glory by fulfilling the scenario of updating the all-time high. The most productive period for the asset was the second half of Sunday, when in 6 hours the BTCUSD pair added more than $500, touching a new price extreme at $6291. As a rule, any move to a new high must a priori be accompanied by a correction, if only so that buyers have an opportunity to regroup and lay a new technical foundation for even greater growth.
The current situation was no exception. On the pullback, Bitcoin retreated below the zero Fibonacci level and, despite the high probability of an even deeper decline, we recommend relying on the current technical picture, which, frankly, is not very different from the old one. True, the buy signals have become more obvious. Bitcoin left behind at once an entire cluster of Pivot resistances (R1, R2, R3). Somewhere far below, the fast and slow moving averages continue to build out. Even EMA25, as the fastest of them, still cannot catch up with the price. BTCUSD is at the median mark of the long-term ascending channel that has kept the coin within its boundaries for several months. Guided by past experience, the accumulation of volumes in similar conditions may end with another growth wave toward the next target at $6650.
DSHUSD
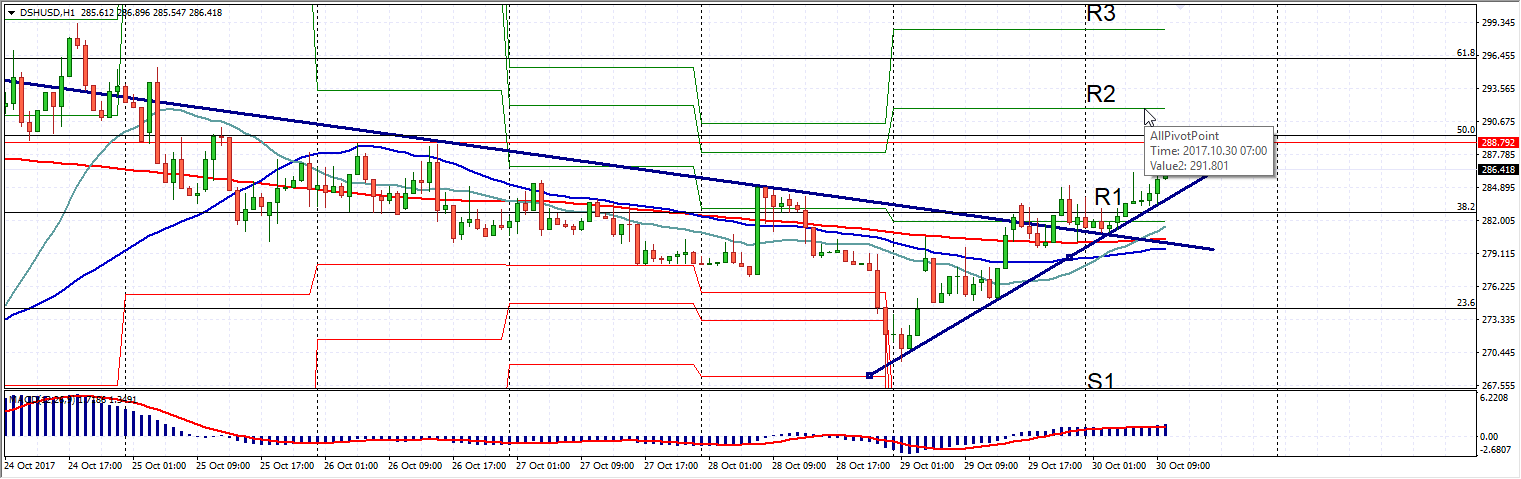
Dashcoin gave in to the general euphoria and, on sharply increased volumes, left the area of the descending channel. However, it is worth noting that first it pleased us as well by touching the target at $274.6. Last Sunday, the initiative completely passed to the buyers, who threw Dash above the 38.2 Fibonacci level. At the moment, DSHUSD is leaning quite successfully on the local uptrend line, which may already in the coming hours lead the asset to the 50 Fibonacci level. MACD also speaks in favor of continued growth: the indicator remains in positive territory, acting in a synchronous link with the signal line. In addition, Dash managed to gain a foothold above the moving averages and the first Pivot resistance level (R1). By the way, this frontier was overcome without the slightest correction, which points to the clear presence of a powerful growth catalyst. The simplest explanation for buyer activity may be related to the rise of the main crypto asset, Bitcoin, which supports market sentiment. Considering the above, the current bullish impulse may well be sufficient for an equally successful overcoming of the next Pivot mark, the R2 level corresponding to $291.80.
ETHUSD
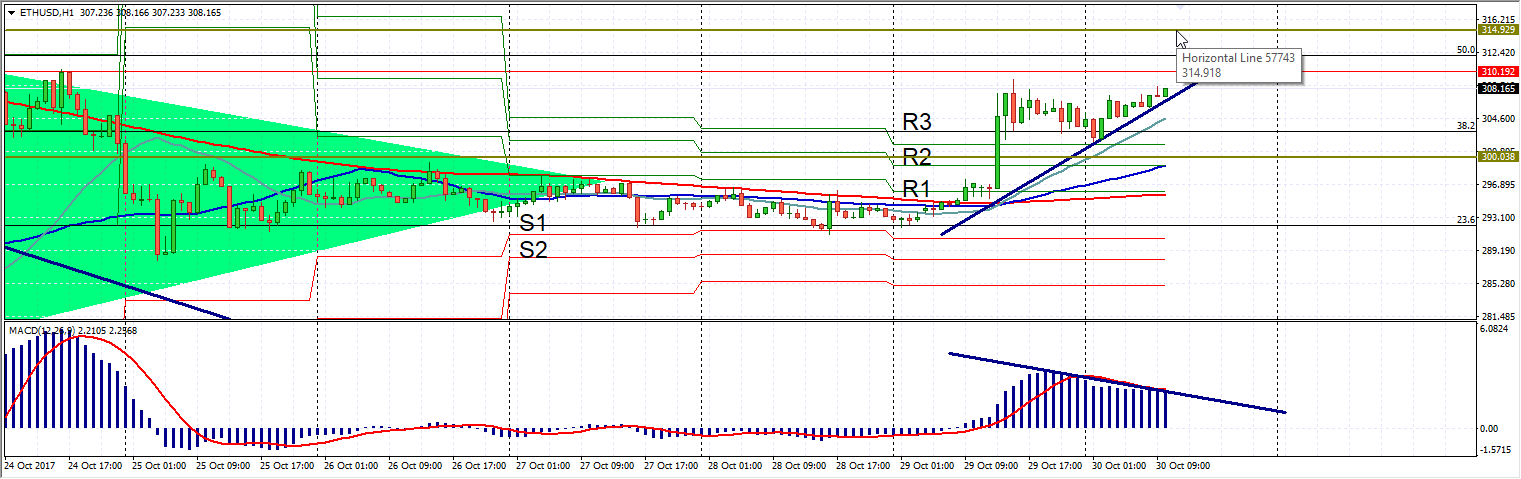
Ether worked out the triangle technical formation perfectly and, having overcome the previously designated target of $302.11, consolidated above it. The main growth of the asset also came on Sunday. It is worth noting that movements in Ether began earlier than in Bitcoin, which involuntarily suggests the idea of the true barometer of market sentiment. Be that as it may, ETHUSD retains a brisk attitude in Monday's Asian session as well, preparing to test the next Fibonacci level with the boundary mark of 50. Ether is holding confidently above the 300.00 resistance, EMA 200, 50, and 25. The divergence formed on the MACD radar is a bit alarming, however the asset's position above all Pivot resistances, plotted from the weekly market rotation, easily suppresses all doubts. The buyers also have the overall market mood on their side, forcing all altcoins represented in the industry to rise. Against this background, we recommend looking at the possibility of ETHUSD consolidating above $315.00. A stop can be placed below support 300.
Material provided by the analytical department of AMarkets
Over the weekend, Bitcoin showed itself in all its glory by fulfilling the scenario of updating the all-time high.