
Contrast Indicator - A Decent Foundation for Scalping

Hello, ladies and gentlemen, forex traders! Many people want to have a universal indicator that can be used on various timeframes from small ones to daily. In addition, of course, the informativeness of the indicator itself is important. In today's article, we will talk about the Contrast indicator: a universal tool suitable both for scalping and for longer-term trading. The main principle of the indicator is based on determining contrast. That is, to determine the true nature of the current movement, it is necessary to compare it with the movement preceding it. This approach allows you to catch new movements in the market that are highly likely to continue.
Indicator Characteristics
Platform: Metatrader 4 Currency pairs: Any Time period: Any Trading time: Around the clock Recommended brokers: Alpari, Forex4you, Exness
Indicator Setup

Installing the indicator is similar to installing any other indicator for the MT4 terminal. The indicator itself is presented in two variations:
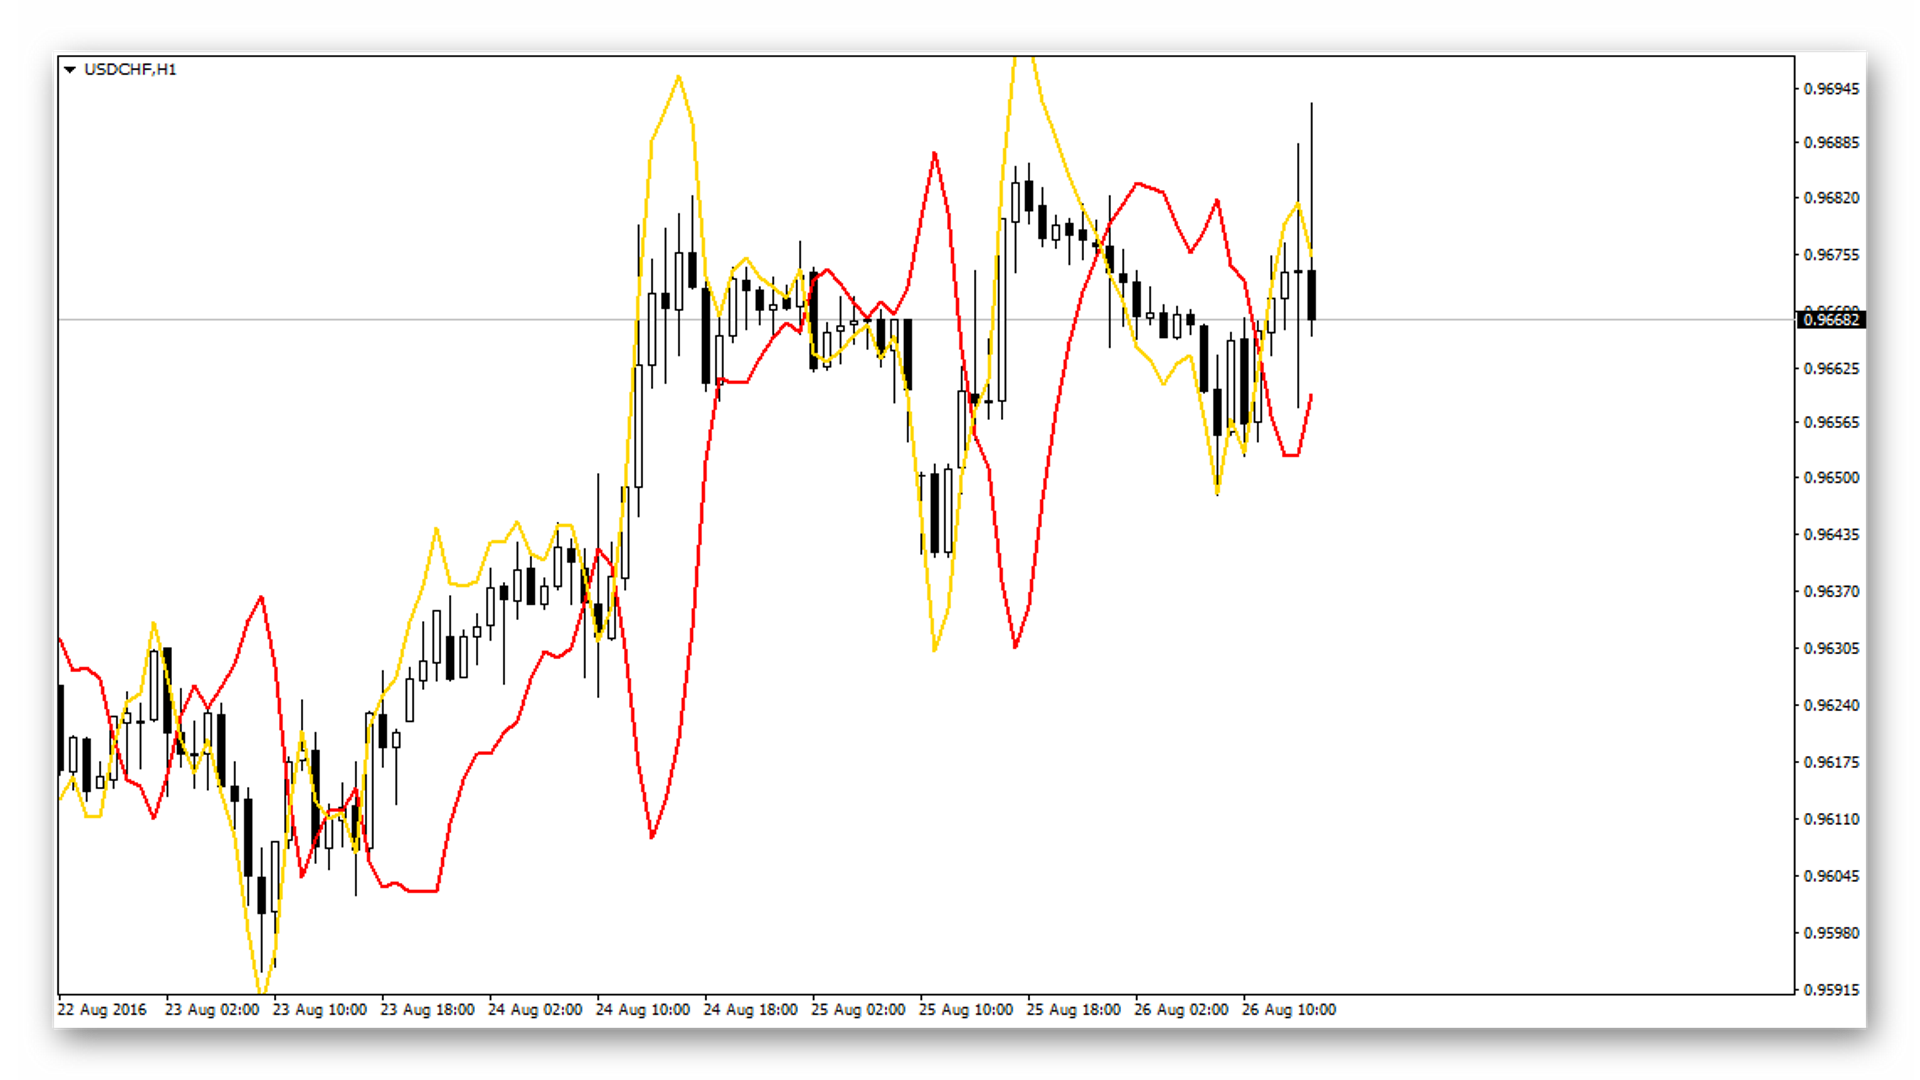
- The first is in the form of lines on the chart, forming a kind of channel. This indicator has only one parameter - coeff. Increasing the coefficient spreads the lines even farther apart, and therefore they require more time to cross. You can also set a negative coefficient, then signals will appear more often. Such a function may be needed by traders trading binary options.
- The second is in the form of a histogram in a separate window, which shows the indicator values from different timeframes. In the settings, you can also specify the coefficient and the values of three timeframes, including the current one. The lines will be displayed from bottom to top, in this case: Day, Week, Month.
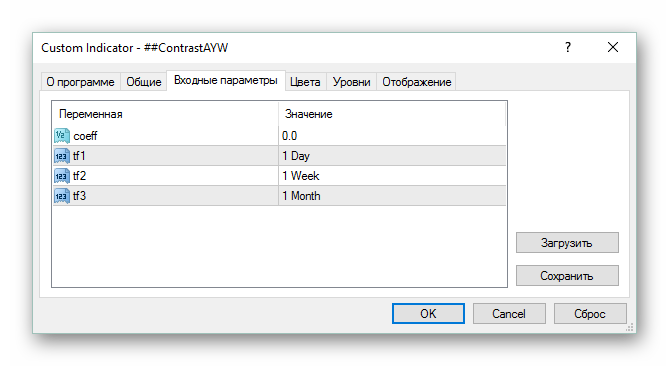
The second indicator is a more compact interpretation, which allows you to save space on the chart. The second version uses the original indicator for calculations, so the presence of both in the terminal data directory is mandatory.
An important characteristic of the Contrast indicator is the absence of repainting. Only the value on the current bar is repainted, while the entire calculated history remains reliable even after restarting the indicator or the terminal. Thus, the indicator is quite suitable for manual tests on history.
Core Idea

The author of Contrast describes the idea embedded in the indicator with the help of two postulates.
- First, the future market movement cannot be predicted with a probability greater than 50%;
- Second, an already established trend will continue with a probability greater than 50%.
That is, the probability that entering a trade in the direction of an already formed movement will bring profit is always somewhat higher than entering the market at random. The idea of the Contrast indicator is to oppose the current trend to the past movement. This may be a change in the main movement, or, in the case of especially strong signals, the formation of a new movement after a flat. That is, when we notice a trend change, we try to enter in the direction of the movement or trade on contrasts.
Initially, the indicator consisted of one "Contrast" line (the red line on the chart), which moved in the opposite direction of price. The price goes up, the contrast line goes down - we have an upward trend. Conversely, the price goes down, the contrast line goes up - a downward trend. The entry signal is the crossing of the contrast line with the price. Subsequently, the place of the price was taken by another line of the author's design. The new filter enhances the informativeness of the indicator and slightly smooths the quote flow.
Testing

The entry signal is determined very simply, especially in the case of the histogram version.
Buy signal:
The yellow line crosses the red one from bottom to top, or a green bar appears on the histogram.
Sell signal:
The yellow line crosses the red one from top to bottom, or a red-colored bar appears on the histogram.
To test the idea in the strategy tester, one of the forum members wrote a simple expert advisor. Fixed stop-loss and take-profit levels are used to lock in profit. Also, the order can close by trailing stop (configured through the properties).
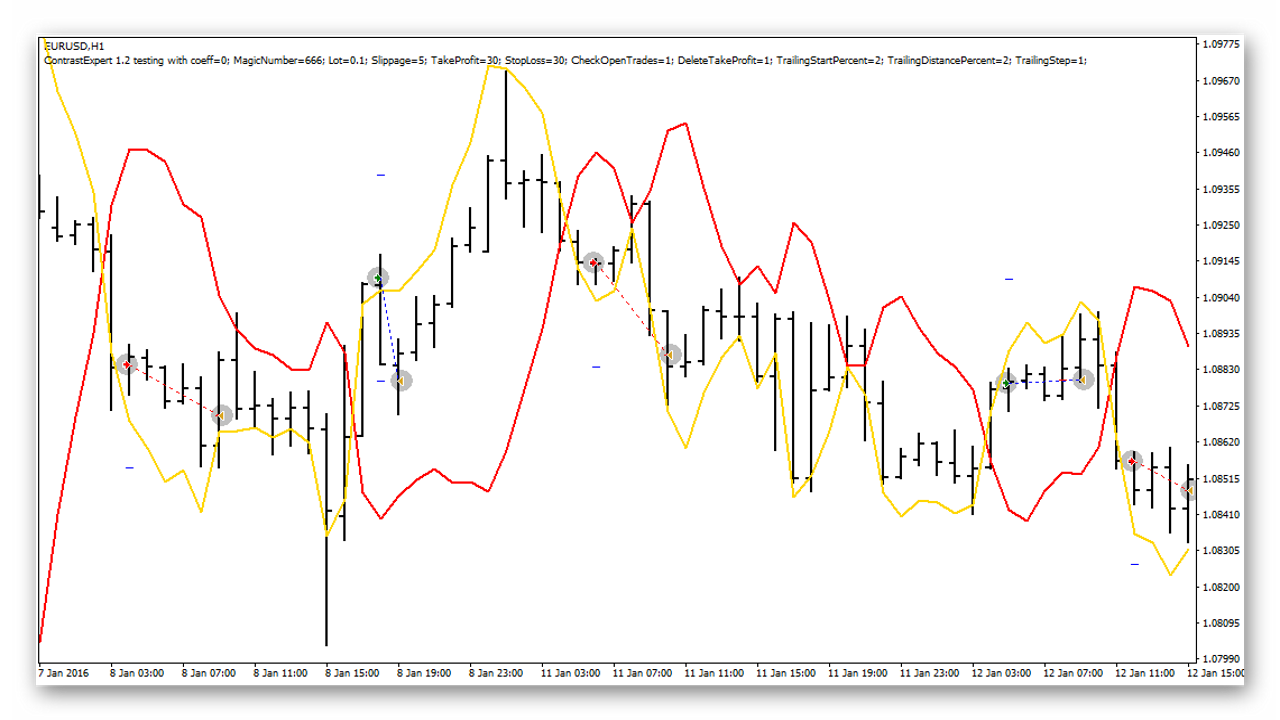
After tuning the parameters, decent profit was obtained on the four-hour chart. According to the test results, the indicator shows the most reliable signals on the H4 and D1 timeframes.
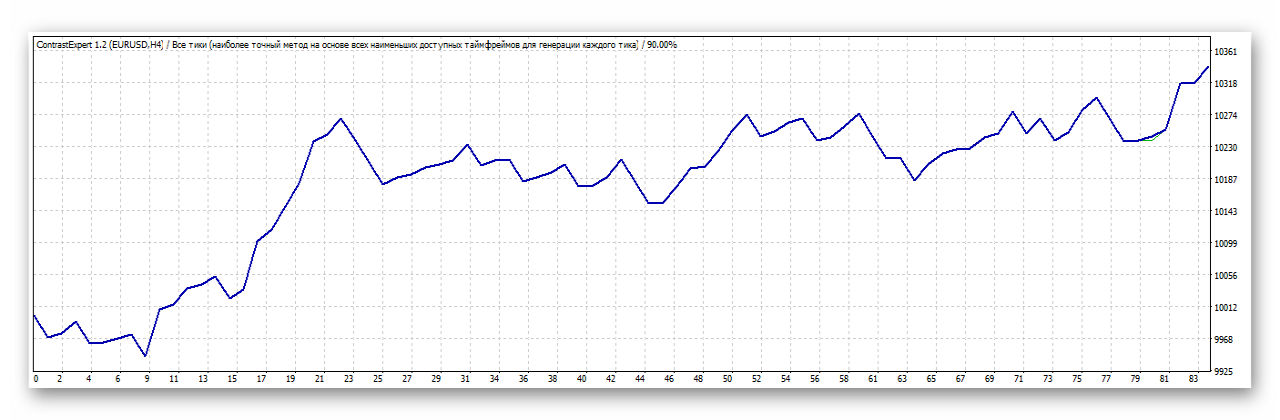
Also, judging by the results of the preliminary tests, the indicator is capable of generating profit even without additional filters. But do not forget that any indicator is only part of a strategy, and it is dangerous to work with it alone.
Contrast gives us a direct signal for entering a position. Thus, we only have to calculate the size of the stop-loss and take-profit. For a filter, you can apply the same Bollinger Bands or classic support and resistance levels. Also, the indicator itself can be used as an auto-filter. There is an opinion that a signal received simultaneously from several timeframes is much stronger. As an option, you can enter the market only when all 3 histogram timeframes show a signal in one direction.
Conclusion

Despite the inspiring results, try not to use this indicator alone. Trading on the signals of a single indicator is a common mistake of beginners. Also, do not forget that there is no perfect tool on the market. By adapting your work with the indicator to yourself, perhaps by adding several reliable filters, you may be able to achieve results worthy of trading on a real account, but above all, always try to conduct deep historical testing.
Download the Contrast Indicator

Respectfully, Pavel Vlasov TradeLikeaPro.ru

In today's article, we will talk about the Contrast indicator: a universal tool suitable both for scalping and for longer-term trading.