
CMI - a Market Choppiness Indicator

Each of us has faced the problem that when there is a trend, all strategies work like clockwork, but when a sawtooth "up-down" movement begins, even good, proven forex strategies take losses. So how do we determine when it is not worth entering the market? CMI (Choppy Market Index) will help us with this - a market choppiness indicator.
CMI is a simple indicator that calculates the difference between the close of the last (current) bar and the close N bars ago, and then divides this value by the difference between the highest HIGH and the lowest LOW among those bars. The resulting number is multiplied by 100 to give a clear display of market "choppiness" in a range from 1 to 100.
 The indicator, as well as the strategy based on it (see below), was invented by Daniel Fernandez; material on trading with CMI was published in the August issue of Currency Trader magazine.
The indicator is installed just like any other; if you have difficulties, see How to install an indicator in MT4. After attaching CMI to the chart (timeframe and pair of your choice), we get a picture like this:
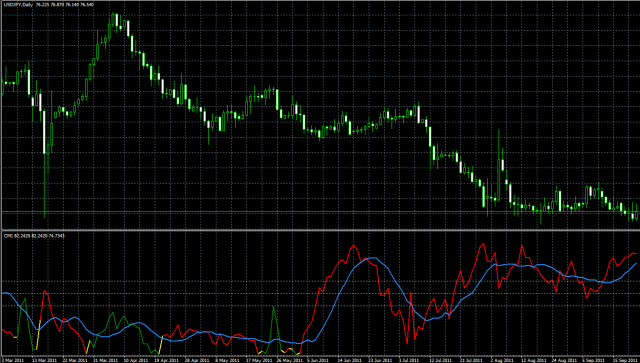
As many have already guessed, the lower the indicator value, the more choppy the market. And the higher its value, the more obvious the presence of a trend. The turning point (that is, when we can say that a trend has changed to unclear movement and vice versa) roughly corresponds to the 50 level.
The author also offers us a strategy based on the CMI indicator for trading on daily charts. Interestingly, 2 sets of rules are proposed: for trading in a choppy market and for trading when a trend is present.
CMI Strategy Rules
Trading in a choppy market
1. Buy when the moving average (blue line) of the CMI indicator is below 40 and the CMI line itself is red.
2. Sell when the moving average (blue line) of the CMI indicator is below 40 and the CMI line itself is green.
3. Exit the position when CMI exceeds 50.
Trading in a trending market
1. Buy when the blue moving average is above 60 and the color of the CMI line is green.
2. Sell when the blue moving average is above 60 and the color of the CMI line is red.
3. Exit positions when CMI drops below 50.
I would not advise trading using the strategy described above; it is given rather to understand how the CMI indicator works, as well as its possible use for filtering signals in trend-following strategies.
P.S. The tradelikeapro.ru blog has recently got a Vkontakte group; I invite all readers to join the group "Forex Traders Community" :) .
Download the CMI (Choppy Market Index) indicator

Important! Installation nuances in new Metatrader 4 builds
Each of us has faced the problem that when there is a trend, all strategies work like clockwork, but when a sawtooth up-and-down movement begins, even good, proven forex strategies take losses.